
Be[In]Crypto takes a look at the five cryptocurrencies that increased the most last week, more specifically, from July 22 to 29.
These cryptocurrencies are:
- Optimism (OP) : 98.47%
- Ethereum Classic (ETC) : 67.99%
- Bitcoin Gold (BTG) : 55.75%
- Qtum (QTUM) : 34.64%
- Ravencoin (RVN) : 28.30%
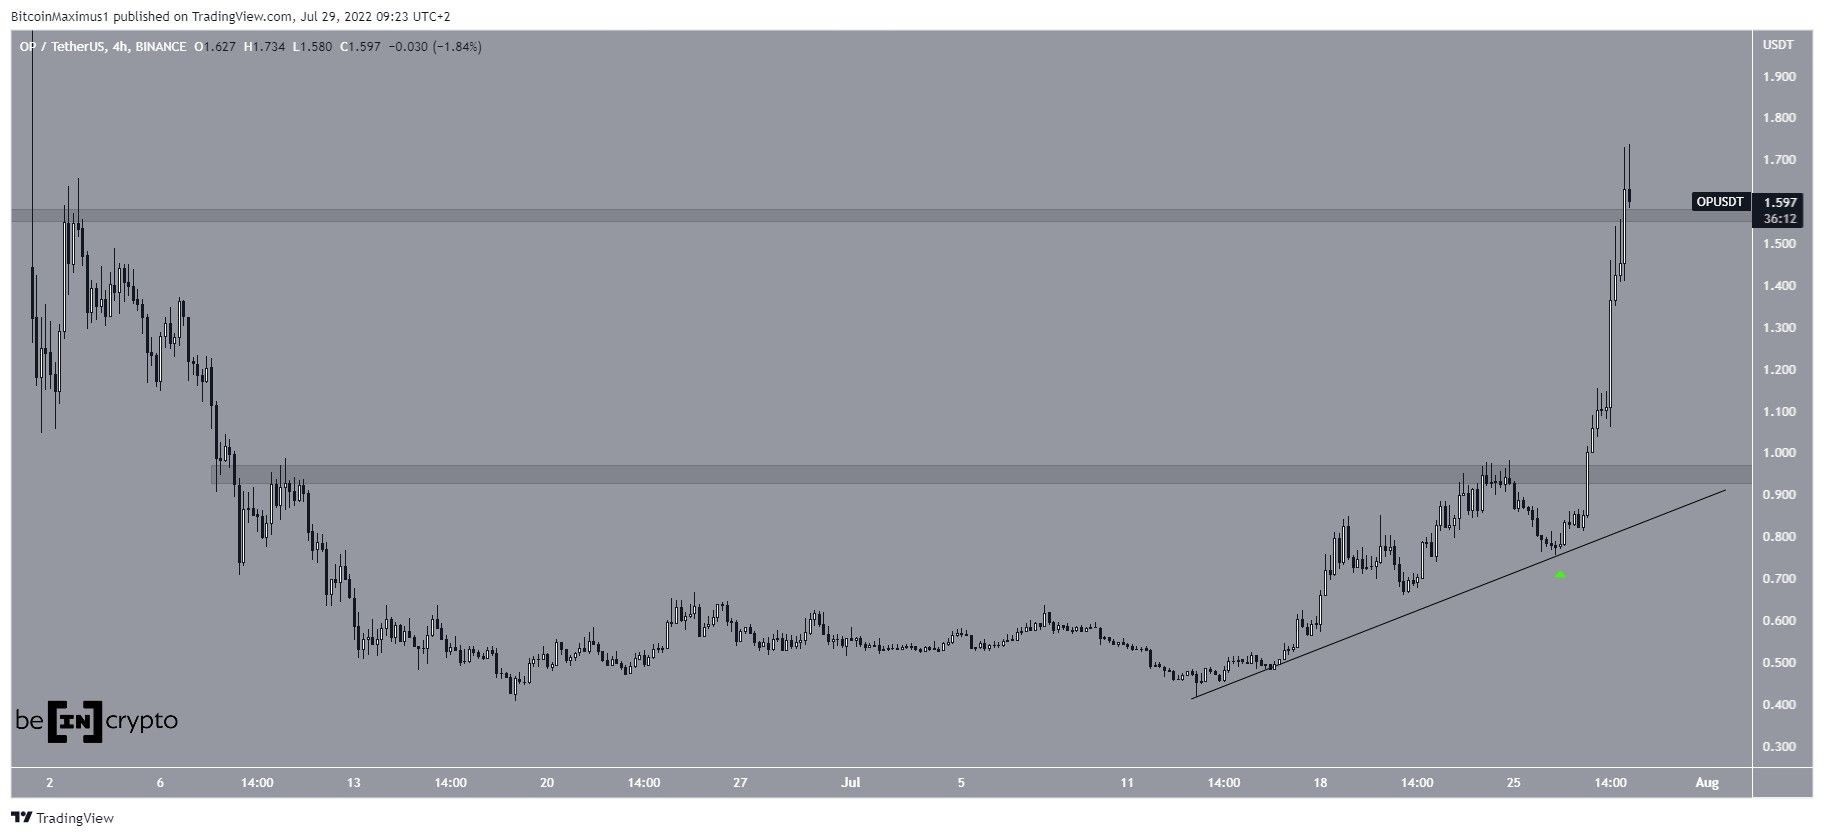
OP
OP has been moving upwards alongside an ascending support line since July 13.
After bouncing at the support line on July 26, the price greatly accelerated its rate of increase and broke out from the $0.95 horizontal resistance area. Afterward, it reached a high of $1.73 on July 29.
If OP manages to hold on above the $1.56 horizontal area, the price would be expected to reach a new all-time high.
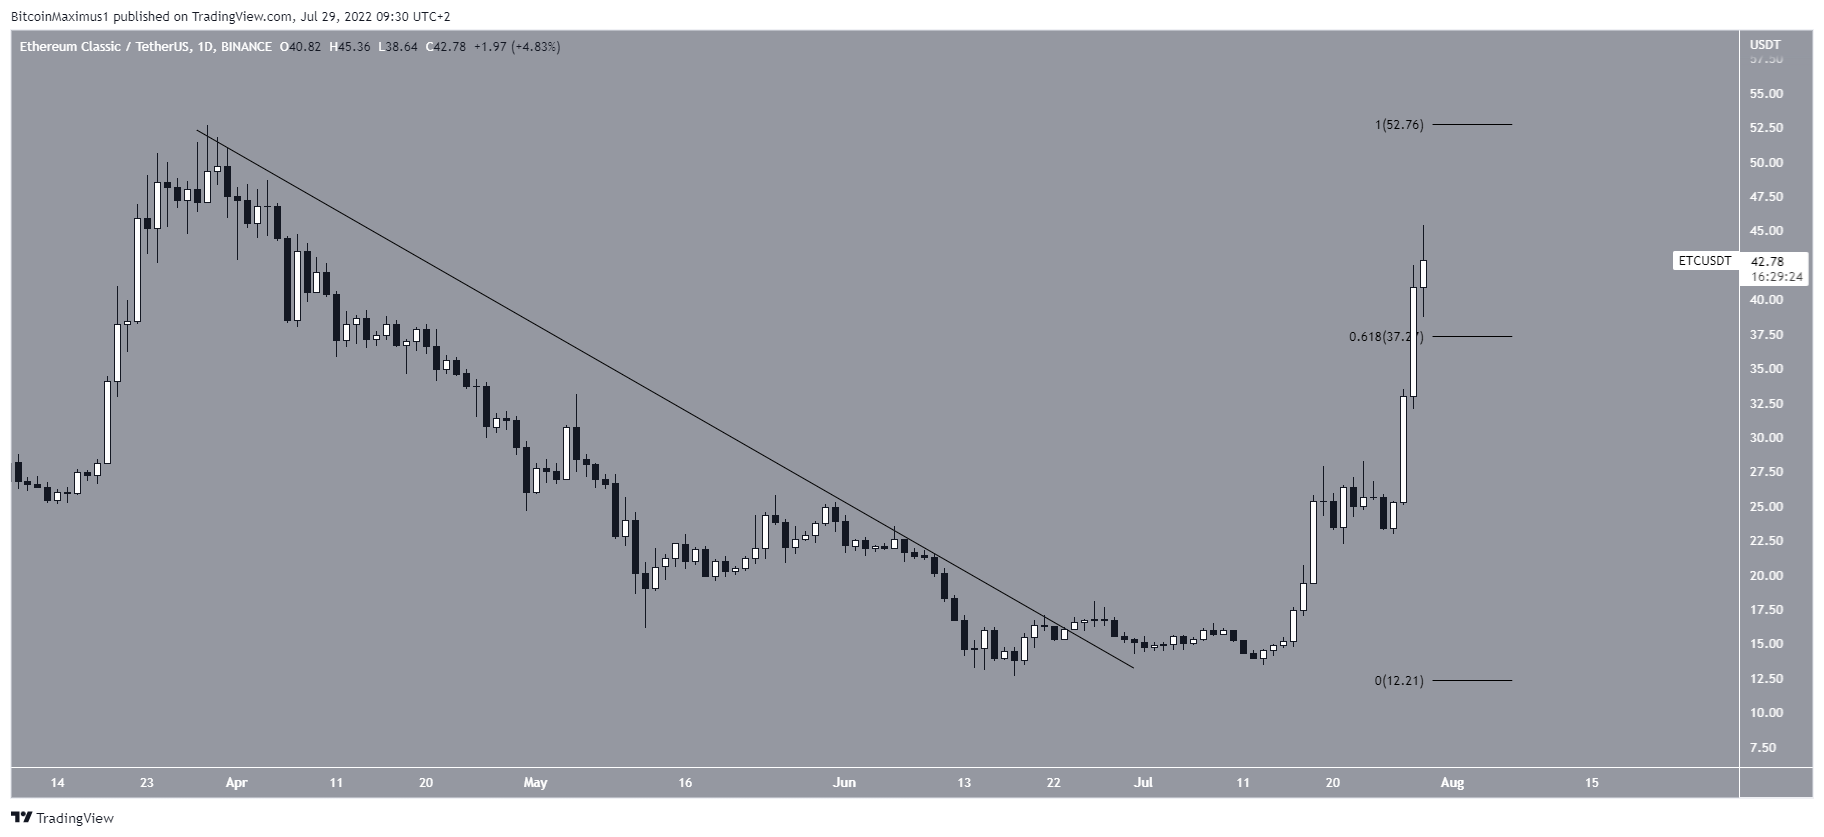
ETC
On June 24, ETC broke out from a descending resistance line that had been in place since the end of March. The upward movement accelerated on July 15 and 27, and ETC has so far reached a high of $45.50.
Sponsored SponsoredThis also caused a breakout above the 0.618 Fib retracement resistance level at $37.20.
The next resistance area is at $52, created by the March highs.
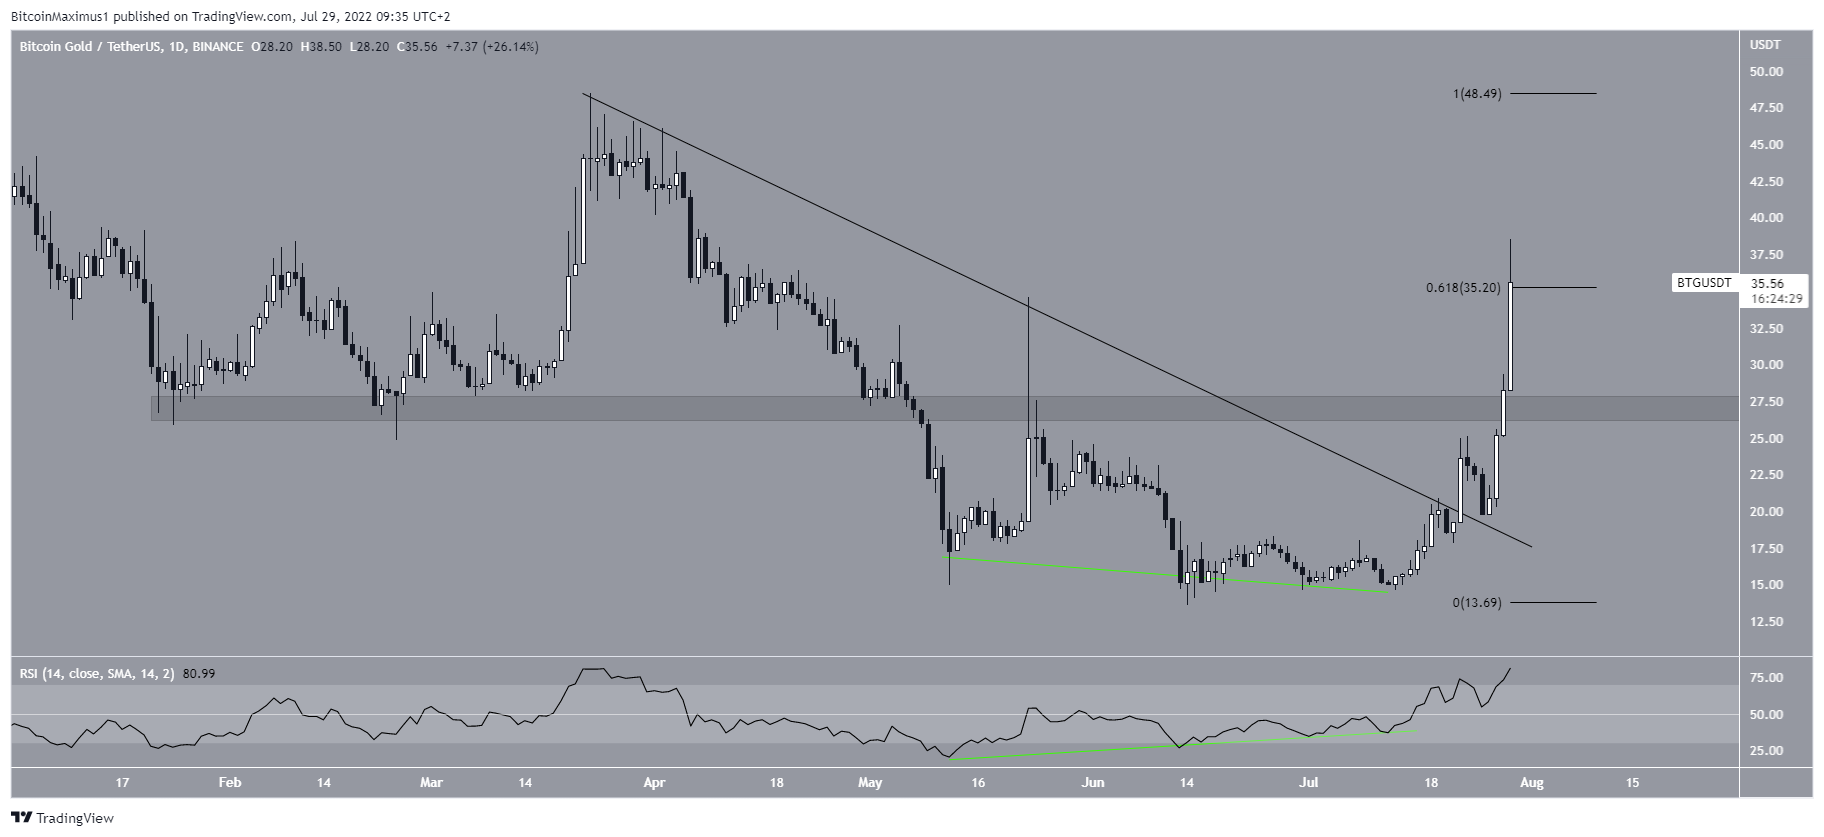
BTG
In the period between May 12 and July 16, BTG generated a very significant amount of bullish divergence.
SponsoredAfterward, it managed to break out from a descending resistance line on July 18. Subsequently, it moved above the $27 horizontal area, which had been previously acting as resistance.
Currently, BTG is trading just below the 0.618 Fib retracement resistance level at. The next resistance area is at $47.50.
QTUM
QTUM has been moving upwards since July 13. The upward movement has been sharp and QTUM broke out from the $4.40 horizontal resistance area on July 28. The area is now expected to provide support.
If the upward movement continues, the next closest resistance area would be at $5.55.
Sponsored Sponsored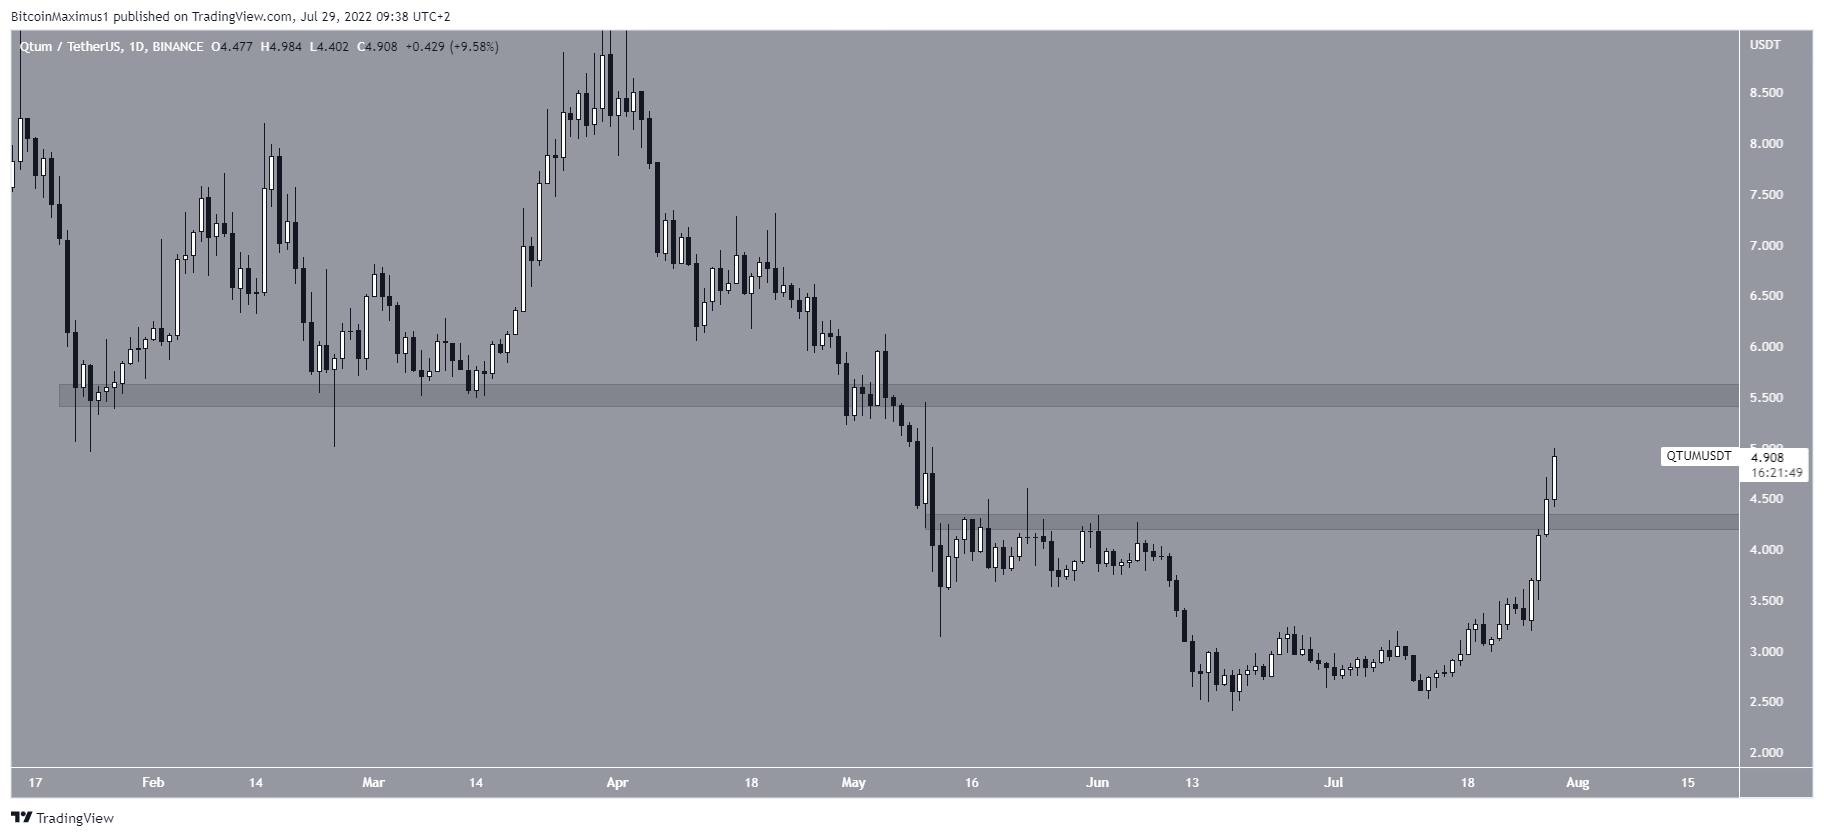
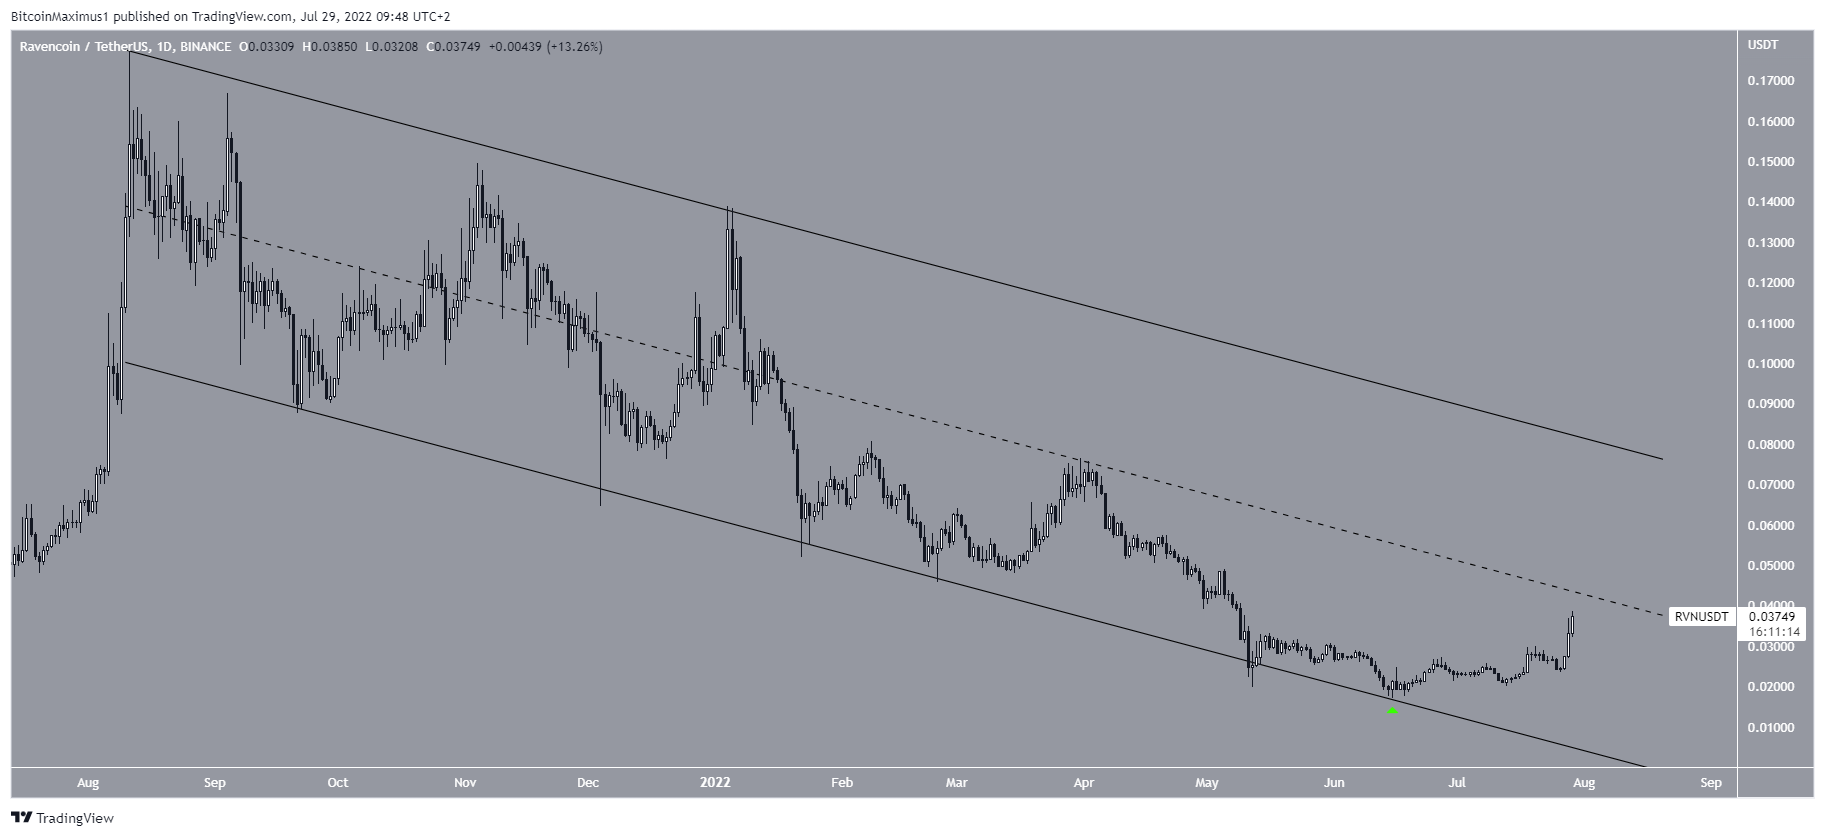
RVN
RVN has been decreasing inside a long-term descending parallel channel since Aug. In June, the price bounced at the support line of this channel and has been increasing since.
Currently, RVN is approaching the middle of the channel at $0.04. A breakout above this line could accelerate the rate of increase.
For Be[in]Crypto’s latest Bitcoin (BTC) analysis, click here
