


The OMG Network has returned to a long-term support level and possibly begaun an upward move, which would be confirmed by a breakout above $4.20.
Return to Long-Term Support
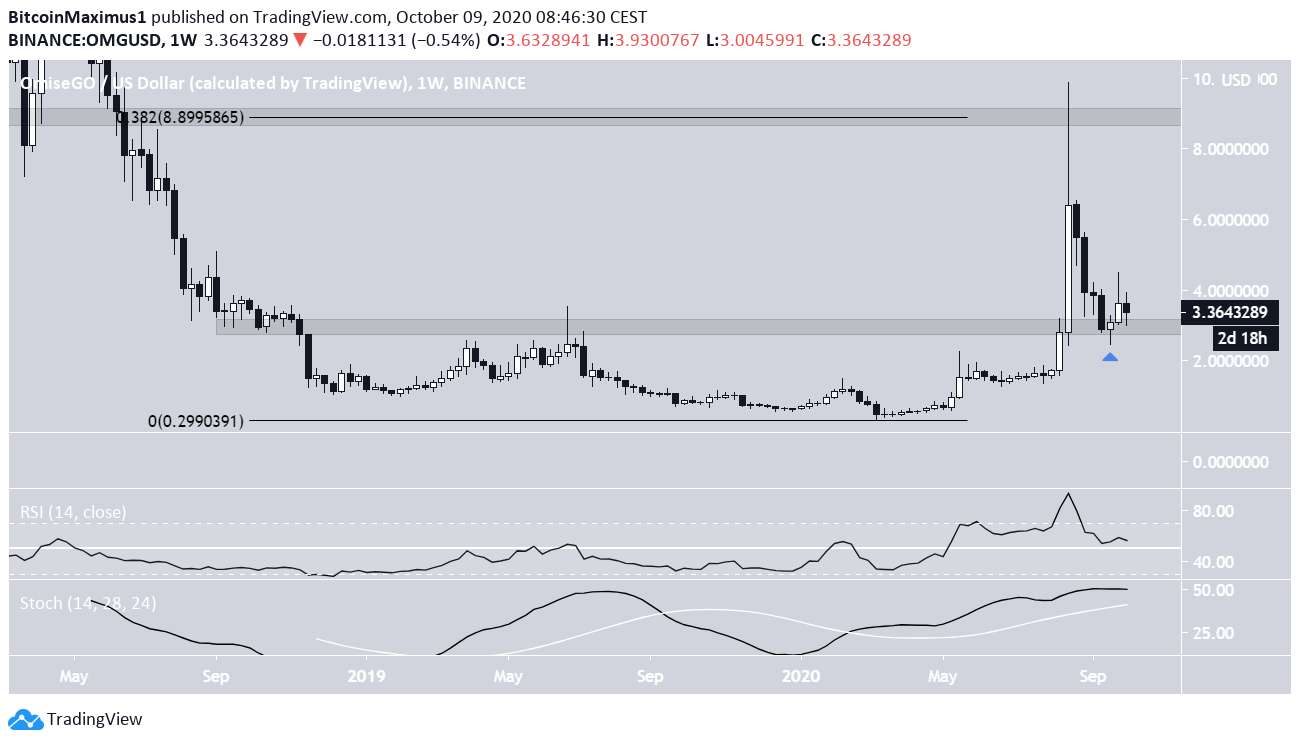
In March 2020, the OMG price began a very significant upward move that lead to a high of $9.80, reached on Aug 21. However, the price has been falling since, reaching a low of $2.48 on Sept 21.
This movement validated the $3 and $9 areas as long-term support and resistance, respectively.
Technical indicators are still bullish, since the Stochastic Oscillator is rising, and even though the RSI is going down, it’s still above 50. Therefore, the current move looks more like a re-test of the previous resistance area as support rather than the beginning of a new downward trend.
Trading Range
Cryptocurrency trader @Coldbloodshill outlined an OMG chart, stating that the price action looks bullish. They outlined paths towards $4.30 and $5.
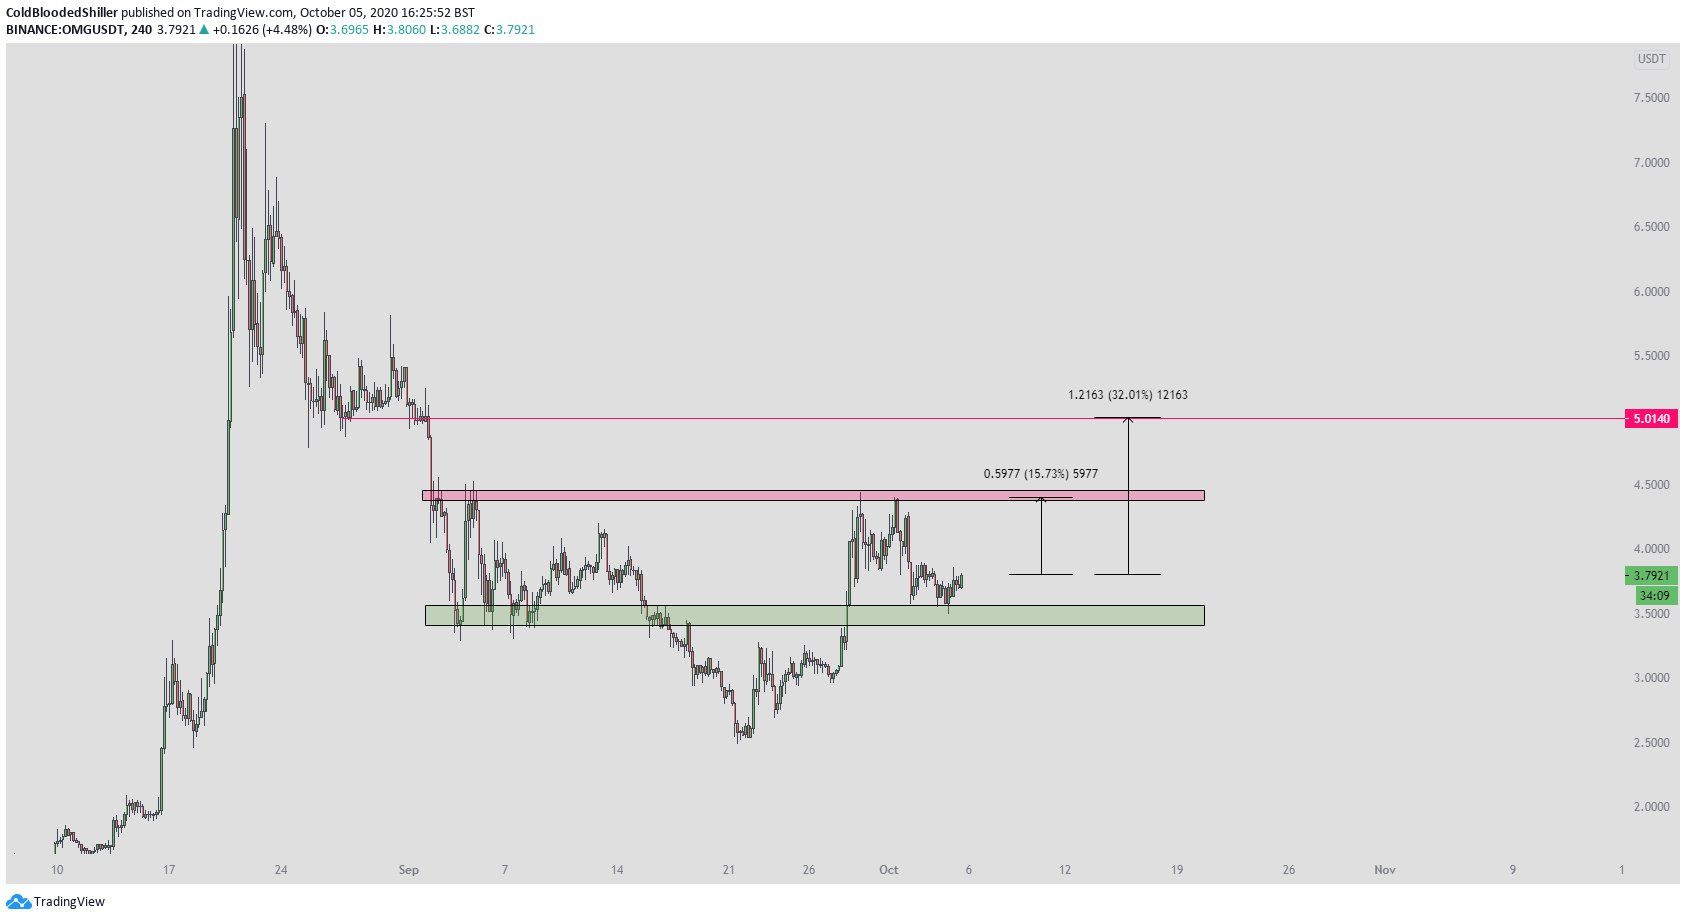
While the price did reach the $4.20 area, briefly touching a high of $4.50 on Sept 22, the higher prices could not be sustained and OMG created a long upper wick before falling.
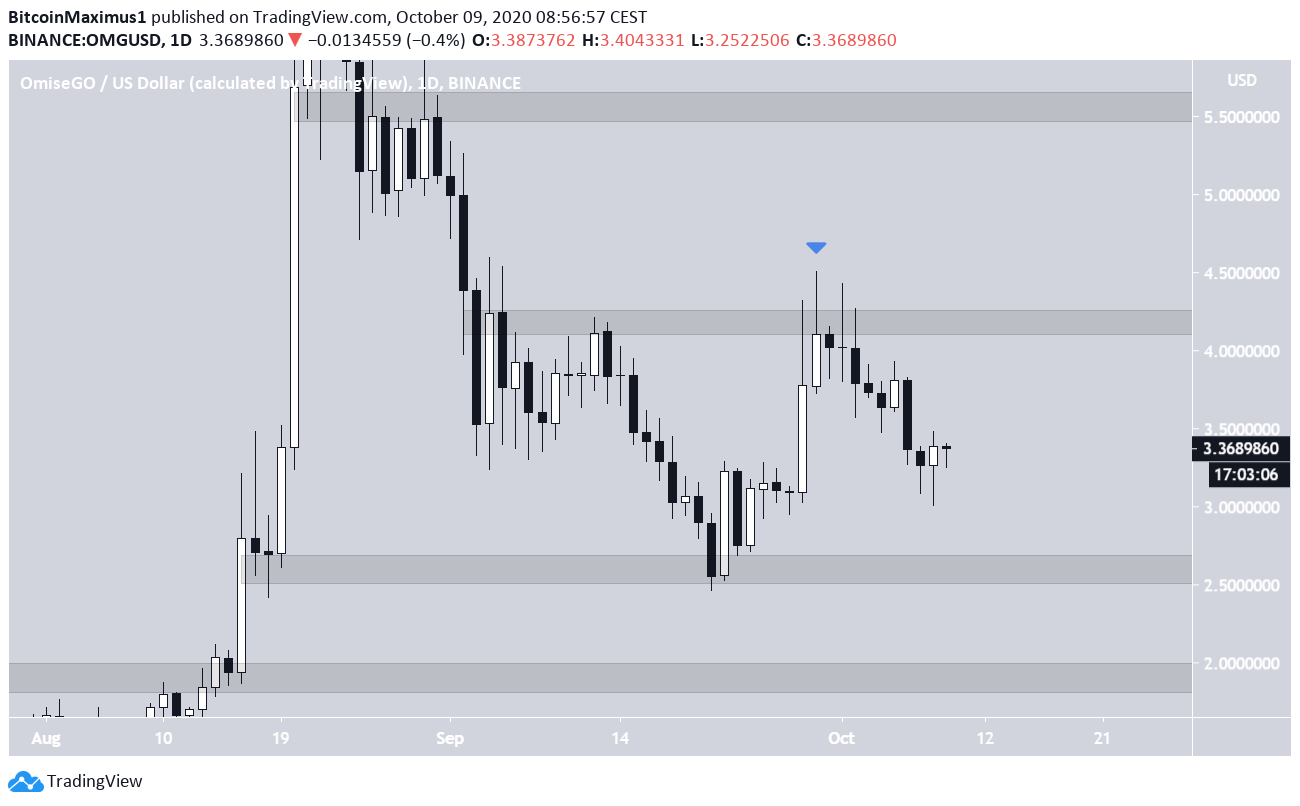
At the time of writing, the price was trading in the middle of the $2.60 – $4.20 range. A breakdown from the range could take the price towards $1.95, while a breakout could take it towards $5.55.
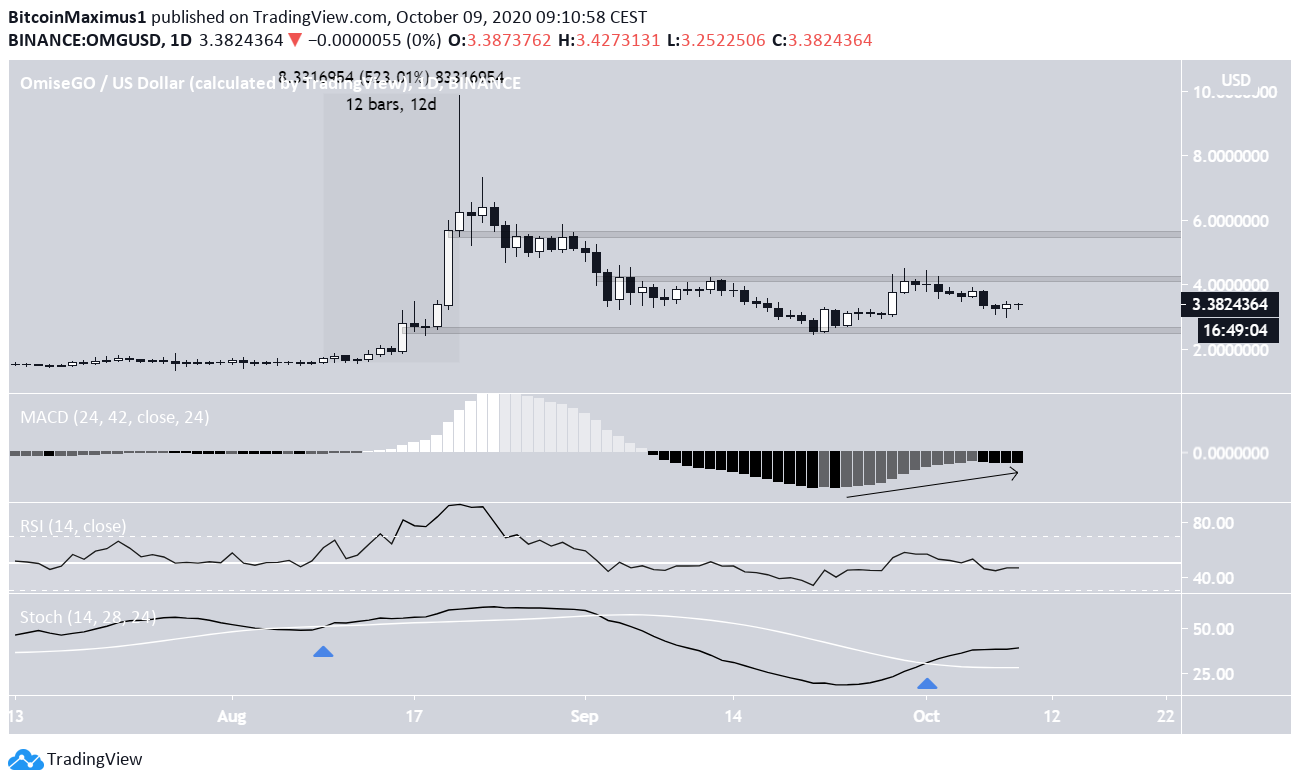
Technical indicators support the findings from the weekly time-frame. The Stochastic Oscillator has just made a bullish cross, and it’s worth mentioning that the previous cross led to an increase of 520% in just 12 days.
While it seems unrealistic to expect a similar increase this time around, it’s till a strong sign that the trend is bullish. The MACD is increasing even though it has not turned positive, but the RSI is below 50, providing conflicting signs.
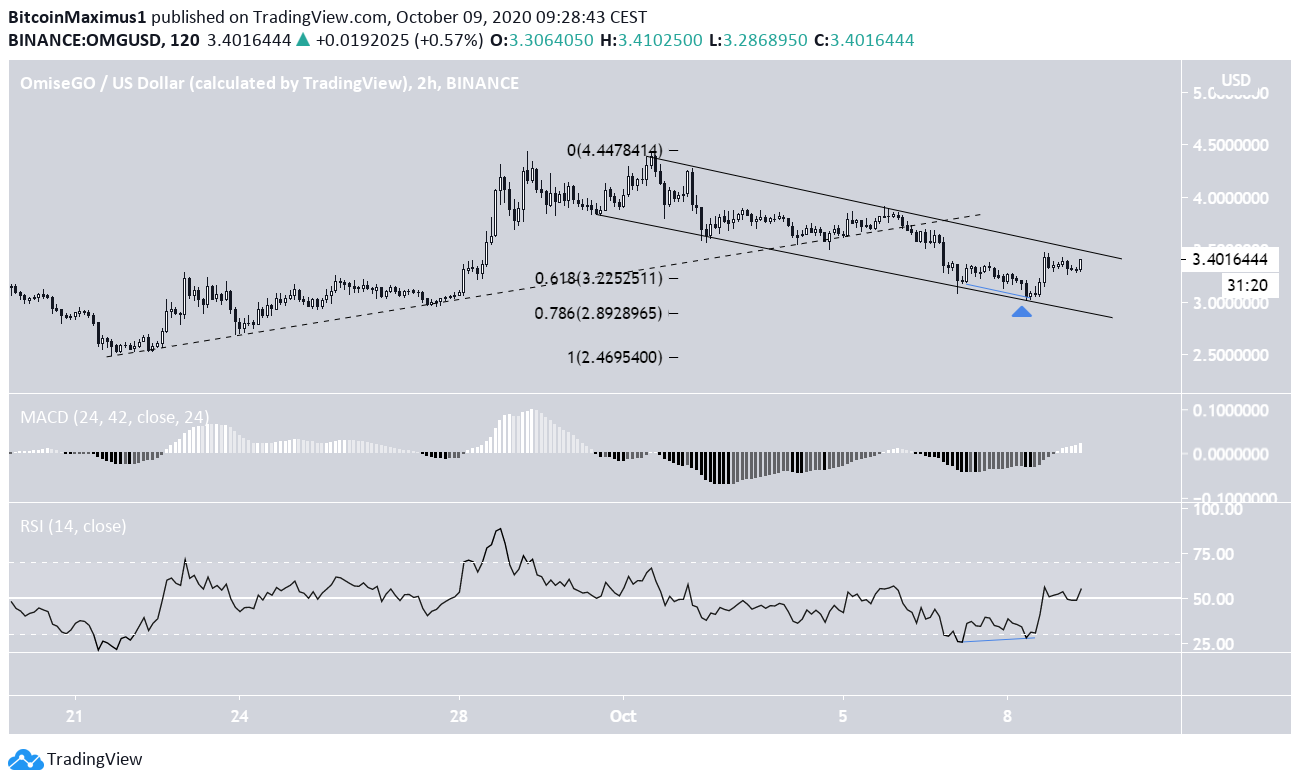
Finally, the short-term chart gives us a clearer direction of the price action. First, OMG broke down from an ascending support line (dashed line in the image). Since then, the price has been trading inside a descending channel (solid).
Yesterday, the price bounced at the support line of the channel and began to rise. The low was between the 0.618 – 0.786 levels, a common reversal area, and was combined with significant bullish divergence on both the RSI and the MACD.
Therefore, a breakout from the channel is likely, which would likely lead to a re-test of the $4.20 resistance area.
Wave Count
If an upward move began with the previous low on Sept 21, then OMG completed a bullish impulse (shown in black below) with a high of $4.43 reached on Sept 29.
Afterward, it began a complex, W-X-Y correction, which is very close to completing or has already ended. This would also fit with the divergences from the short-term descending channel and lead to a breakout.

To conclude, the OMG price should make another attempt to break out above the $4.20 resistance area, and possibly move higher.
For BeInCrypto’s Bitcoin analysis, click here!
Disclaimer: Cryptocurrency trading carries a high level of risk and may not be suitable for all investors. The views expressed in this article do not reflect those of BeInCrypto.


