


The Near Protocol (NEAR) price has increased by 65% in the past four days. The upward movement led to a 440-day high of $3.44 today.
NEAR has increased by 80% so far in December. Will it maintain its momentum until the end of the month?
NEAR Ascent Reaches New Heights
The weekly time frame technical analysis shows that the NEAR price broke out from a descending resistance trend line in November. Before the breakout, the trend line had been in place for 540 days.
While the increase was initially slow, NEAR accelerated this week, creating a large bullish candlestick. Since then, the altcoin has increased by 55% and moved above a long-term horizontal resistance area.
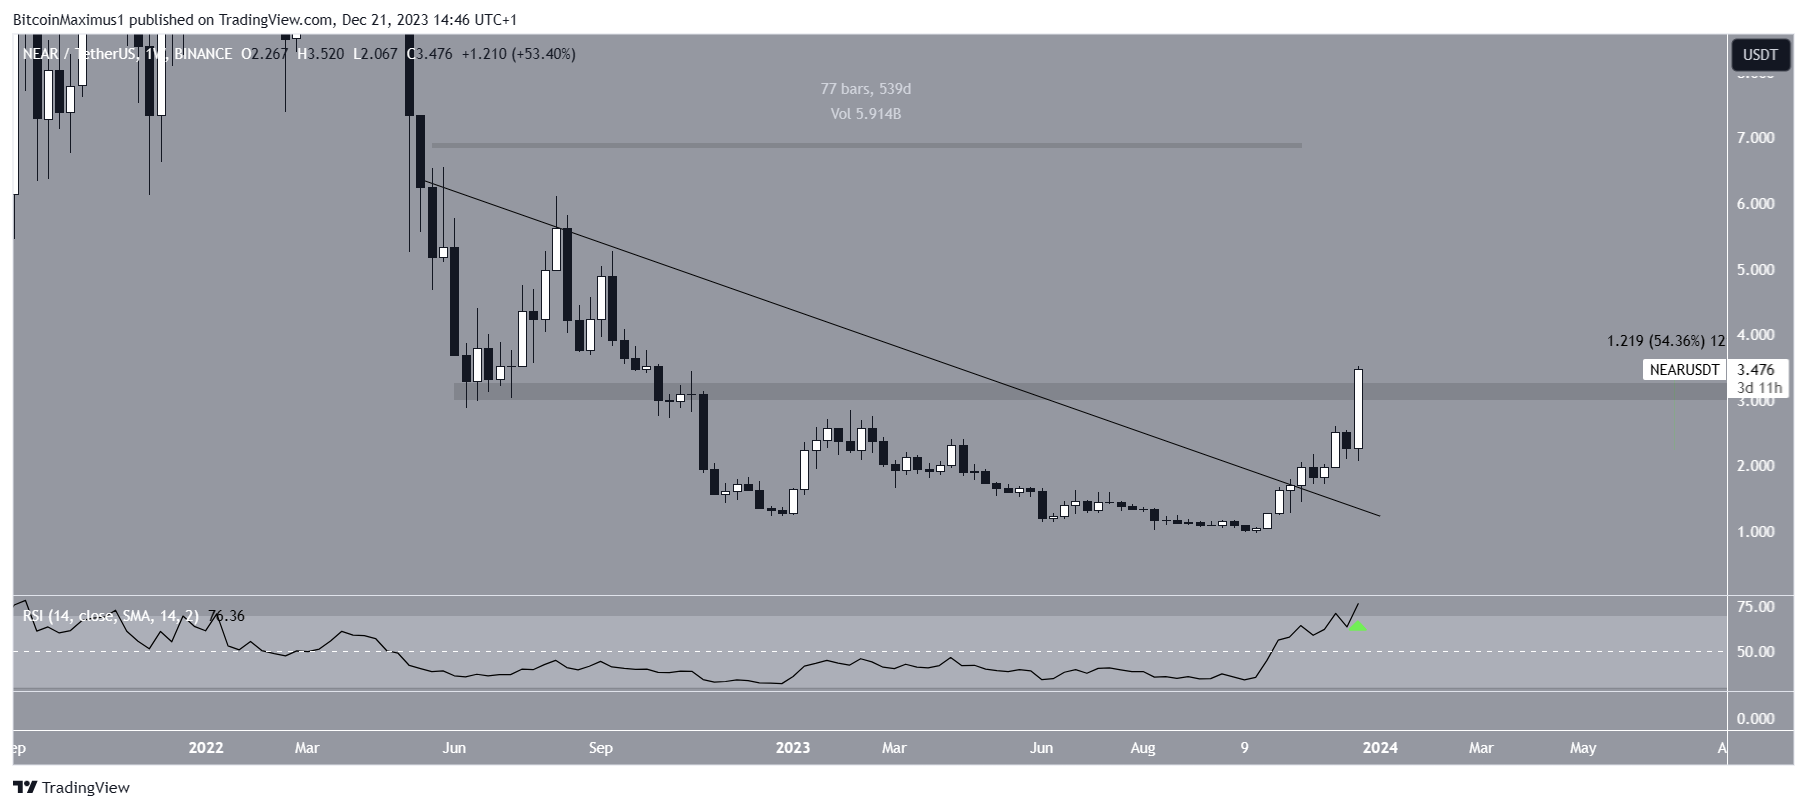
With the RSI as a momentum indicator, traders can determine whether a market is overbought or oversold and decide whether to accumulate or sell an asset.
Bulls have an advantage if the RSI reading is above 50 and the trend is upward, but if the reading is below 50, the opposite is true.
The weekly RSI is increasing and is above 50, both signs of a bullish trend. It also crossed above 70 (green icon), indicating momentum is further picking up.
Read More: What Is NEAR Protocol?
NEAR Price Prediction: Is the Increase Sustainable?
Even though the increase has been parabolic, the technical analysis of the daily time frame suggests the trend is still bullish. This is because of the price action and RSI readings.
The price action shows that NEAR broke out from an ascending parallel channel, which had contained the increase since October. This caused the acceleration of the upward movement yesterday. The bounce and breakout was predicted by CWTrades, who tweeted:
“Looking for a long trade at this trend line, will keep you guys updated when price is at this trend line.”
Read More: Top 7 NEAR Wallets in 2023
NEAR increased above the $2.70 and $3.40 resistance areas during the upward movement.
AltCryptoGems noted that the NEAR price has reached both his targets, which coincided with the with the abovementioned resistance.
Additionally, the RSI broke out from its bearish divergence trend line (green), a sign that the correction is over. The indicator is now increasing.
If NEAR closes above the $3.40 resistance, it can increase by another 50% to the next resistance at $5.
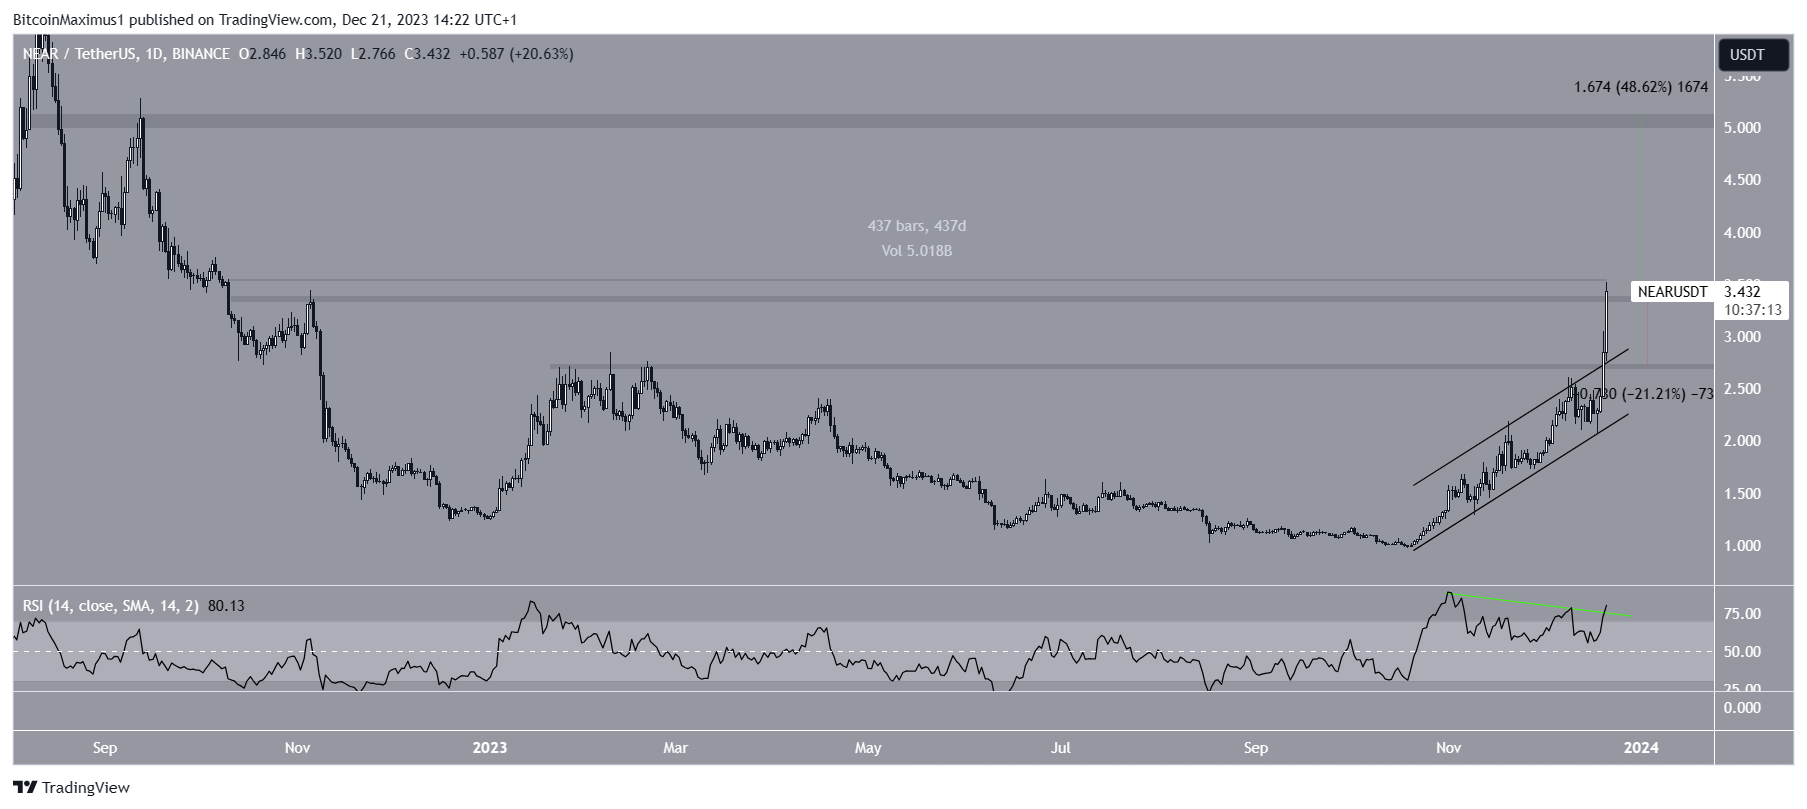
Despite this bullish NEAR price prediction, a close below $3.40 can trigger a 20% drop to the closest support area at $2.70.
For BeInCrypto’s latest crypto market analysis, click here.


