

The Monero (XMR) price has been moving downwards since it was rejected by a long-term resistance area on Oct 26.
While a short-term increase could occur, it is likely that the longer-term trend is bearish.
XMR Approaches Support
The XMR price has been decreasing since a two-and-a-half-year high of $140.65 was reached on Oct 26. The decrease has been gradual and the price has nearly reached the $106.50 support area, which is the 0.5 Fib level of the entire upward move. If the price were to break down, the next closest horizontal and Fib support level would be found at $88. On Nov 8, the XMR price created a bullish engulfing candlestick, a sign of a trend reversal. Despite this, technical indicators are bearish as the MACD, RSI, and Stochastic oscillator are decreasing. The MACD is currently below 0 and the RSI is below 50.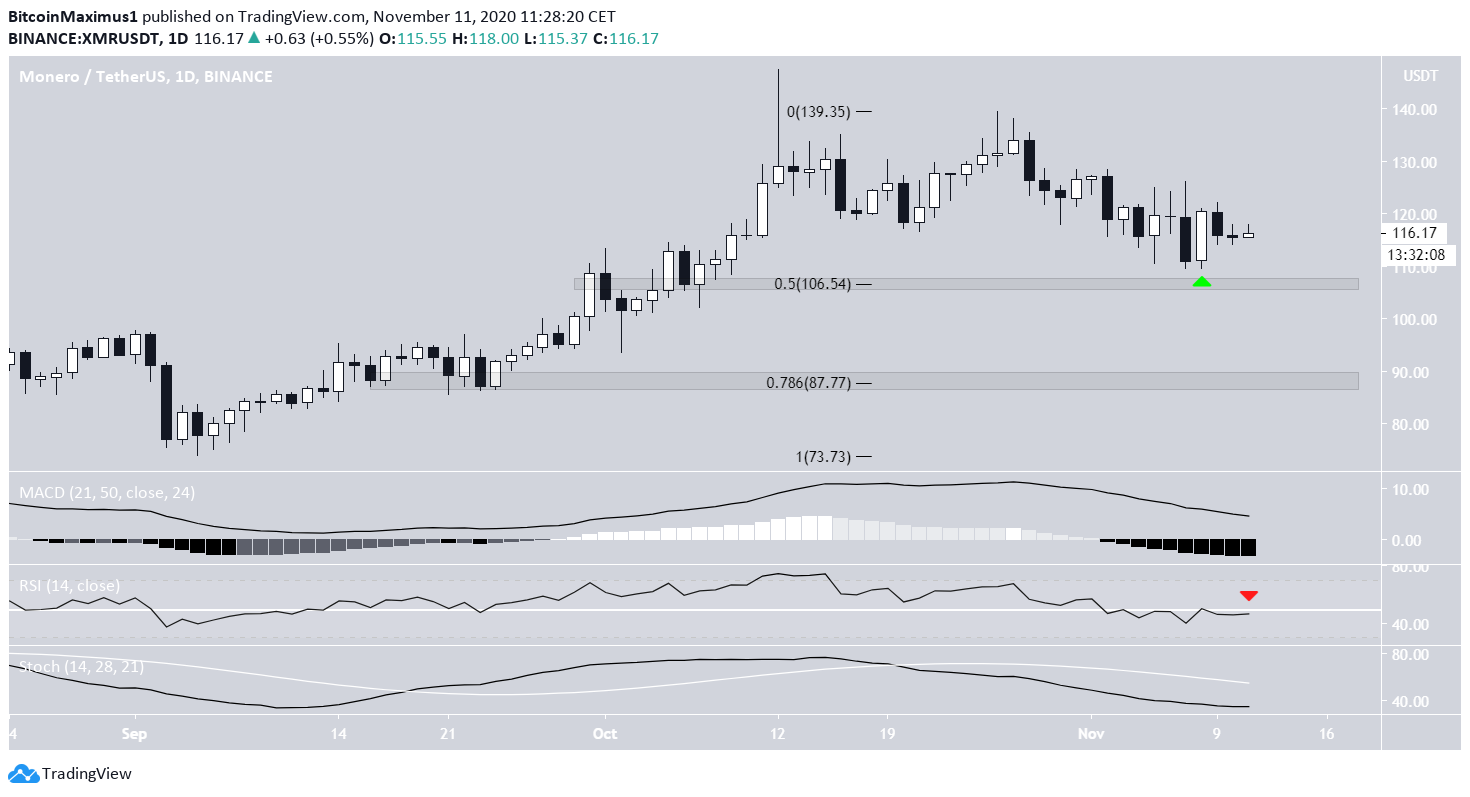
Possible Breakout
The shorter-term six-hour chart shows that the price has been following a descending resistance line since the aforementioned Oct 26 high. Technical indicators suggest that a breakout could soon transpire. Both the RSI & MACD have generated bullish divergence and began to move upwards. However, even if the price breaks out, there is likely to be very significant resistance between $124.50 and $128, the 0.5-0.618 Fib levels of the entire decrease. Therefore, unless the price breaks out above this area, the trend is likely to be bearish, also supported by the readings from the daily time-frame.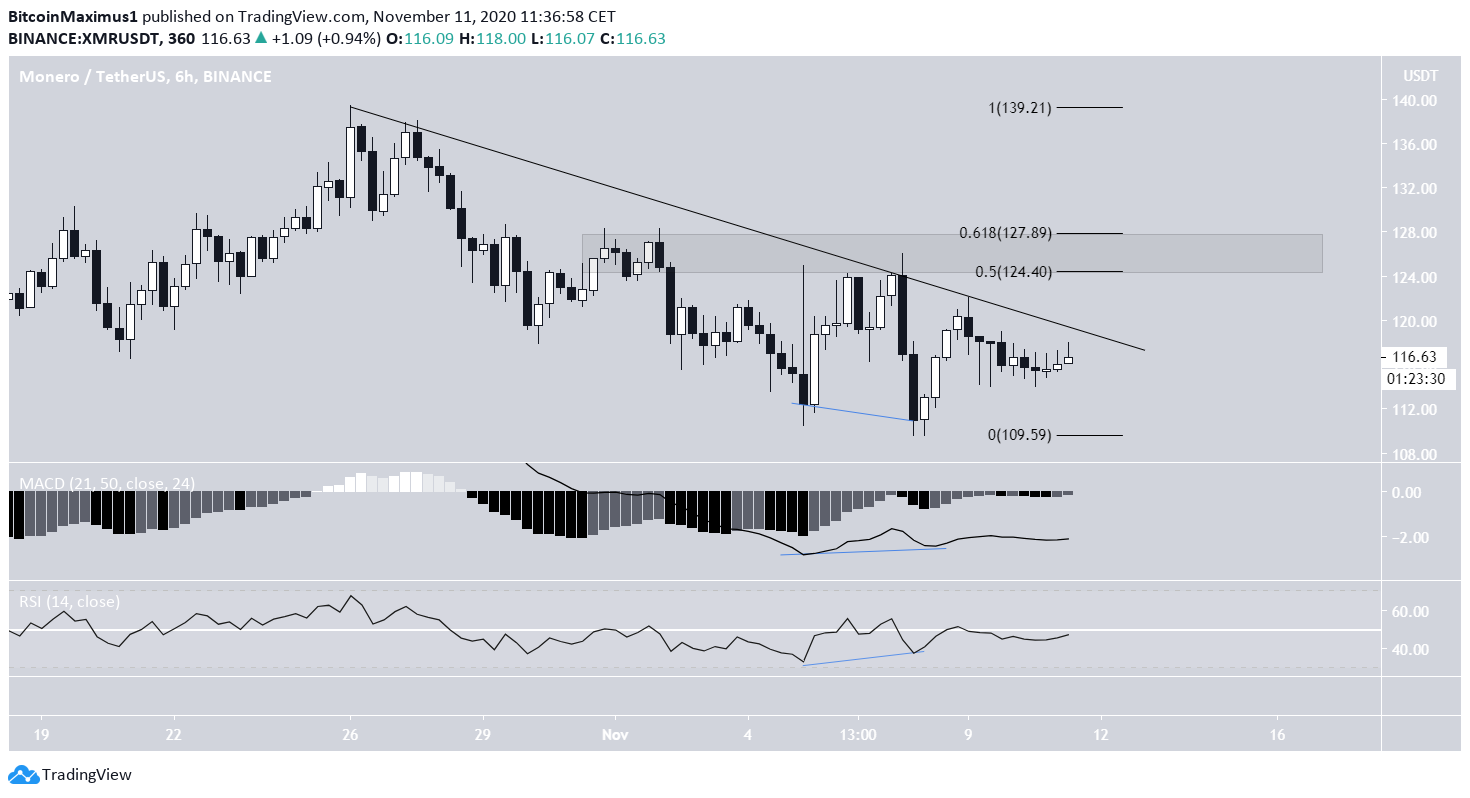
Future Movement
Cryptocurrency trader @dentoshi93 tweeted a weekly XMR chart that predicts a drop towards $90 followed up by a rally back towards the recent highs.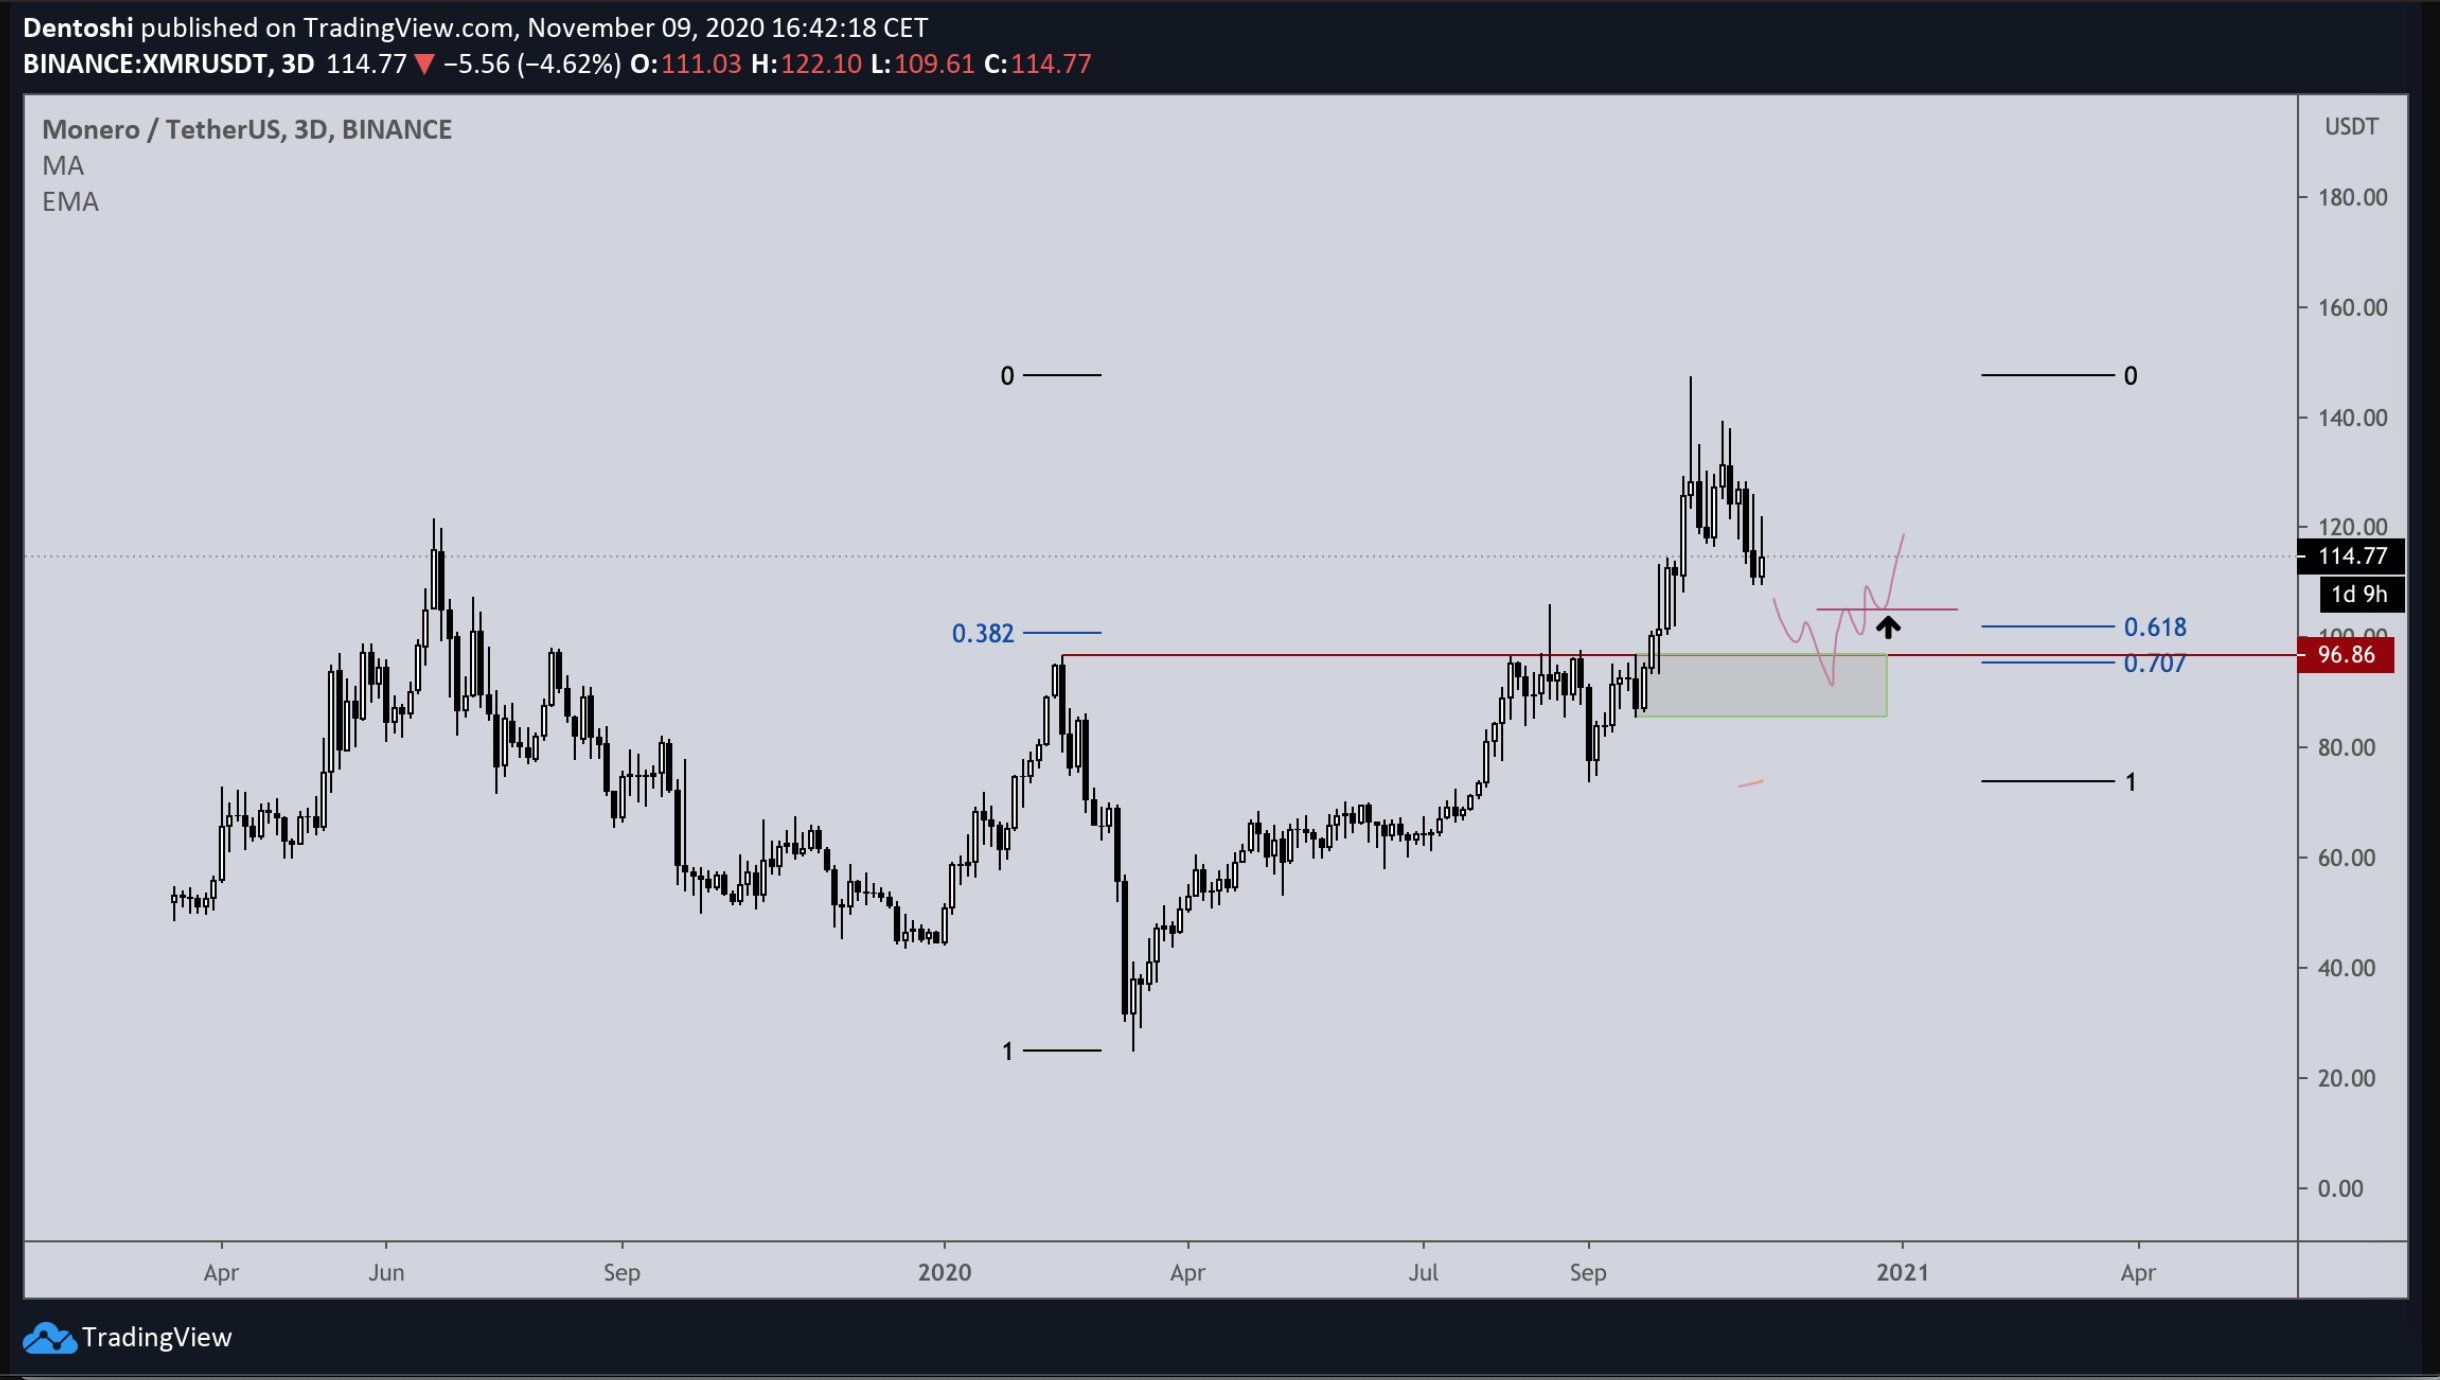
 XMR Chart By TradingView
Wave Count
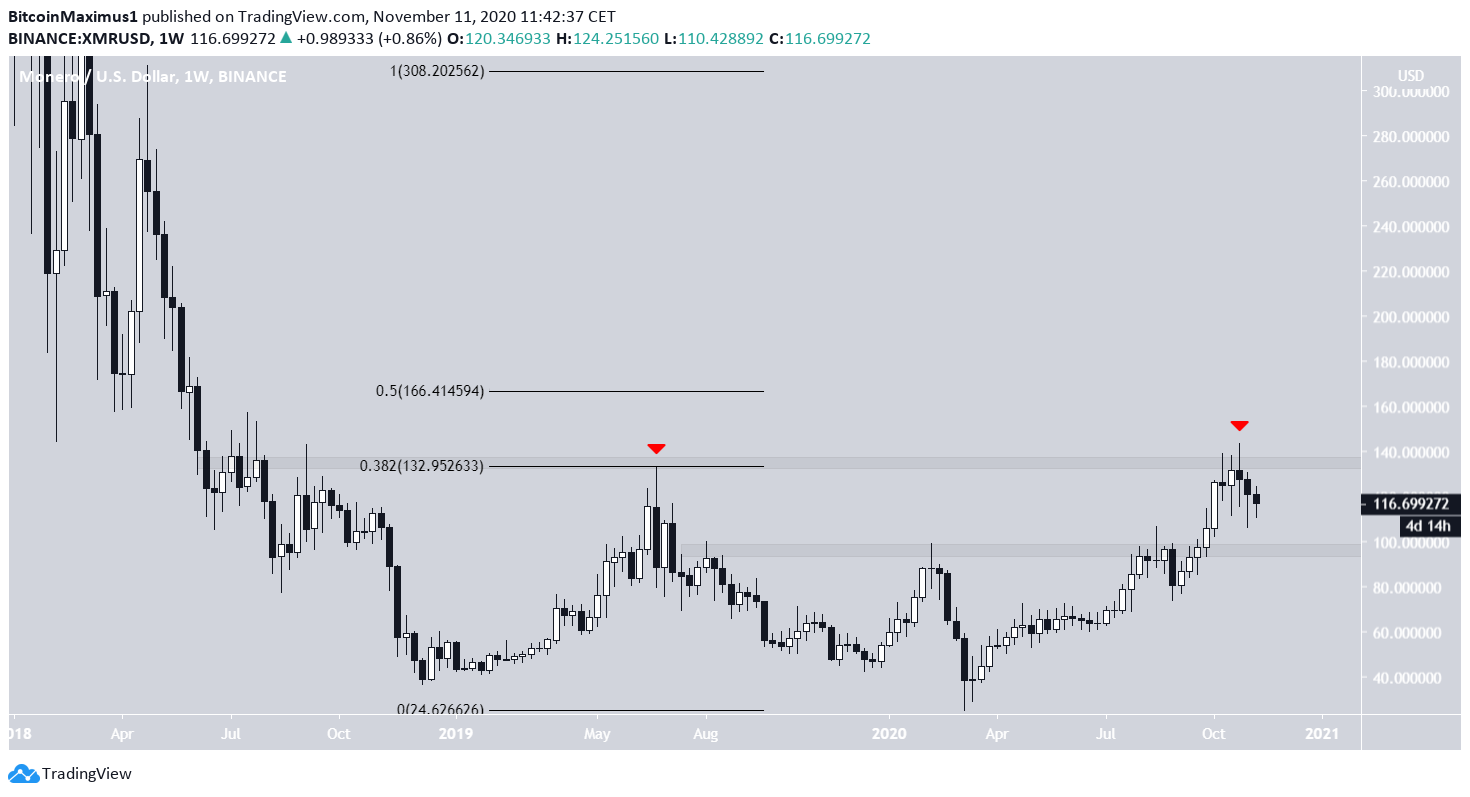
The wave count since the March low suggests that XMR has already completed a bullish impulse (shown in black below) and has now begun a correction. The Oct 26 high also coincides with the target given by the 2.61 Fib extension of wave 1. Combining this with the bearish divergence in the daily RSI during the high, it makes it likely that XMR has already reached a top, and will now correct towards the support level previously outlined.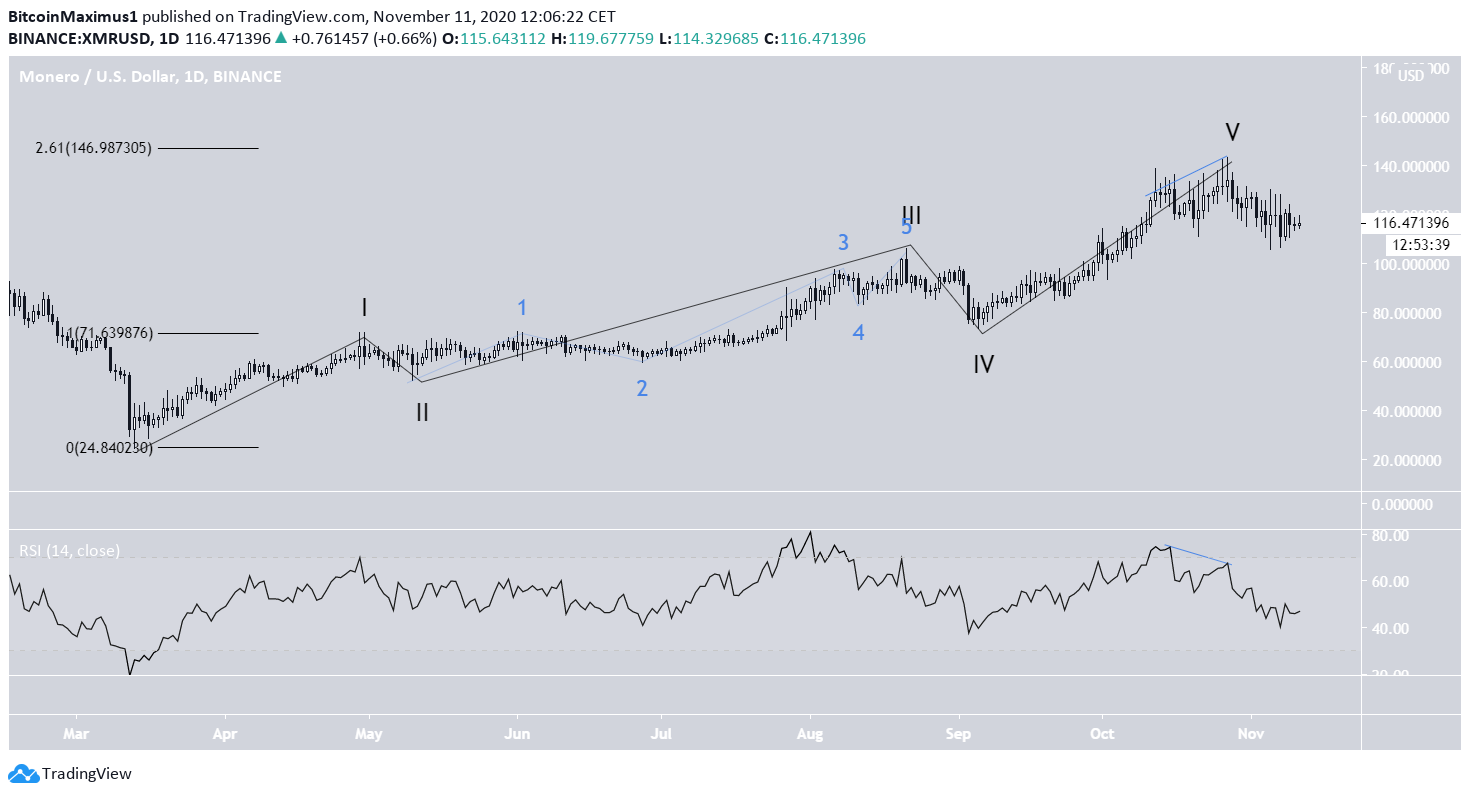

Conclusion
It’s possible that XMR has completed a nearly six-month-long bullish upward move and has now begun a corrective formation that could eventually lead the price towards $90. For BeInCrypto’s latest Bitcoin analysis, click here! Disclaimer: Cryptocurrency trading carries a high level of risk and may not be suitable for all investors. The views expressed in this article do not reflect those of BeInCrypto.
Top crypto projects in the US | July 2024
Trusted
Disclaimer
In line with the Trust Project guidelines, this price analysis article is for informational purposes only and should not be considered financial or investment advice. BeInCrypto is committed to accurate, unbiased reporting, but market conditions are subject to change without notice. Always conduct your own research and consult with a professional before making any financial decisions. Please note that our Terms and Conditions, Privacy Policy, and Disclaimers have been updated.

Valdrin Tahiri
Valdrin discovered cryptocurrencies while he was getting his MSc in Financial Markets from the Barcelona School of Economics. Shortly after graduating, he began writing for several different cryptocurrency related websites as a freelancer before eventually taking on the role of BeInCrypto's Senior Analyst.
(I do not have a discord and will not contact you first there. Beware of scammers)
READ FULL BIO
Sponsored
Sponsored