
The Monero (XMR) price decreased sharply during the marketwide crash on Sept 2-4.
However, its bullish formation is still intact, and technical indicators suggest that a reversal is brewing.
XMR Long-Term Breakout
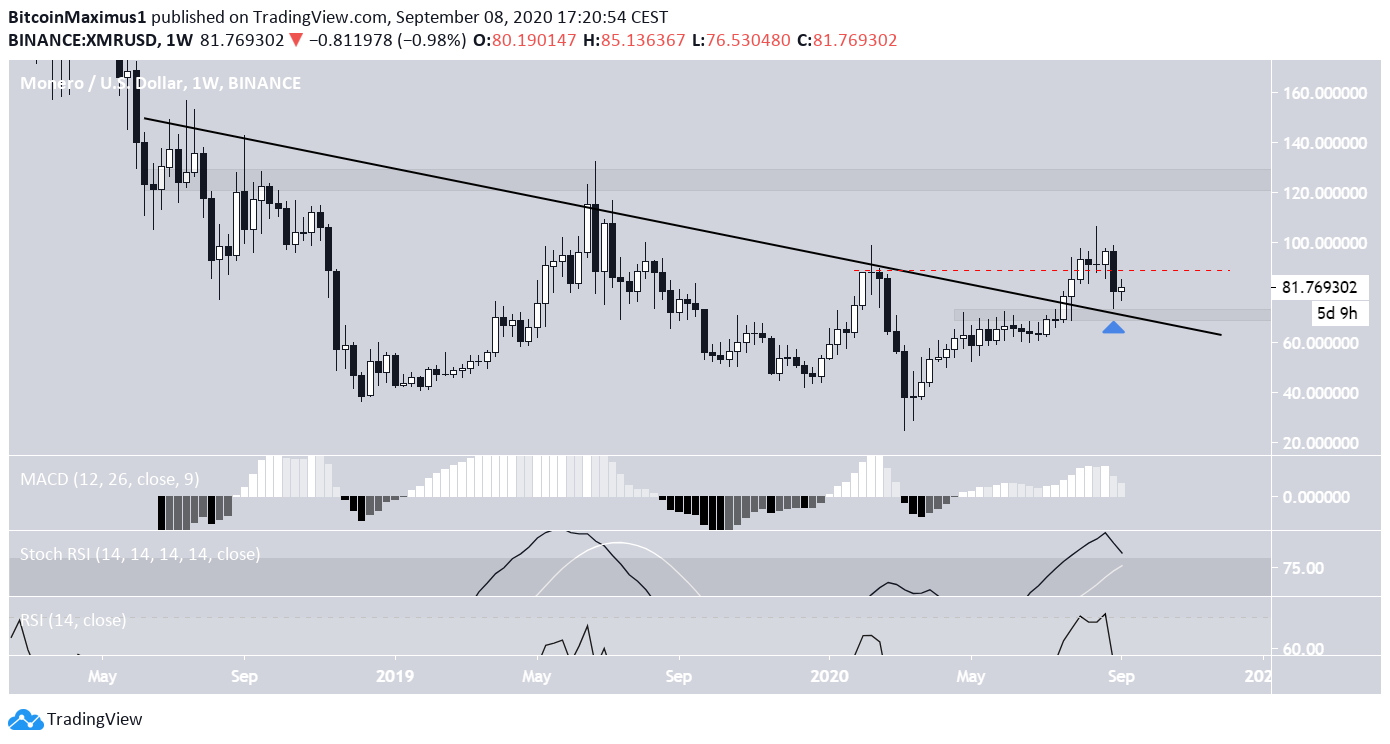
In July, the XMR price broke out from a descending resistance line that had been in place since June 2018. The increase continued until Aug 21, when the price reached a high of $106. However, XMR dropped shortly afterward.
Despite the dip, XMR is still trading above the resistance line it previously broke out from and looks to be on the way to validate it as support. In horizontal levels, the closest support and resistance areas are found at $75 and $125, respectively.
Technical indicators have yet to show any weakness, though they have reached overbought levels. A continued decrease, however, could cause a bearish cross in the weekly stochastic RSI and might cause the MACD to drop into negative territory.
A Possible Reversal?
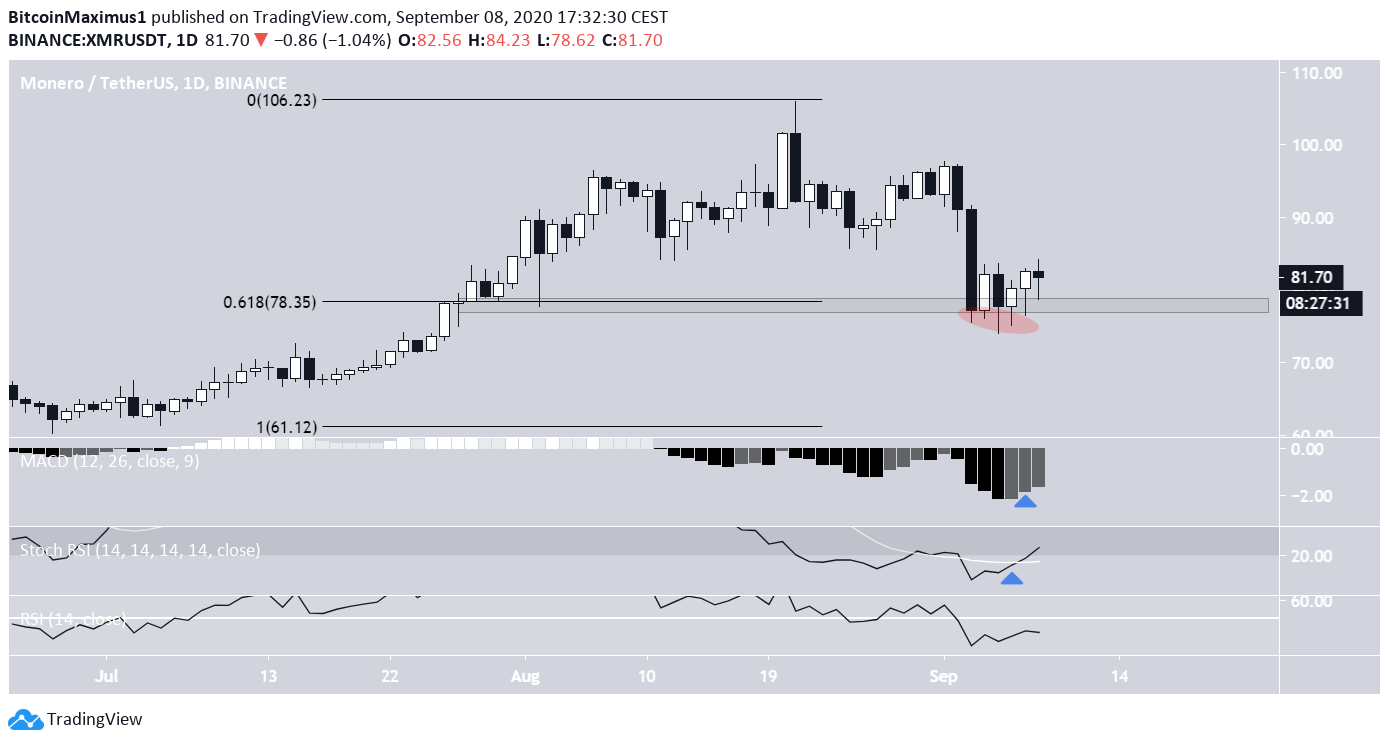
The daily chart has a more positive outlook, indicating that the price could reverse its bearish trend.
While XMR initially decreased below the minor $78 support area, which is also the 0.618 Fib of the previous increase, it quickly reversed and has reclaimed the area since. This makes the previous decrease below this level a deviation which was followed by a retake of the range.
In addition, the MACD has generated three successive higher momentum bars, and the stochastic RSI has made a bullish cross. If the RSI were to reclaim the 50-line, all three indicators would be bullish.
Wave Count
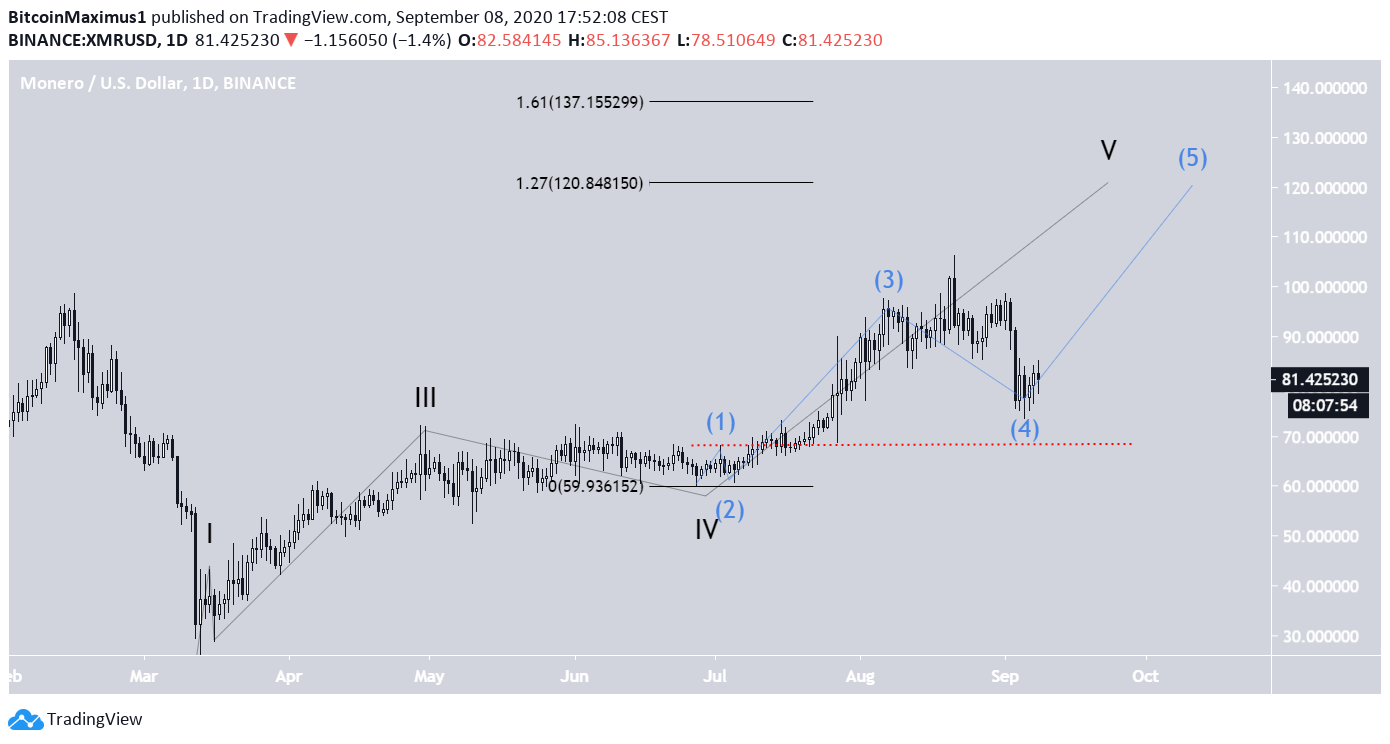
Beginning on March 13, the XMR price likely began a bullish impulsive five-wave formation (in black below). The price is currently in wave 5, but based on the lengths of waves 1-3, the most likely targets for the top of this move are found at $120 and $137.
The fifth wave can be divided into five sub-waves (in blue), in which the price is nearing or has reached the end of the fourth. A decrease below the sub-wave 1 high at $68 (dashed red line) would invalidate this particular wave count.
XMR/BTC
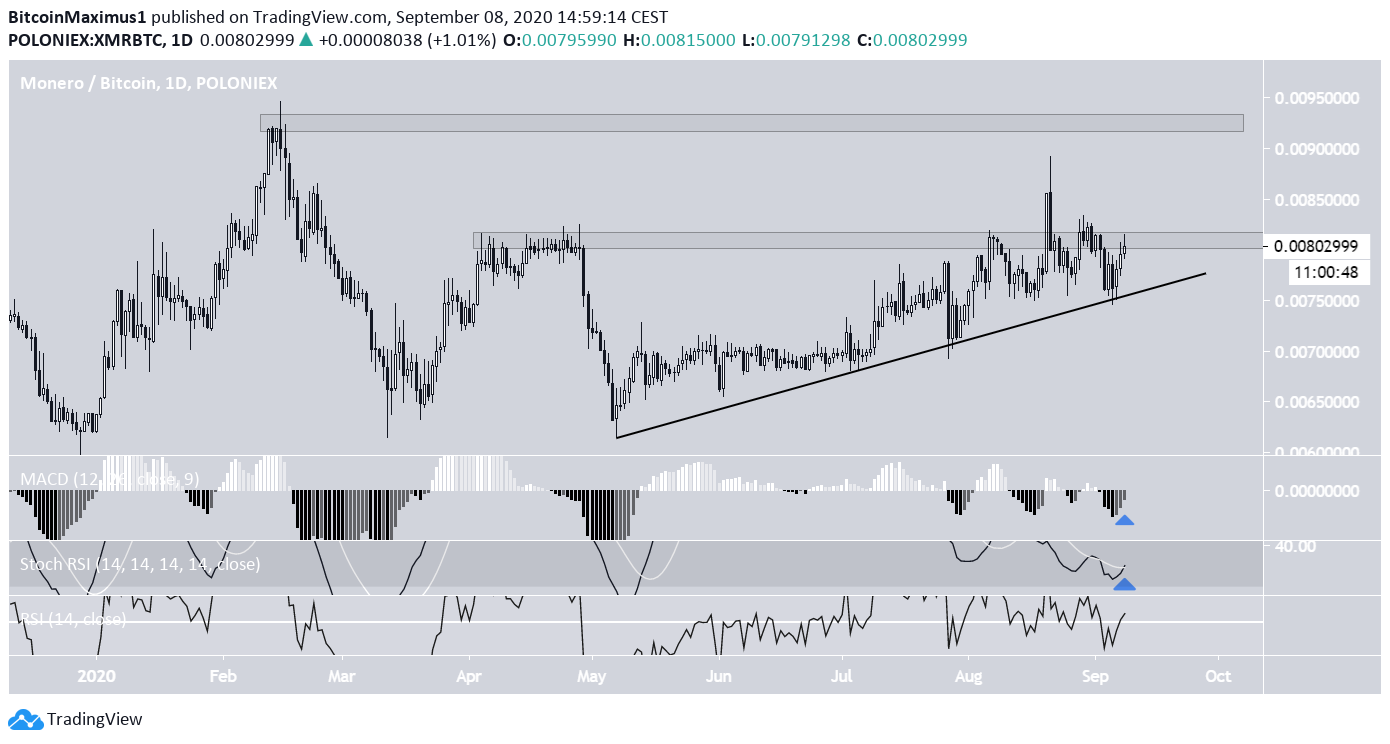
Cryptocurrency trader @cryptocoyote stated that if XMR can flip the important resistance level at ₿0.008, it could continue to move up by another 40%.
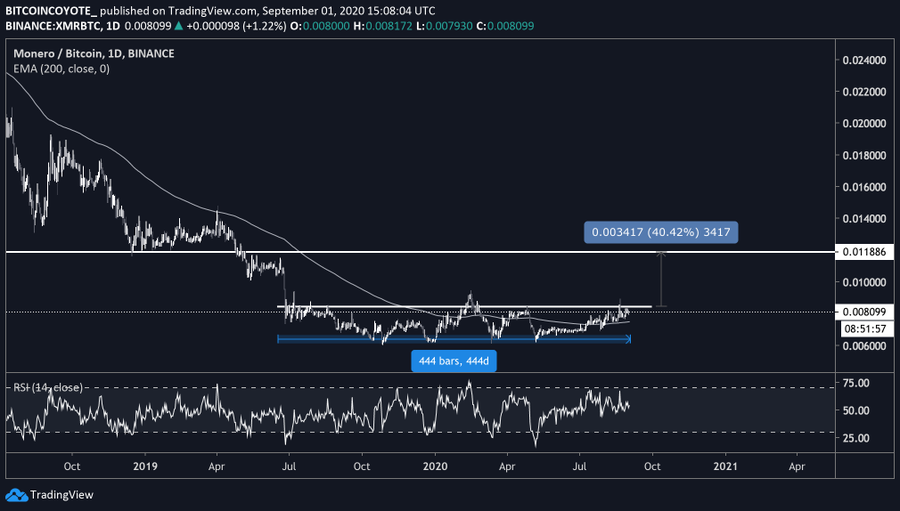
Since the tweet, the price has moved above this level, but fell right back afterward. XMR is still holding above the ascending support line, which creates a type of ascending triangle alongside the ₿0.008 resistance.
Technical indicators are bullish as the MACD and RSI are still increasing. The latter is attempting to climb back above 50 and the stochastic RSI has made a bullish cross.
If the price breaks out, the closest resistance area would be found at ₿0.0092.
For BeInCrypto’s latest Bitcoin (BTC) analysis, click here!
