

On Sept 8, Bitcoin (BTC) created a bullish reversal candlestick inside a long-term support area.
It is not yet clear whether the price has completed its correction or if there is one more wave down before the price reverses its bearish trend.
Bitcoin Forms Hammer at Support
Since the rapid drop in price on Sept 2-3, the Bitcoin has been trading near the $10,100 long-term support area. Inside this area, BTC has created five successive long lower-wicks. On Sept 7 the price created a bullish hammer, which is normally considered a bullish reversal candlestick when coming after a downtrend. Technical indicators have begun to turn bullish:- There is a bullish cross in the stochastic RSI, which is moving upwards out from the oversold region.
- The MACD has begun to increase, creating successive higher momentum bars.

Short-Term Breakout
The hourly chart shows that BTC has broken out from a short-term descending resistance line. Prior to doing so, BTC created a double-bottom pattern, which was combined with a bullish divergence in the RSI. However, both the MACD and Stochastic RSI show a loss of momentum. This could mean a price decrease to validate the resistance line as support before resuming the upward movement.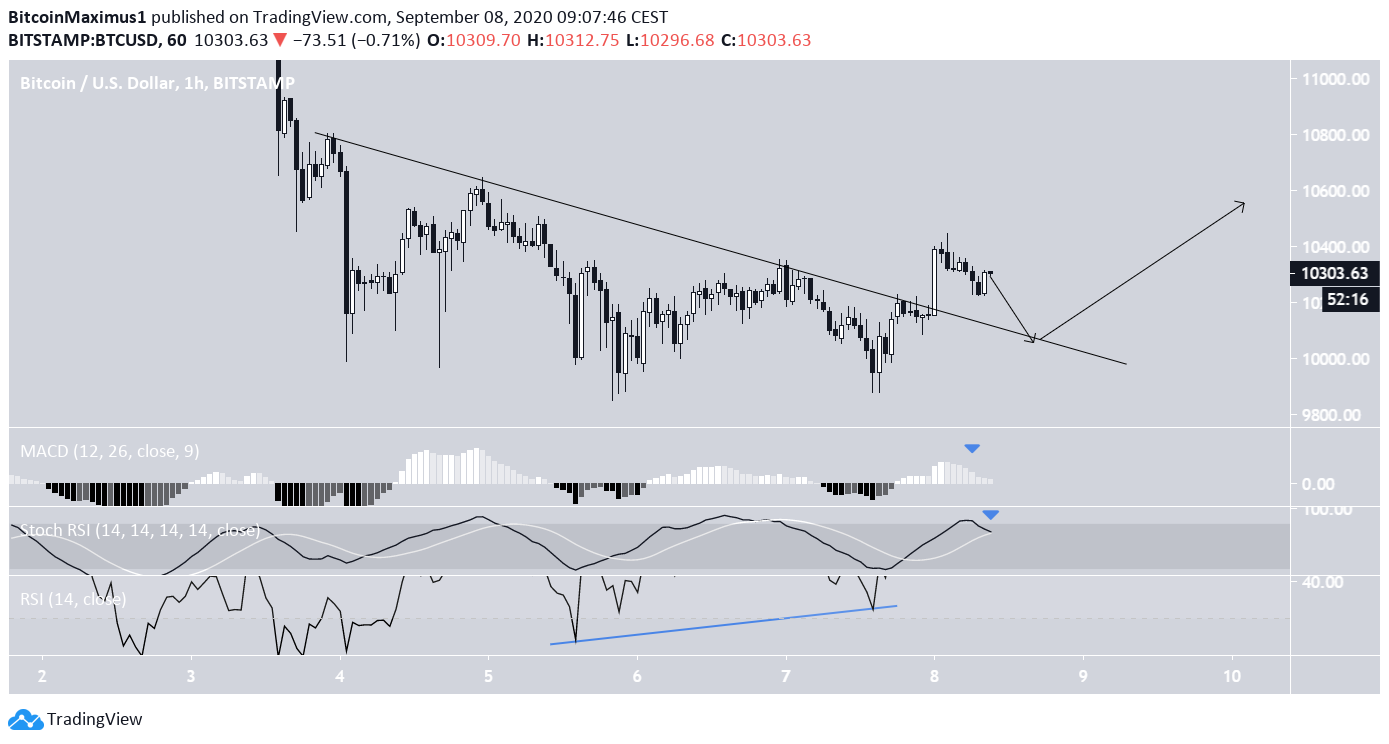
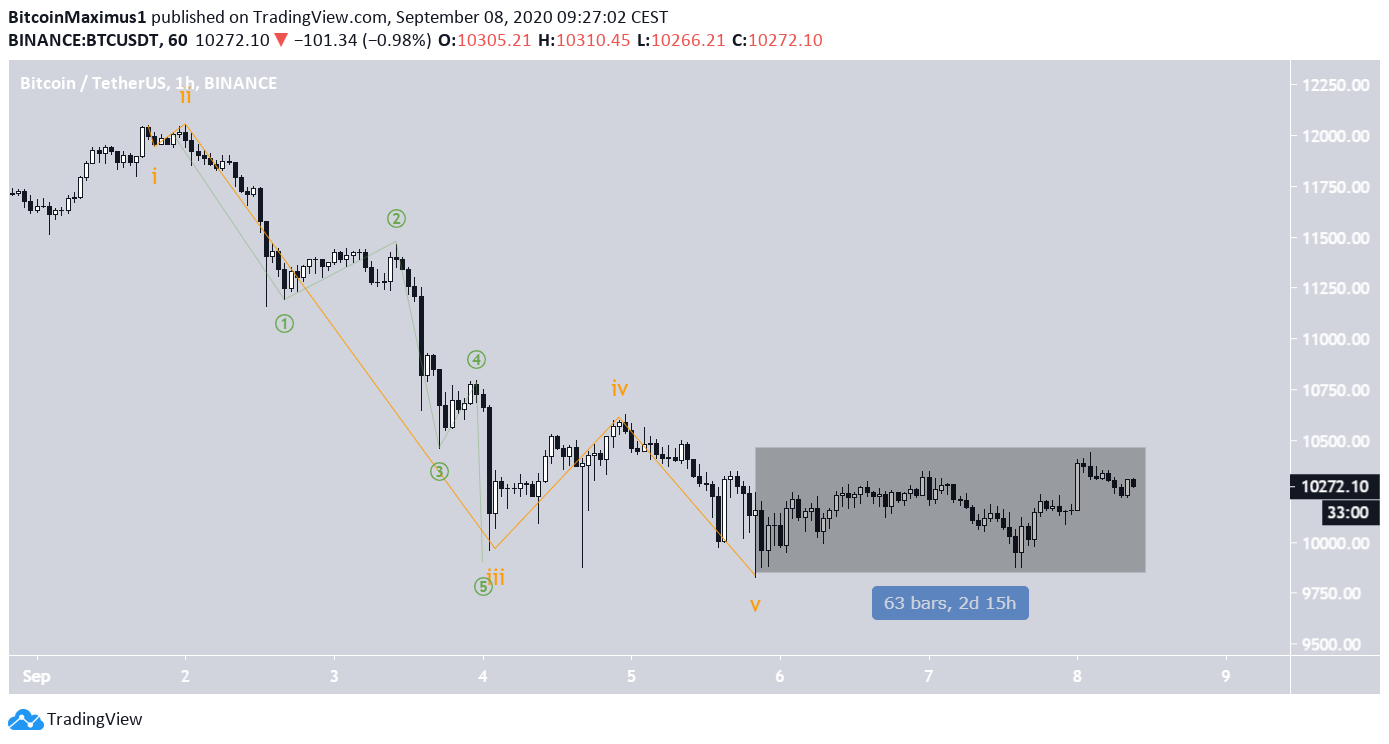
BTC Wave Counts
In BeInCrypto’s Sept 7 Bitcoin analysis, we stated that:It is likely that BTC has completed wave 4 of a five-wave bullish impulsive formation, by reaching a bottom of $9,825 on Sept 5.In addition, two wave counts were analyzed. The first suggests that the bottom has already been reached, while the other shows that there could still be one more wave down before the actual bottom is reached. The original wave count suggests that the downward impulsive move has ended and BTC has begun a new upward movement. It would mean that the movement since the bottom (outlined in black below) is the beginning of a new upward trend.

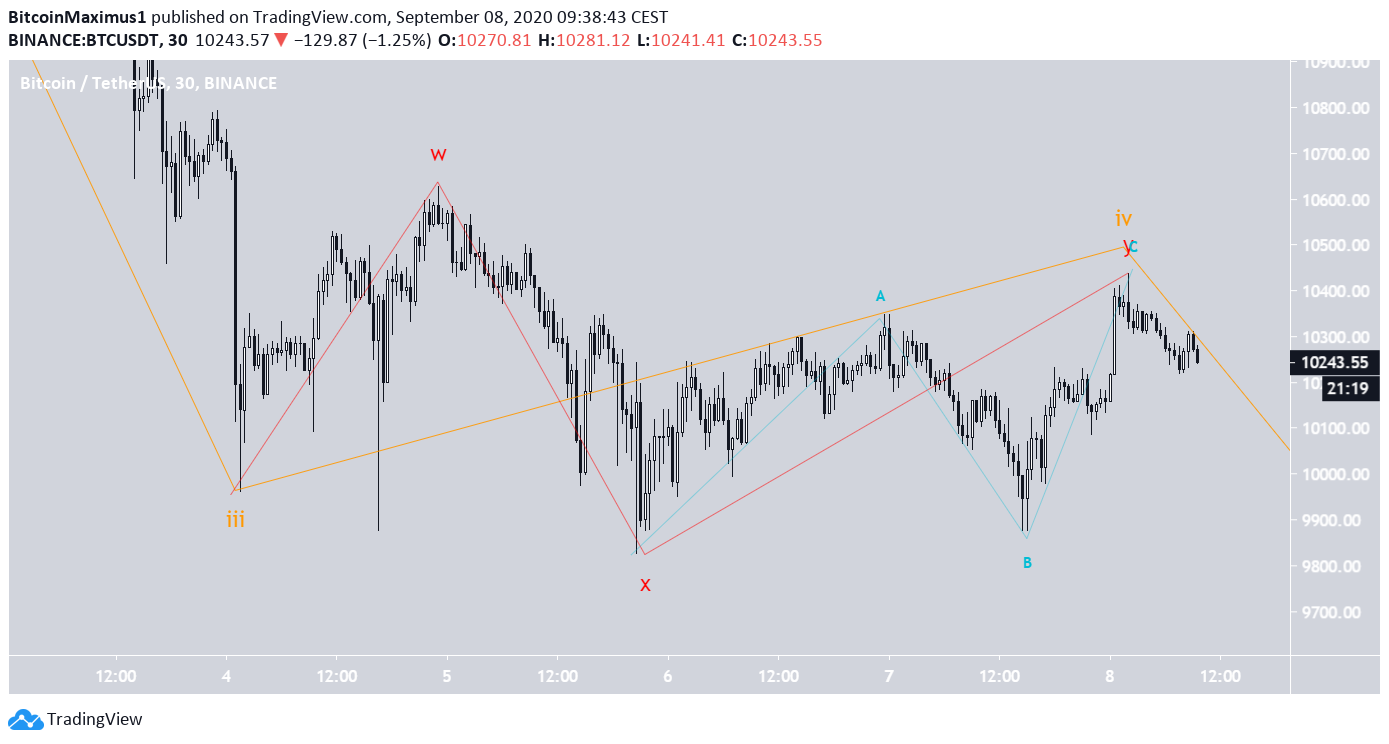
Alternative Wave Count
Therefore, the alternative wave count would suggest that the price is still in wave 4, with another wave down to go. The issue with this count is that wave 4 (in yellow below) has taken too long relative to wave 3, making it an unusual formation.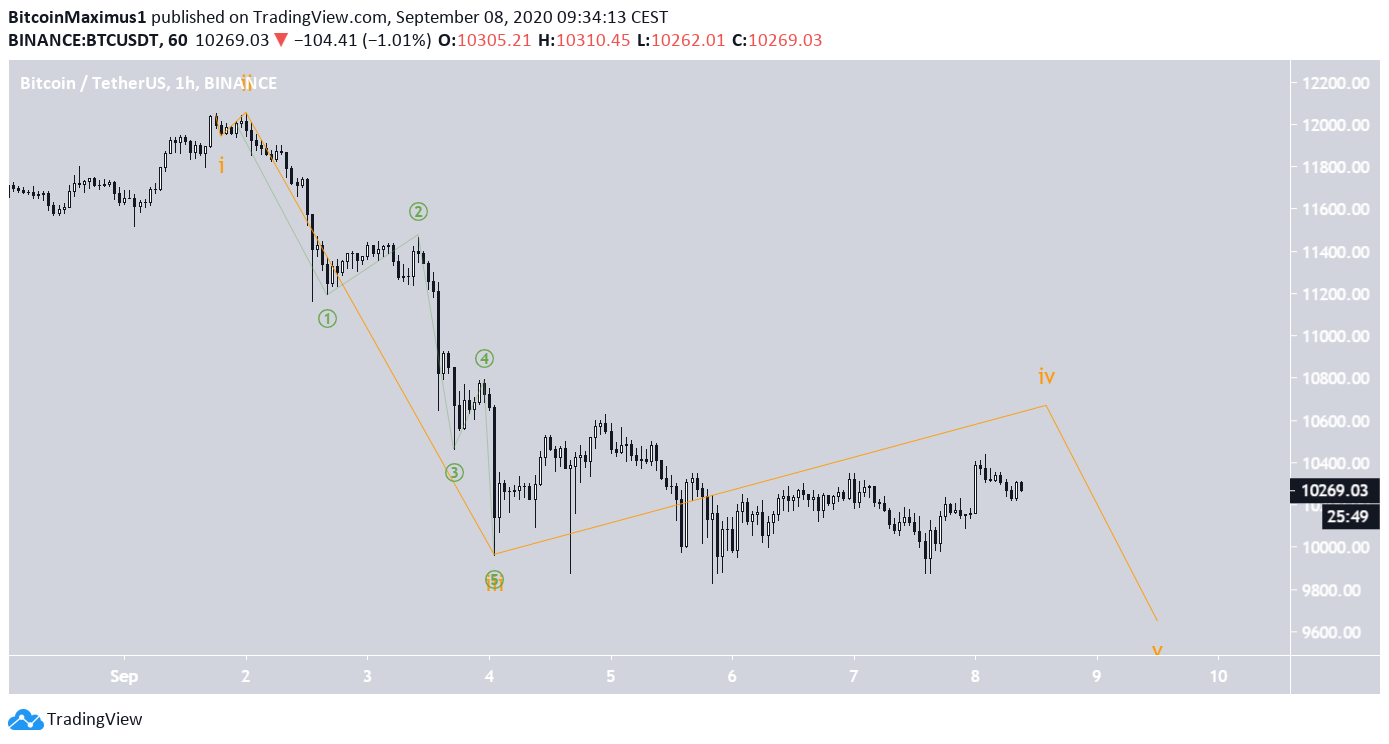
Top crypto platforms in the US
Disclaimer
In line with the Trust Project guidelines, this price analysis article is for informational purposes only and should not be considered financial or investment advice. BeInCrypto is committed to accurate, unbiased reporting, but market conditions are subject to change without notice. Always conduct your own research and consult with a professional before making any financial decisions. Please note that our Terms and Conditions, Privacy Policy, and Disclaimers have been updated.

Valdrin Tahiri
Valdrin discovered cryptocurrencies while he was getting his MSc in Financial Markets from the Barcelona School of Economics. Shortly after graduating, he began writing for several different cryptocurrency related websites as a freelancer before eventually taking on the role of BeInCrypto's Senior Analyst.
(I do not have a discord and will not contact you first there. Beware of scammers)
READ FULL BIO
Sponsored
Sponsored