


The Polygon (MATIC) price has fallen below a long-term structure, suggesting that the entire upward movement since June 2022 has ended.
Furthermore, the weekly and daily time frame price action alongside the RSI readings align with the possibility of more downside toward the closest support levels.
Polygon Price Falls Sharply
The weekly time frame provides a bearish reading for the Polygon price. The MATIC token had traded inside a long-term ascending parallel channel since July 2022.
The April 2023 breakdown invalidated the structure, suggesting that a new bearish trend has begun. So far, the price has created four successive bearish weekly candlesticks.
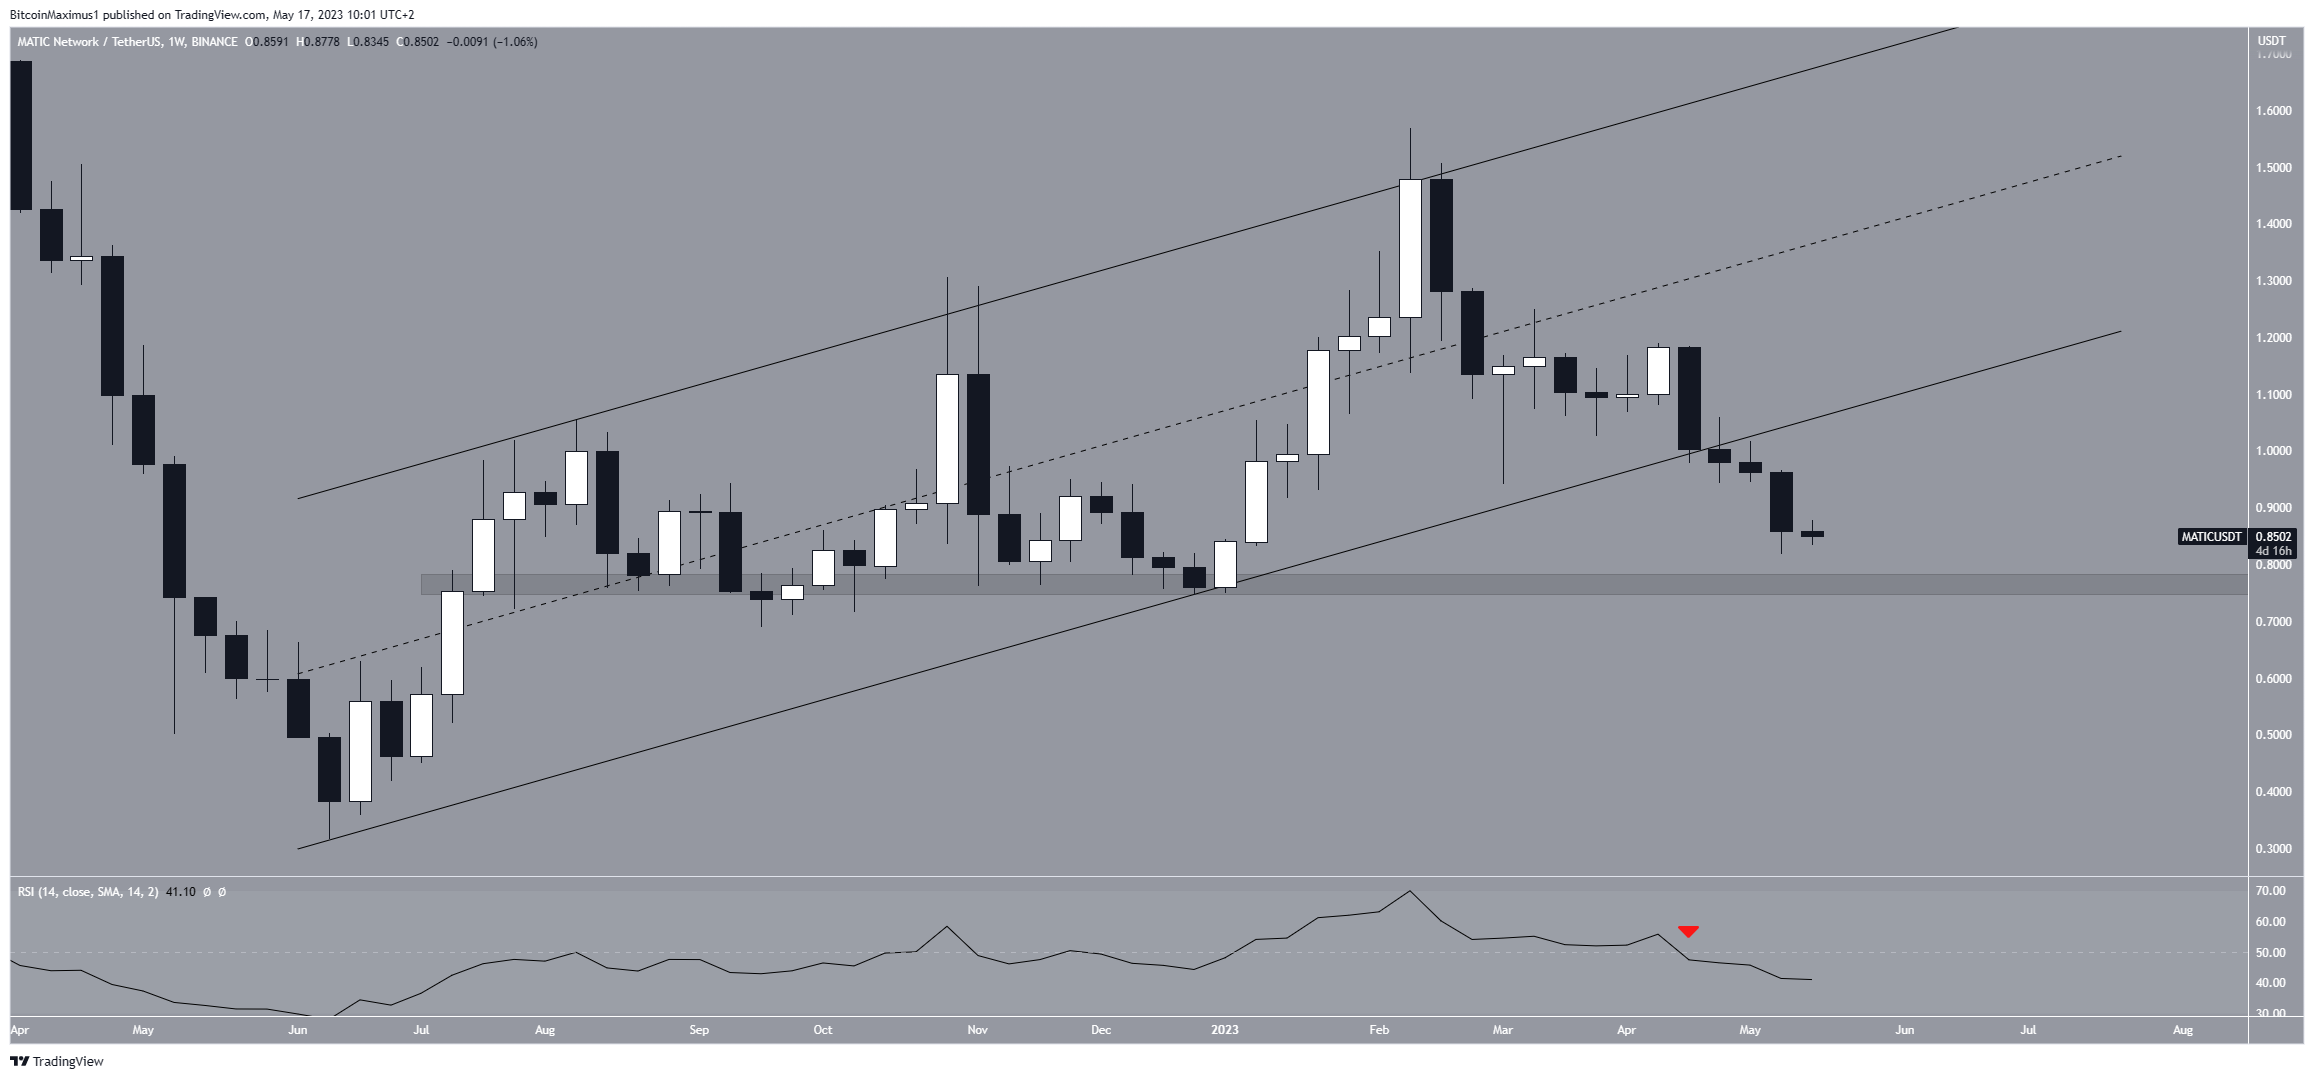
The weekly Relative Strength Index (RSI) indicator is bearish. The RSI is a momentum indicator used by traders to evaluate whether a market is overbought or oversold and to determine whether to accumulate or sell an asset.
Readings above 50 and an upward trend suggest that bulls still have an advantage, while readings below 50 indicate the opposite.
The indicator decreased below 50 (red icon) while the price broke down, legitimizing the downward movement.
MATIC Price Prediction: Breakdown Can Lead to More Downside
The technical analysis from the daily time frame shows that the MATIC price broke down from the $0.95 horizontal support area on May 8. The breakdown was crucial since the horizontal support area had been in place since the beginning of the year.
Now, the area is expected to provide resistance. Additionally, the area coincides with a descending resistance line that has been in place since the beginning of February.
So, it is a very significant level, below which the trend is considered bearish.
The next closest support area is at $0.75.
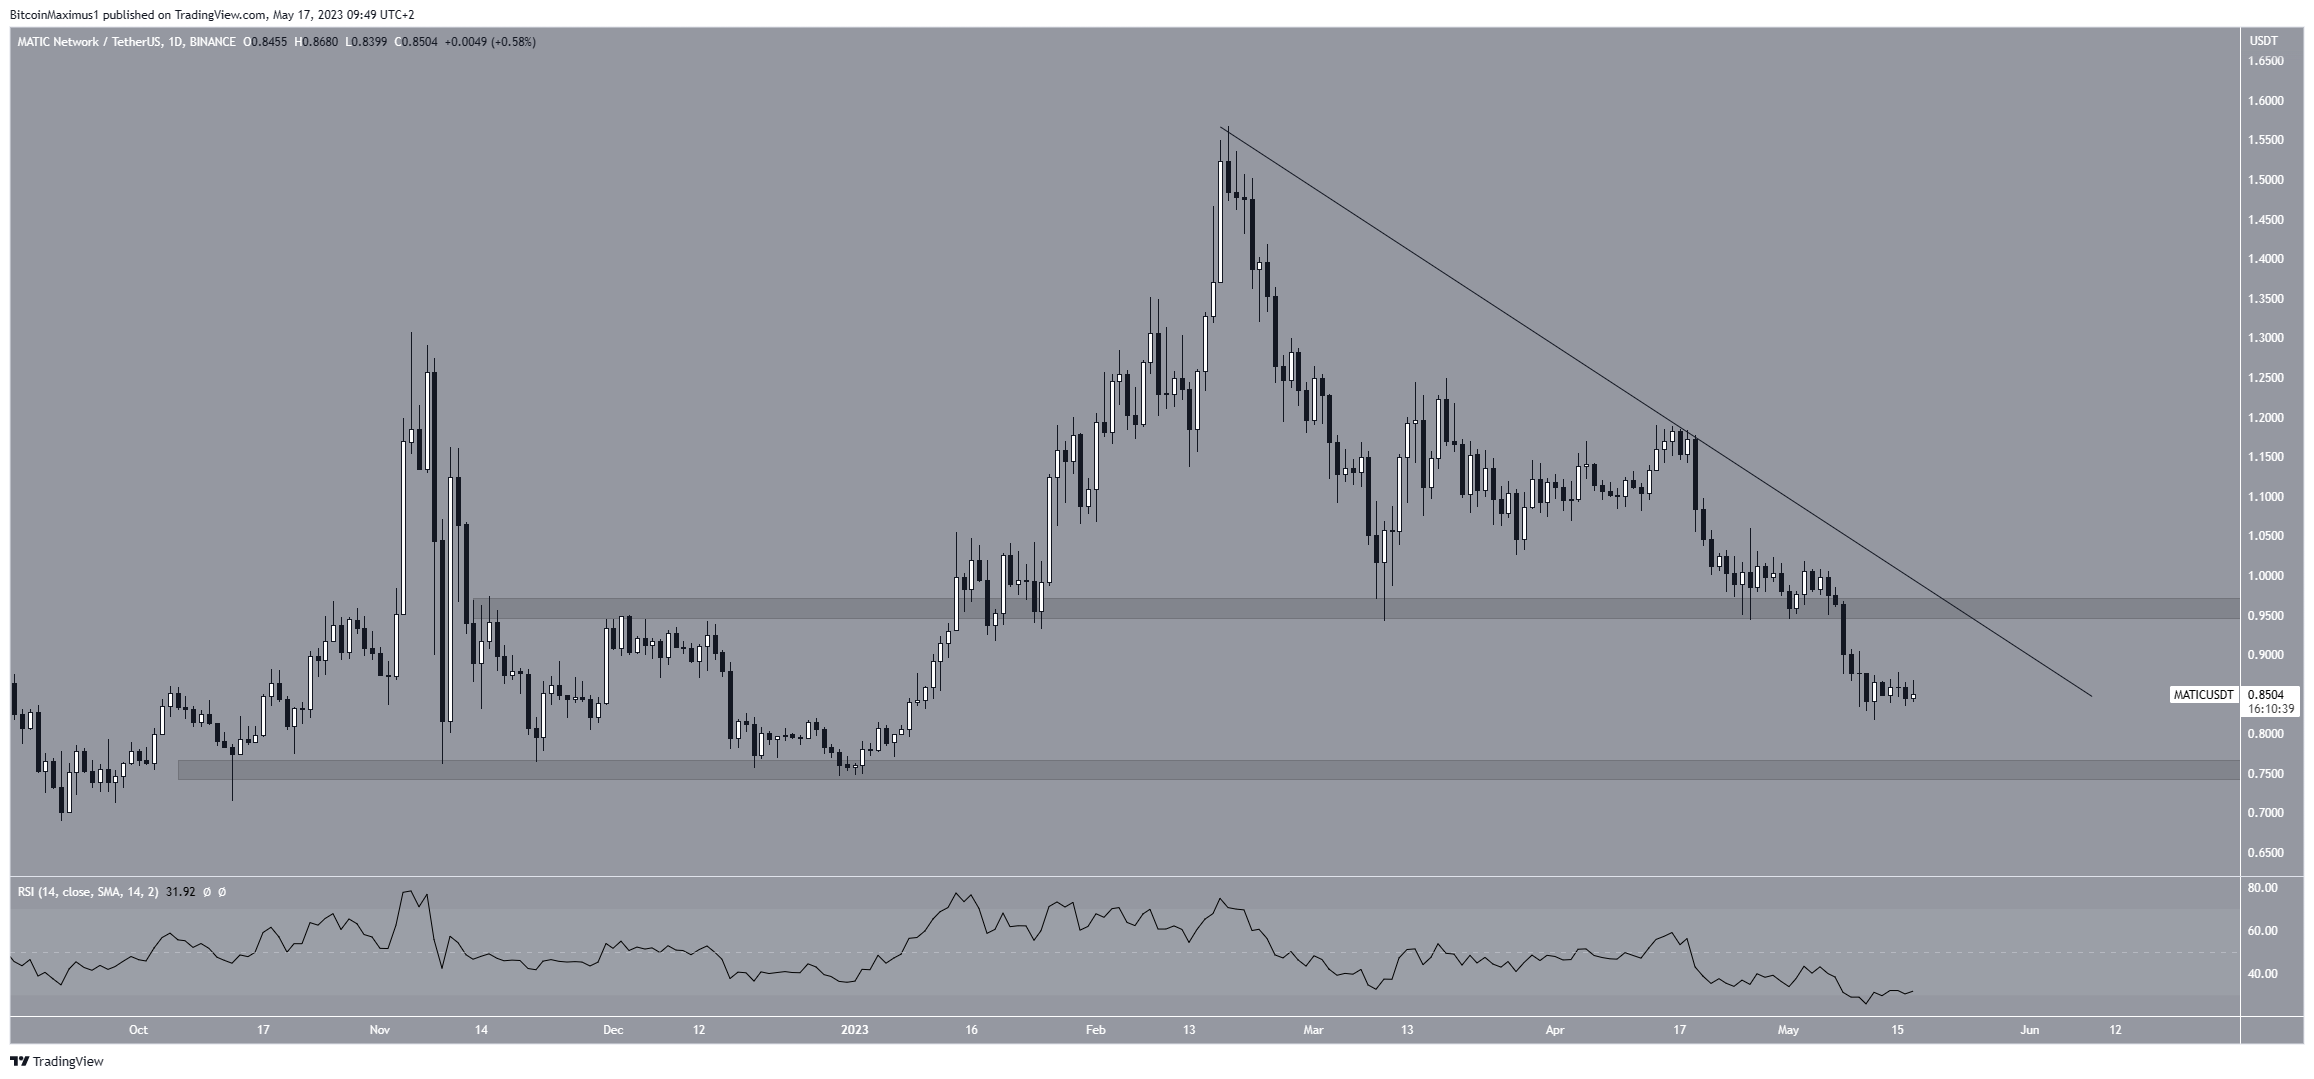
The daily RSI provides a bearish reading. The indicator is below 50 and decreasing, a sign of a bearish trend.
Despite the bearish MATIC price prediction, reclaiming the $0.95 area will mean that at least the short-term trend is bullish.
In that case, the future price can increase to the previous channel’s support line at an average price of $1.20.



