


Polygon (MATIC) trades in a short-term corrective pattern which puts the previous breakout at risk of being invalidated.
A technical analysis of MATIC’s price movement on a daily basis shows that on March 29, the price broke out from a resistance line that had previously caused several rejections. Currently, MATIC price is set for either a breakout or breakdown in price when analyzing its movement.
MATIC Price Breakout or Fake Out?
The MATIC price breakout confirmed that the minor support area at $1.08 was reclaimed and that the previous drop below that area (highlighted in red) is now invalid.
Using Fibonacci retracement levels, the recent MATIC price breakout could not maintain the upward trend and did not reach the 0.5 Fib retracement level at $1.25. Fibonacci retracement levels operate as a set of horizontal lines derived from the Fibonacci sequence, which indicate areas where support and resistance may be encountered.
This recent failure to break the 0.5 Fib retracement level makes it possible for the price to drop again.
Nevertheless, MATIC created a higher low on April 12 (green icon), and the price has increased since. A higher low can be considered a bullish trend, as it represents the price of an asset reaching a low point that remains higher than the previous low point on the chart.
This can indicate more potential upside in price movement, as seen in the chart below.
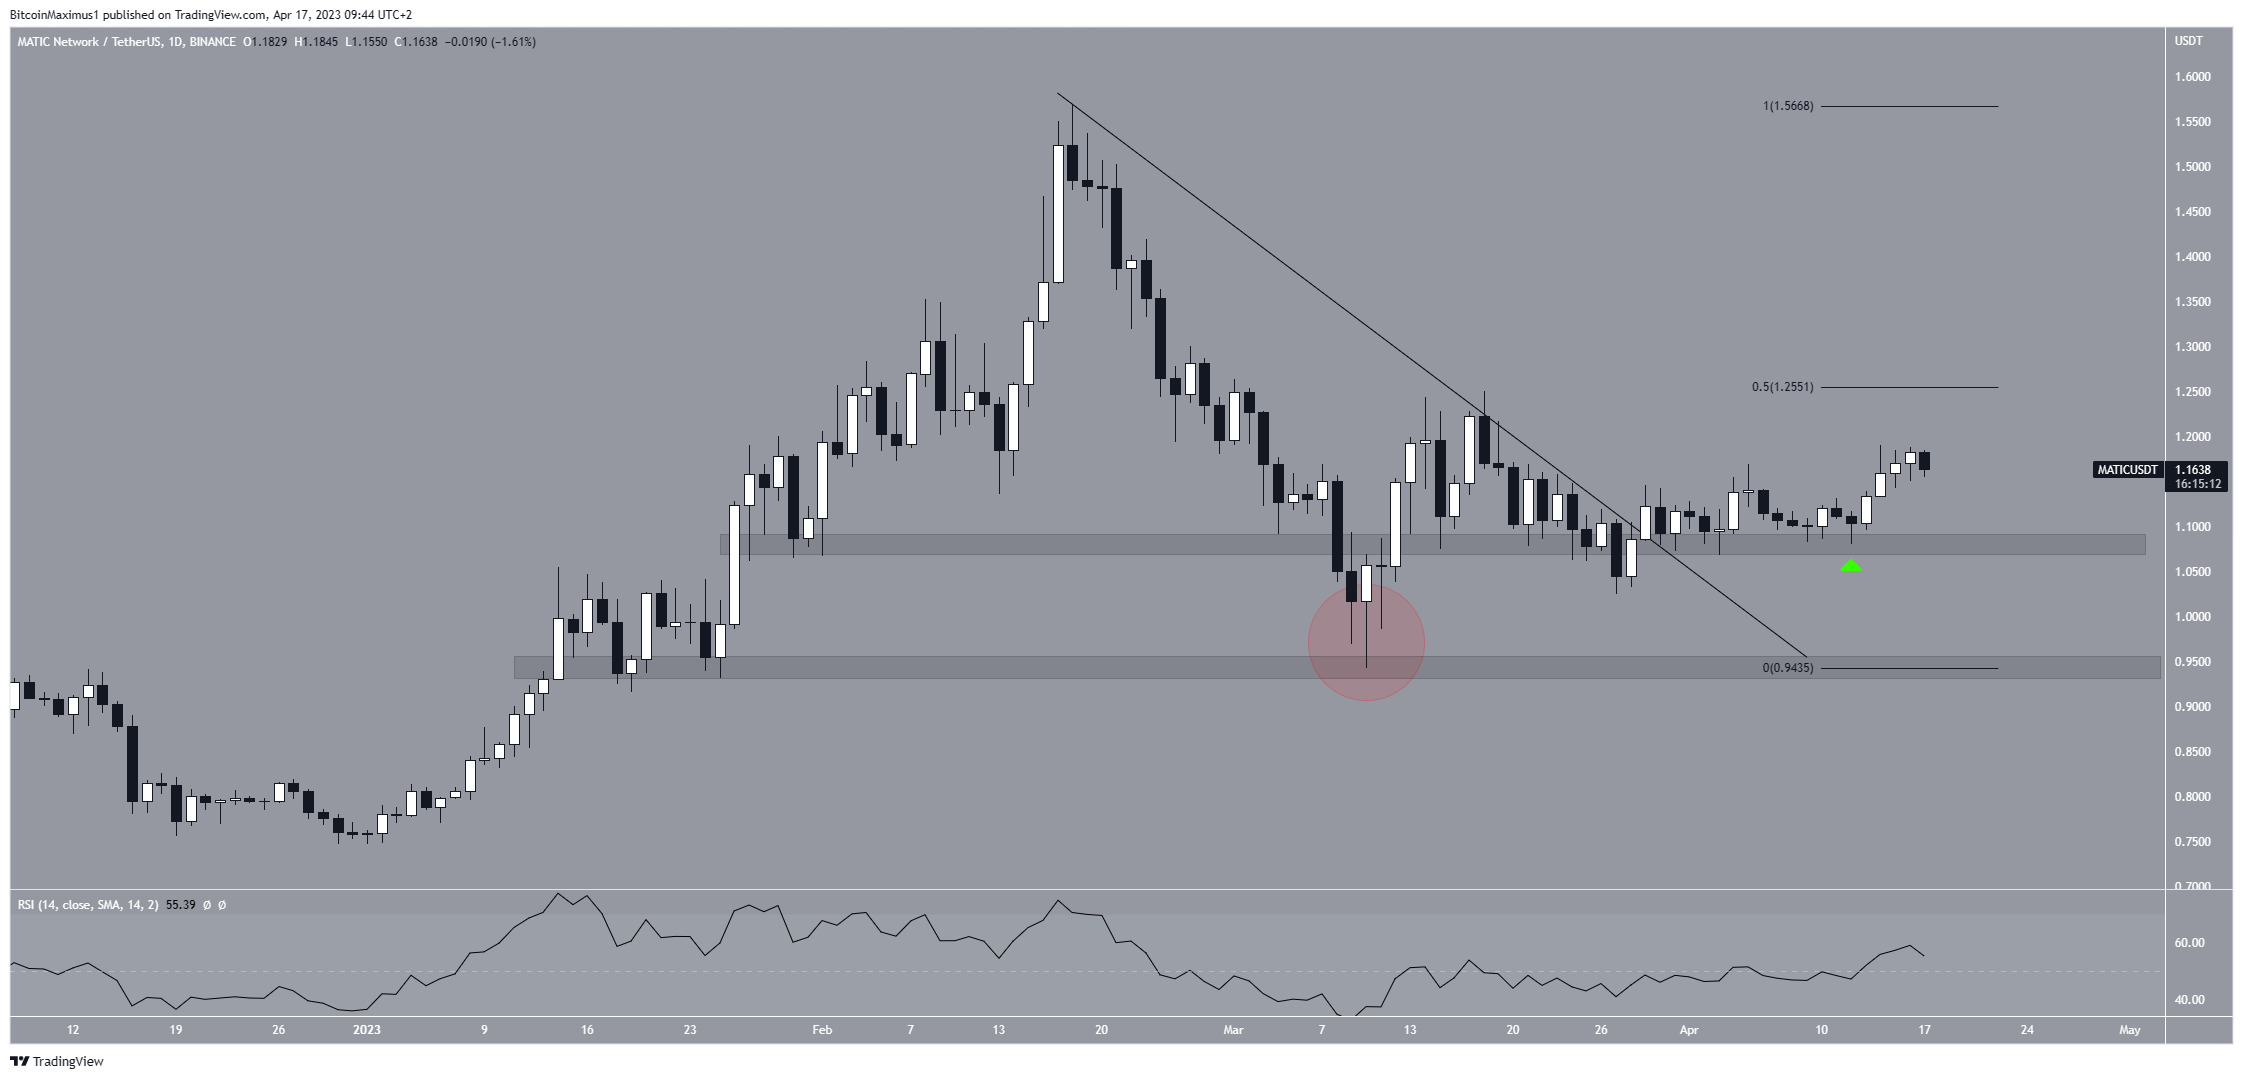
Looking at the Relative Strength Index (RSI) on the daily chart, one can see that it is currently above 50 and increasing, which suggests that an upward movement is more likely to happen.
The RSI tool helps traders understand if crypto is overvalued or undervalued by measuring how quickly its price changes. It looks at how fast and big the price has moved recently to determine if it might be time to buy or sell the crypto.
It’s an indicator that offers an additional angle for traders to determine if the crypto price is worth buying or selling. In this case, it suggests that MATIC is bullish because it is above 50 and increasing.
Polygon (MATIC) Price Prediction
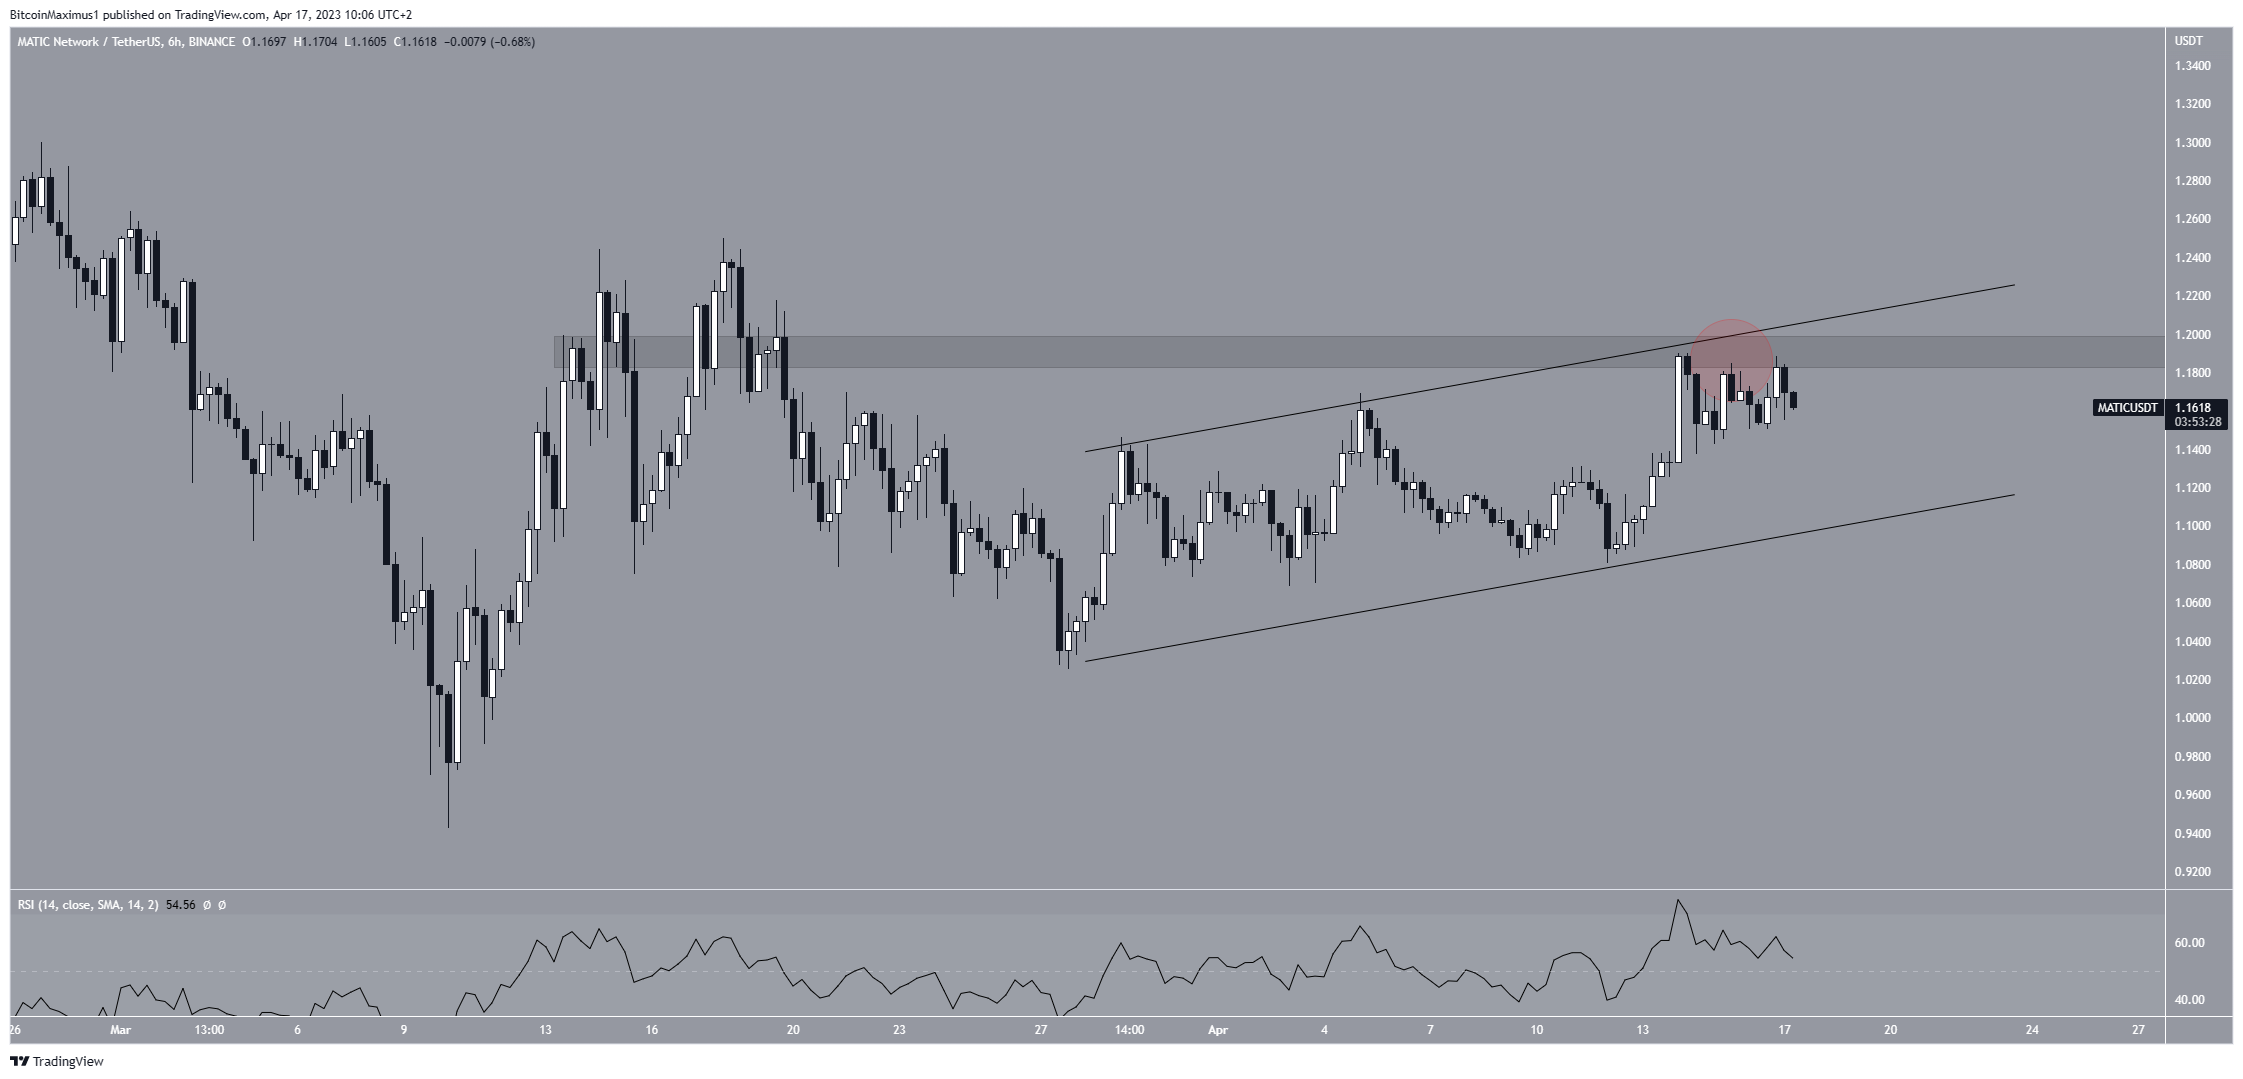
The technical analysis from the short-term six-hour time frame aligns better with the possibility of a breakdown. This is because the price trades inside an ascending parallel channel. An ascending parallel channel relates to the price action falling in between upward slowing lines that are parallel.
By drawing the lower trend line that connects with swing lows on the chart and an upper channel that consists of swing highs.
Looking at the chart, this can be considered a bearish pattern. The channel’s resistance line also coincides with the $1.19 minor resistance area.
Despite the rejection from the area (red circle), the MATIC price still trades in the upper portion of the channel. This allows for the possibility that it will eventually break out.
Whether the price breaks out or falls to the channel’s support line will likely determine the future trend’s direction. While a breakout could lead to a high of at least $1.25 and possibly $1.50, a breakdown would likely trigger a fall to $0.94.
To conclude, the Polygon price forecast is still undetermined. Whether the price breaks out from the current pattern or gets rejected could determine the future movement. A breakout could lead to highs of $1.25 or $1.50, while a breakdown could catalyze a fall to $0.94.
For BeInCrypto’s latest crypto market analysis, click here.


