


The LUNC price experienced a significant increase of more than 37% over the last week. However, the Terra Classic price subsequently encountered bearish rejection at the Golden Ratio resistance
Following the bullish divergence that had developed until our last price forecast, a massive price surge occurred for Terra Classic.
Terra Classic Price Breaks Out
The LUNC price rose about 37% shortly after, reaching the Golden Ratio at approximately 0.000113 USD, where LUNC faced a firm rejection.
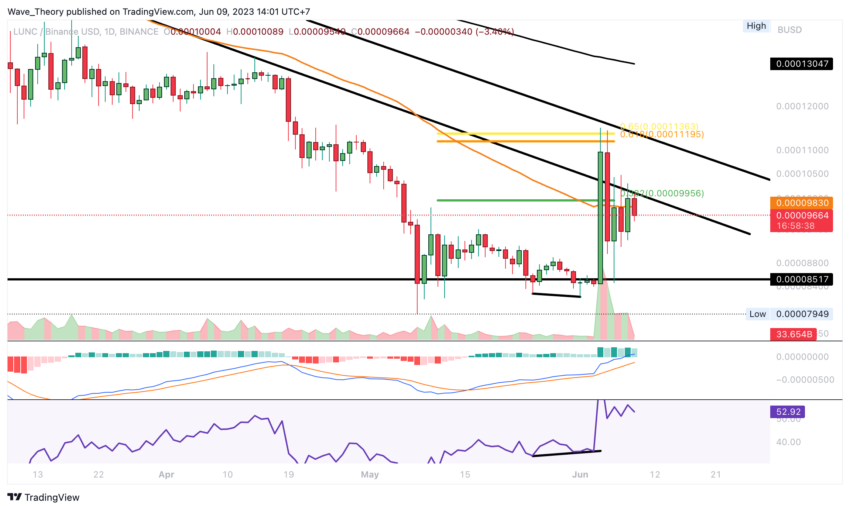
Consequently, the MACD histogram has also taken a bearish dip today, although the MACD lines are still bullishly crossed.
Golden Cross Potential: 4H Chart Shows Bullish Signal
A Golden Cross of the EMAs might be forming in the 4H chart, confirming the bullish trend in the short term.
However, the MACD lines are about to cross in a bearish manner. Furthermore, the MACD histogram is already ticking bearishly lower.
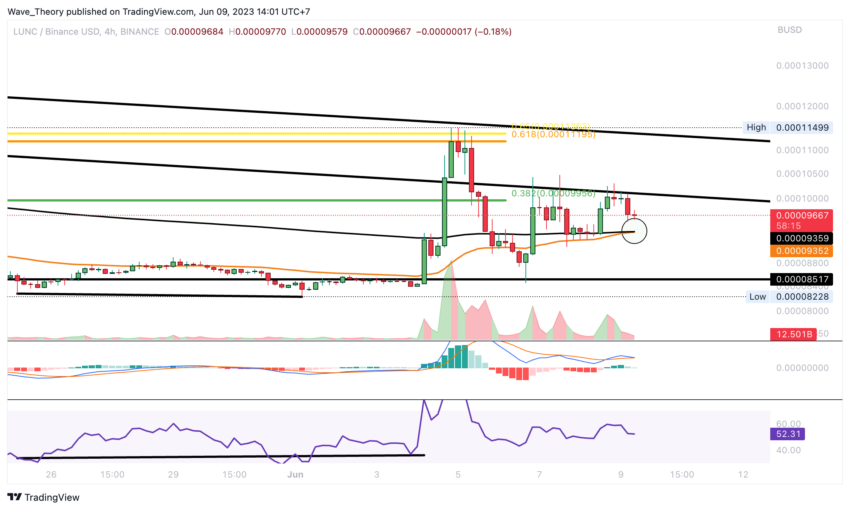
Due to the lower high points, it currently appears that LUNC might revert to support around 0.00008517.
MACD Indicator Signals Bullish Outlook
On the weekly chart, the MACD has been ticking bullishly higher for four weeks. Thus, the MACD lines may soon cross in a bullish manner.
The MACD (Moving Average Convergence Divergence) indicator is a tool used in trading to help identify potential trends and momentum shifts in cryptocurrency prices.
It consists of two lines that move up and down on a chart. When these lines cross each other, it can signal a buying or selling opportunity. Traders use these lines to get an idea of whether the price might go up or down in the near future.
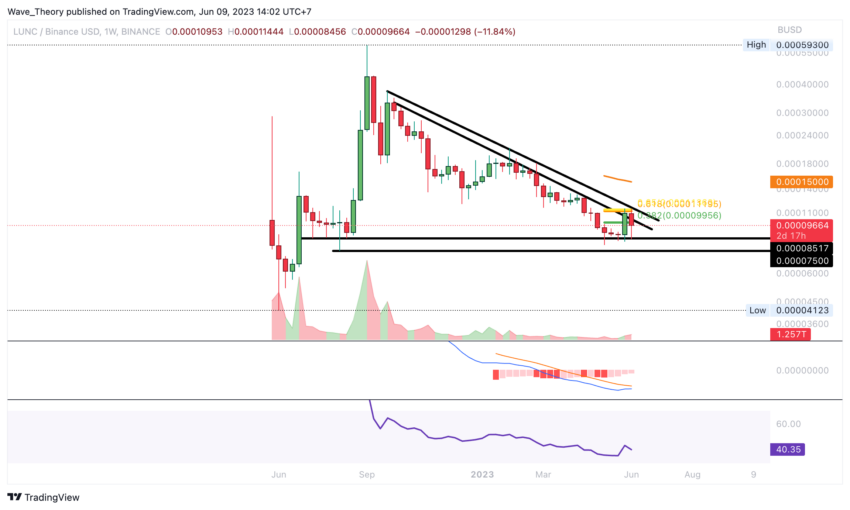
Significant support awaits the LUNC price lower down, between approximately 0.000075 and 0.00008517. Also, the decisive Fib resistance awaits at the Golden Ratio around 0.000113. That’s where the bearish trend line of the entire bear trend is also situated.
A break of this resistance would give hope for a bullish trend reversal.
LUNC Price: Possible Bullish Engulfing Candle Incoming
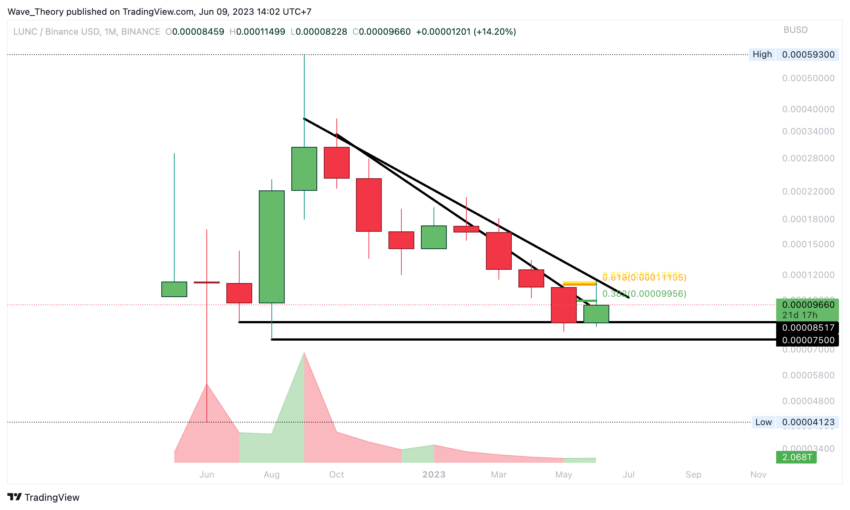
If the LUNC price closes above 0.00010971 this month, a Bullish Engulfing Candle will be formed on the monthly chart. If so, the subsequent month could be very bullish for Terra Classic.



