


Litecoin is known by many people as ‘digital silver’ due to its similarity with Bitcoin, which is often called ‘digital gold.’ The two share several similarities, but the main difference between the two is the amended Proof-of-Work consensus algorithm in Litecoin.
In August 2019, Litecoin underwent its second Litecoin halving, which cut the block rewards from 25 to 12.5 per block. Interestingly, the price decreased considerably after this event. This could have occurred since the months leading up to it saw the price massively increase, going from $30 all the way to a high of $150 in June — possibly a result of speculative buying to due the proximity to halving.
Short-Term Analysis
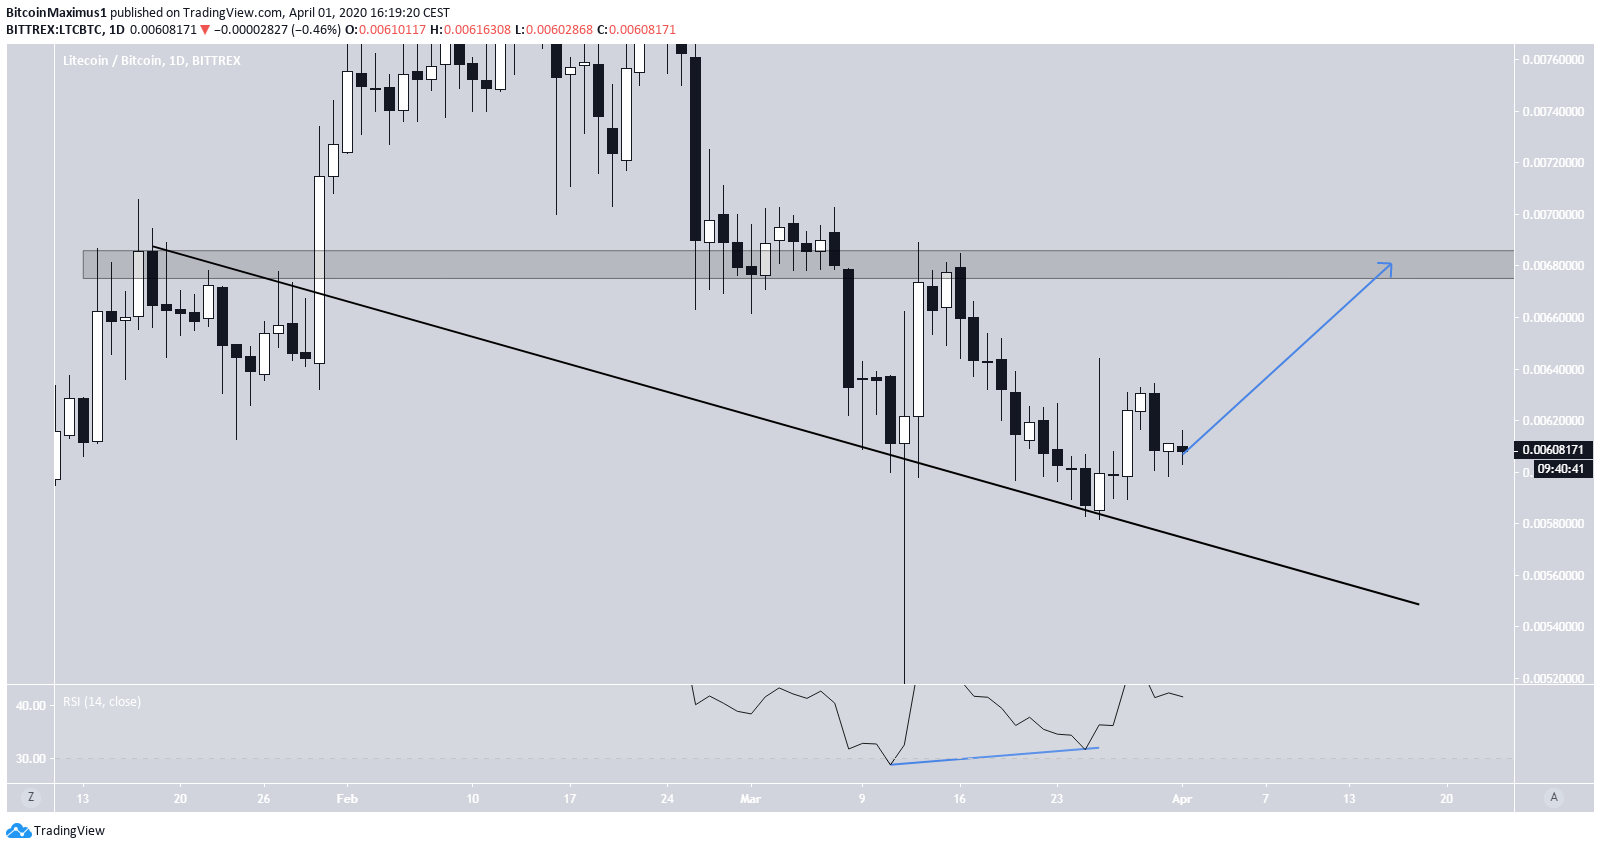
Looking at the daily chart, we can see that the LTC price is following a descending support line and has been doing so since January 18. The price has validated it several times, most recently on March 11 and 25. After the second validation, the price began an upward move that is still ongoing.
The Litecoin price action seems bullish, at least in the short-term. The price increase was preceded by a considerable bullish divergence in the daily RSI. Therefore, the price is expected to continue moving upwards, at least until it reaches the resistance area at ₿0.0068.
While short-term trading can be stressful, due to the high volatility and numerous movements such as fakeouts that are near impossible to predict, BeInCrypto has created a telegram group to provide daily discussions about recent price movements as well as educational content intended to help traders of every skill level.
Click here to join the FREE telegram group
Long-Term Predictions
In the table below, we will present several important highs and lows, along with the dates in which they are reached. Afterward, they will be used in the rest of the analysis in order to make predictions about the price on December 31, 2020, 2021 and 2025.
RSI Similarities
In order to arrive at our Litecoin predictions, we will look to find similarities or fractals between the price movement at different points in time. Afterward, this can help us to predict the price at a future date in time, making the assumption that the price movement will be similar after said points. In order to do that, we will incorporate technical indicators in the analysis.
Throughout the entire Litecoin price history, there have been only two occasions in which the weekly RSI has generated bullish divergence; in January 2015 and March 2020. Naturally, this leads to the assumption that at this date, the price was at the same point in its respective market cycle. Considering that the price has yet to revisit the levels reached in January 2015, the hypothesis is that the movement in March 2020 is also the low prior to the next market cycle.
To better visualize large price fluctuations, logarithmic charts are going to be used in this analysis.
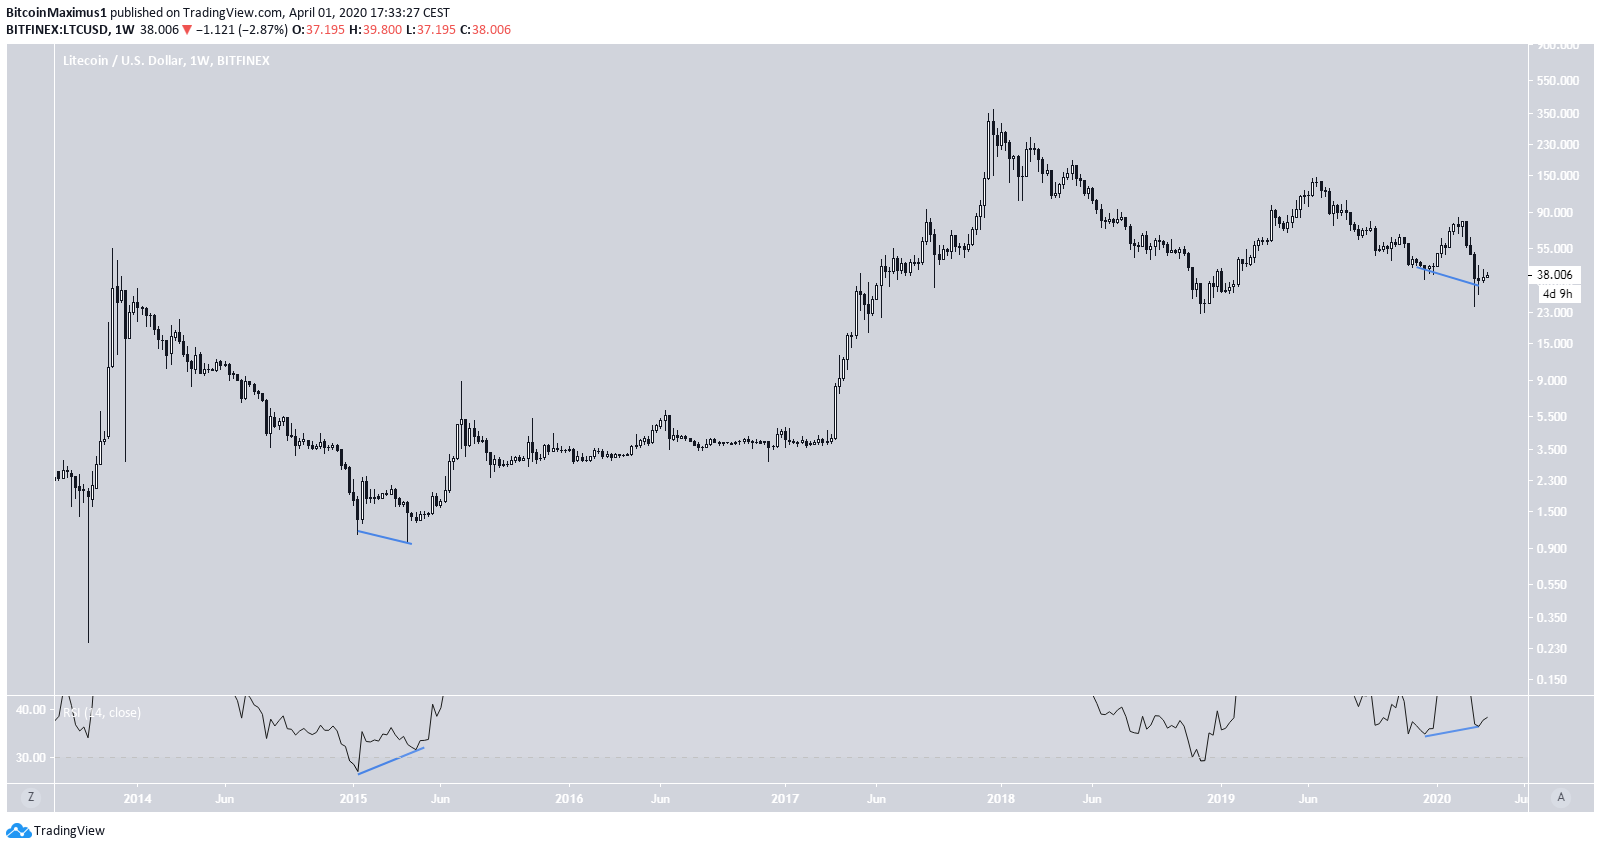
While the RSI values are not identical, since the RSI was oversold in 2015 but is not in the current movement, the divergence is extremely similar. In addition, the second bottom was characterized by a very long lower wick both times.
Therefore, we may have the first similarity in these LTC movements: Bullish divergence in the RSI was recorded once the price made a lower low after a long corrective period. The second bottom was characterized by a long lower wick.
Moving Average Similarities
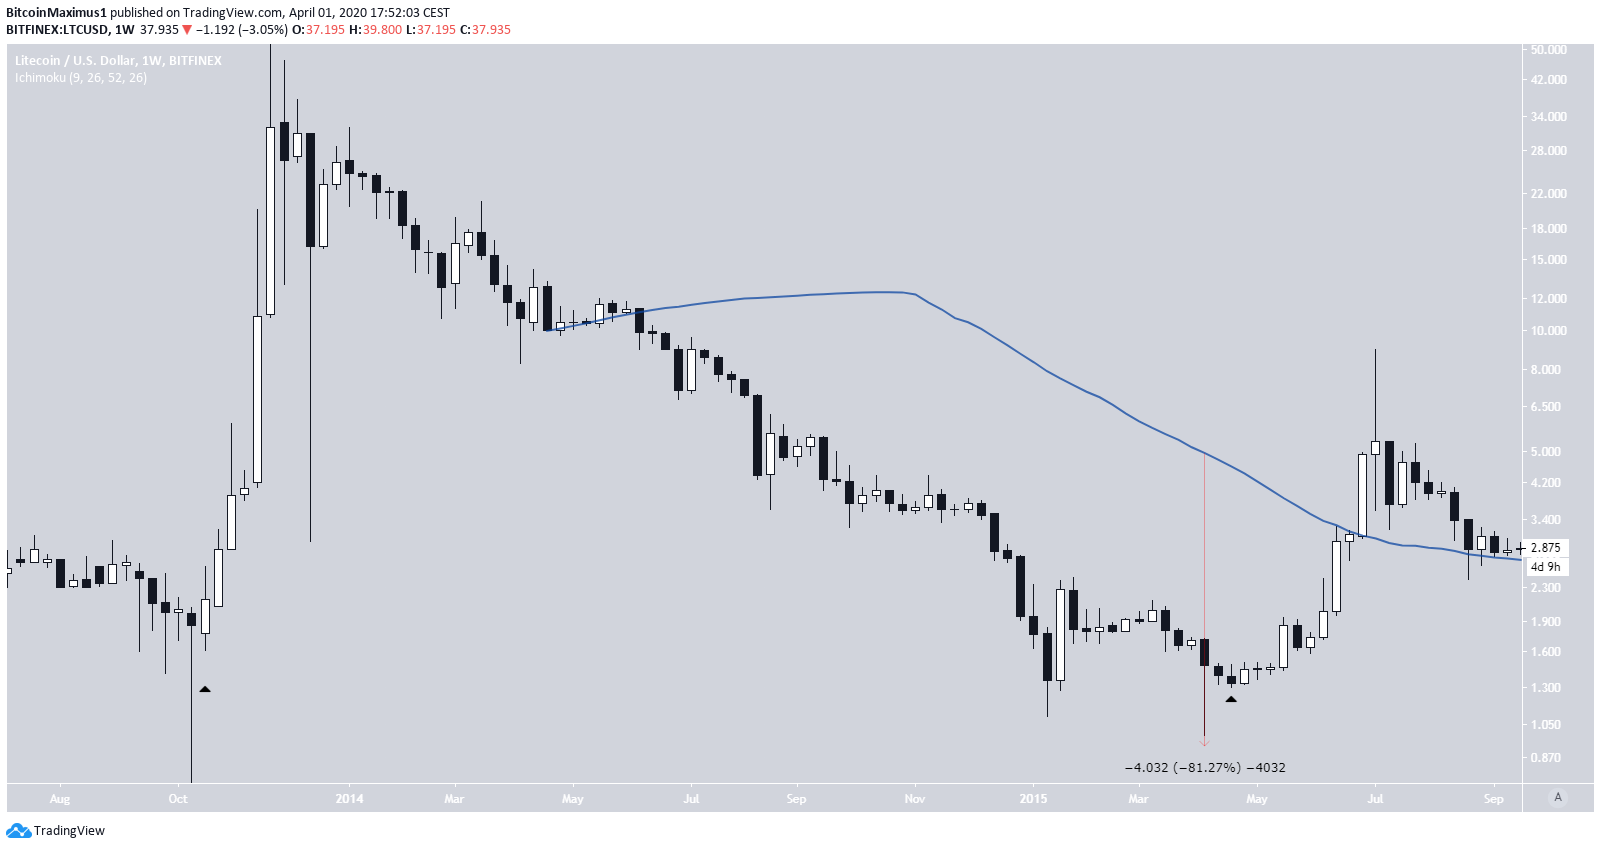
Another similarity comes from looking at the price action prior to the bottom and the 50-week moving average (MA). The reason this specific MA is chosen comes because of the lack of adequate data prior to the January 2015 bottom, since LTC was launched in June 2013. Therefore, the 100- and 200-week MAs did not have sufficient data to be drawn.
To start, in the 2015 movement, the LTC price action measured a full 100 percent retracement relative to the price low before the initial upward move. Afterward, at the date of the second bottom, the price was 81 percent below the 50-week MA.
In the 2020 movement, the price also retraced fully relative to the price prior to the entire upward movement, even though this only stands true if we use the wick low instead of the weekly close. However, the second bottom was 65 percent below the same MA, instead of 81 percent as in the first movement. While this is an identical decrease, it is close enough to be considered as a similarity.
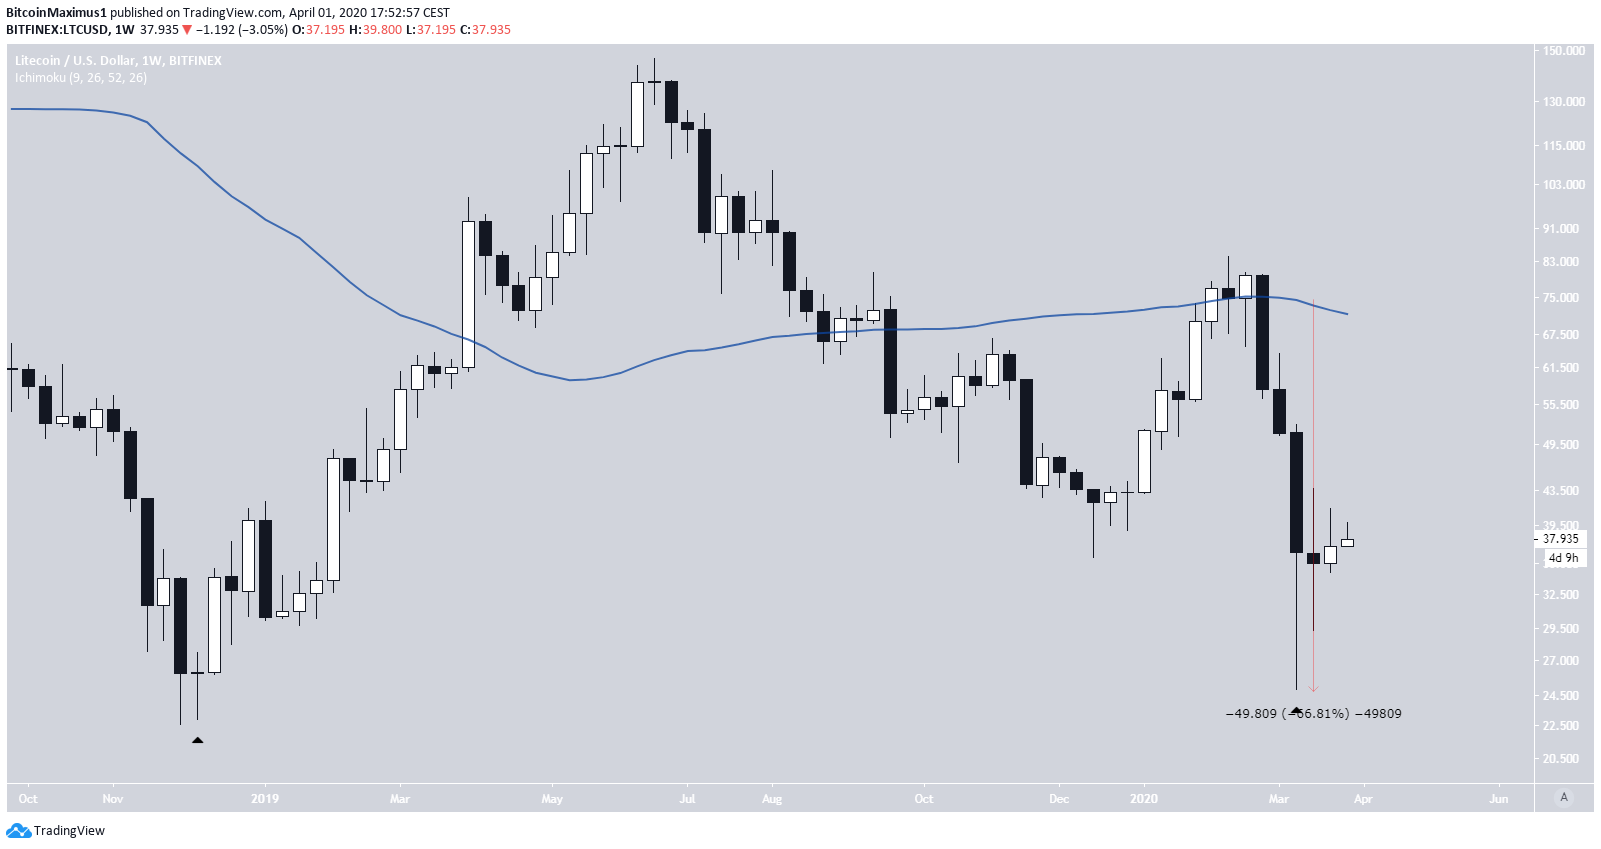
Now, we have two more similarities between these movements: After initiating an upward move, the Litecoin price retraced by 100 percent when it made its bullish divergence low, and at the time it was considerably (>60 percent) below its 50-week moving average.
Time Periods and Rate of Increase
To determine what prices might be reached and when will they be reached, we must determine a ratio that converts the movements after the 2015 low to those after the current one. In order to do that, we will examine the time periods of these movements.
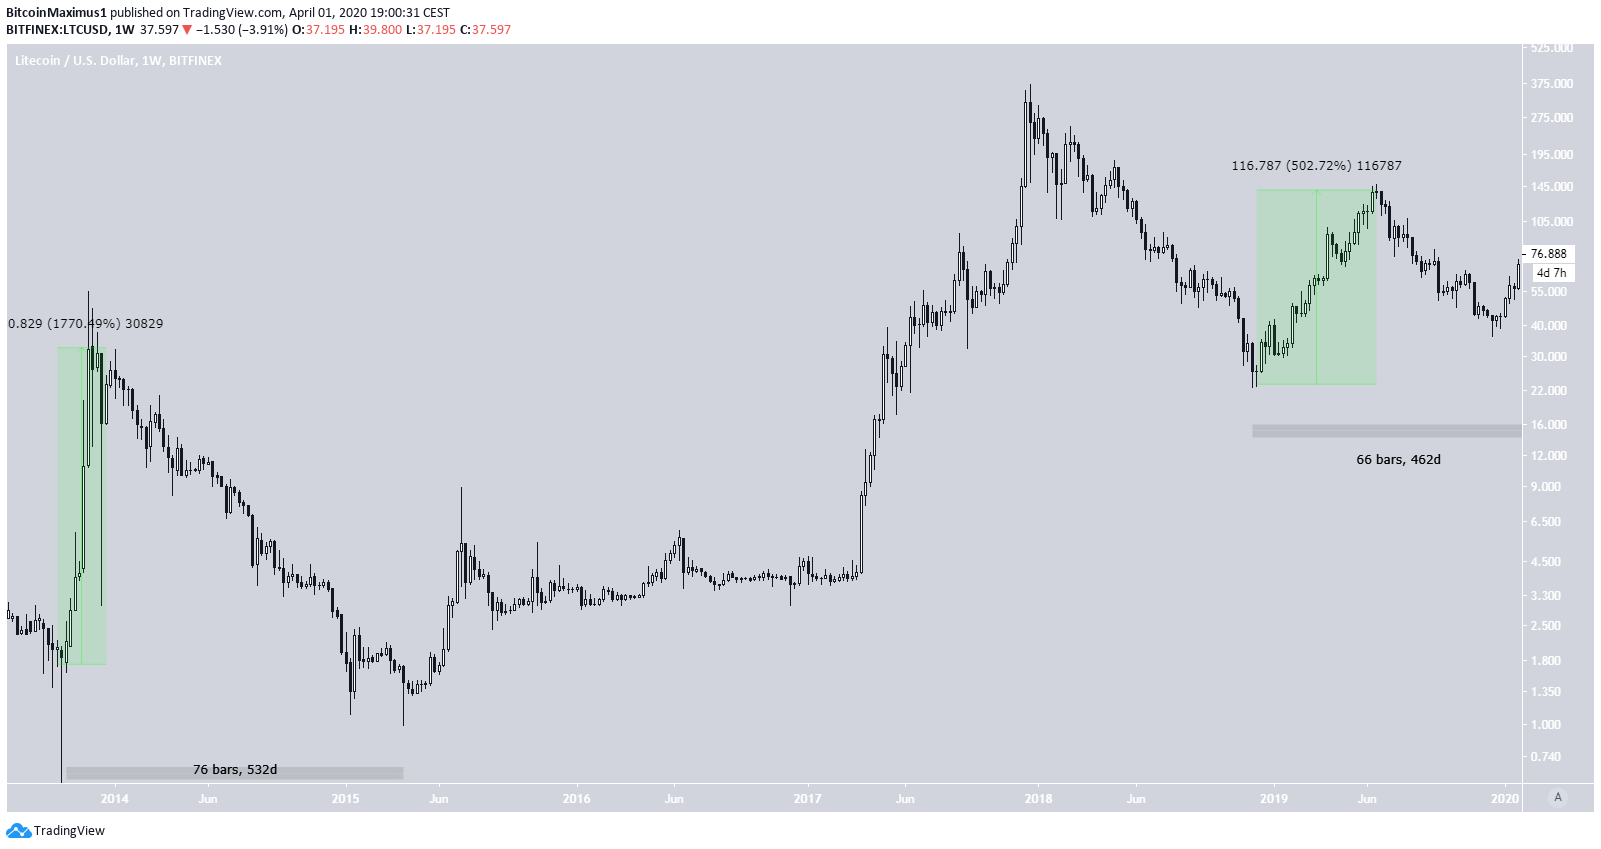
Prior to reaching the lows that generated the bullish divergence, the Litecoin price initiated a strong upward move in both movements. Therefore, we will measure the time it took beginning from the initial level that started the upward move to the second low of the divergence. In 2015, this entire movement took 532 days, while in 2020 the movement took 462 days.
Therefore, we can make the assumption that the movement in 2020 is 1.15 (532/462) times slower.
Next, we will measure the rate of increase from the lowest point prior to the upward move all the way to the high. In the 2015 movement, the price increased by 1770 percent, while in 2020 it only did so by 502 percent. Therefore, the movement in 2020 was 5.31 times smaller (1770/502).
Analysis of Similarities
Until now, we have found three similarities between the bottoms reached in January 2015 and March 2020.
- Bullish divergence in the RSI was recorded once the price made a lower low after a long downward move. The second bottom also had a long lower wick.
- The price retraced fully after initiating an upward move.
- During the bottom, it was considerably (>60 percent) below its 50-week moving average.
Keeping these similarities in mind and using our conversion ratios for time and magnitude, we will attempt to find a date after the April 2015 bottom that coincides with December 31, 2020, 2021 and 2025.
Litecoin Price Prediction 2020
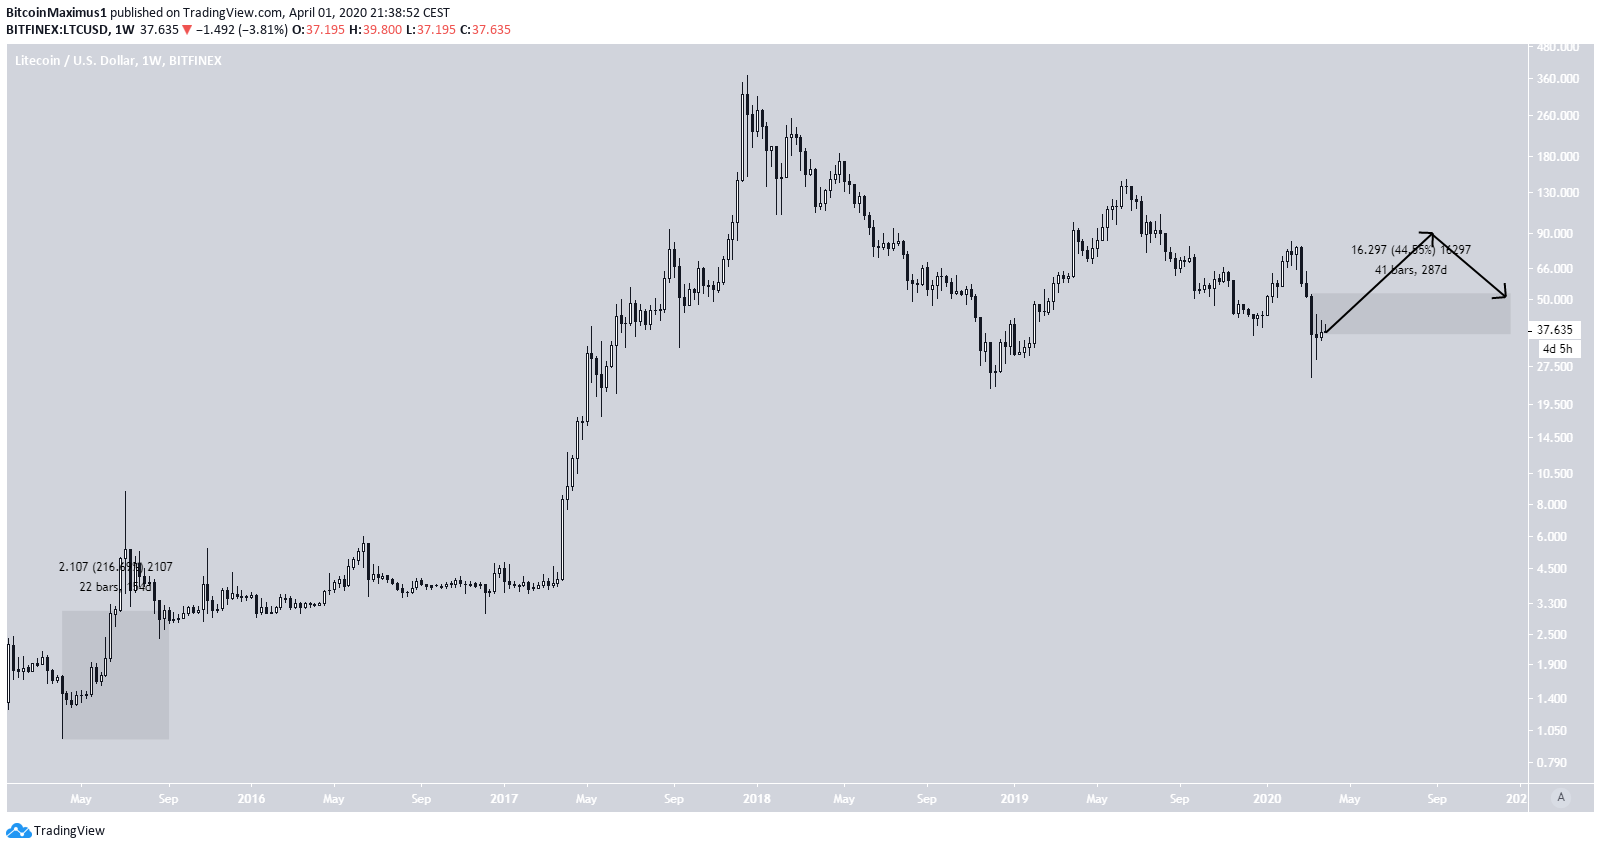
In order to find the LTC coin price at the end of 2020, we need to find the date after the January 2015 bottom that coincides with the date 294 days (time until December 31, 2020) after the March 2020 one. Using our 1.15 rate of time conversion, that date falls on September 7, 2015.
On September 7, 2015, the LTC price was 216 percent above its January low. Using our 5.31 rate of magnitude conversion, we arrive at a price of $51 on December 31, 2020.
Litecoin Price Prediction 2021
The price of Litecoin has increased at a faster than expected rate until Dec. 2020. Therefore, we need to use a different method in order to predict the price at the end of Dec. 31.
There is an interesting similarity between the price movement in Jan 2015 and that on Feb 2020, more specifically the double bottom pattern combined with bullish divergence in the 3-day RSI. Those two mark the only occasions in which the 3-day RSI had generated bullish divergence.
While the length of time between the two bottoms was nearly identical, that in 2020 was sharper (31% to 20%), suggesting that while they may have the same rate of time, the movement in 2020 has a sharper magnitude than that in 2015.
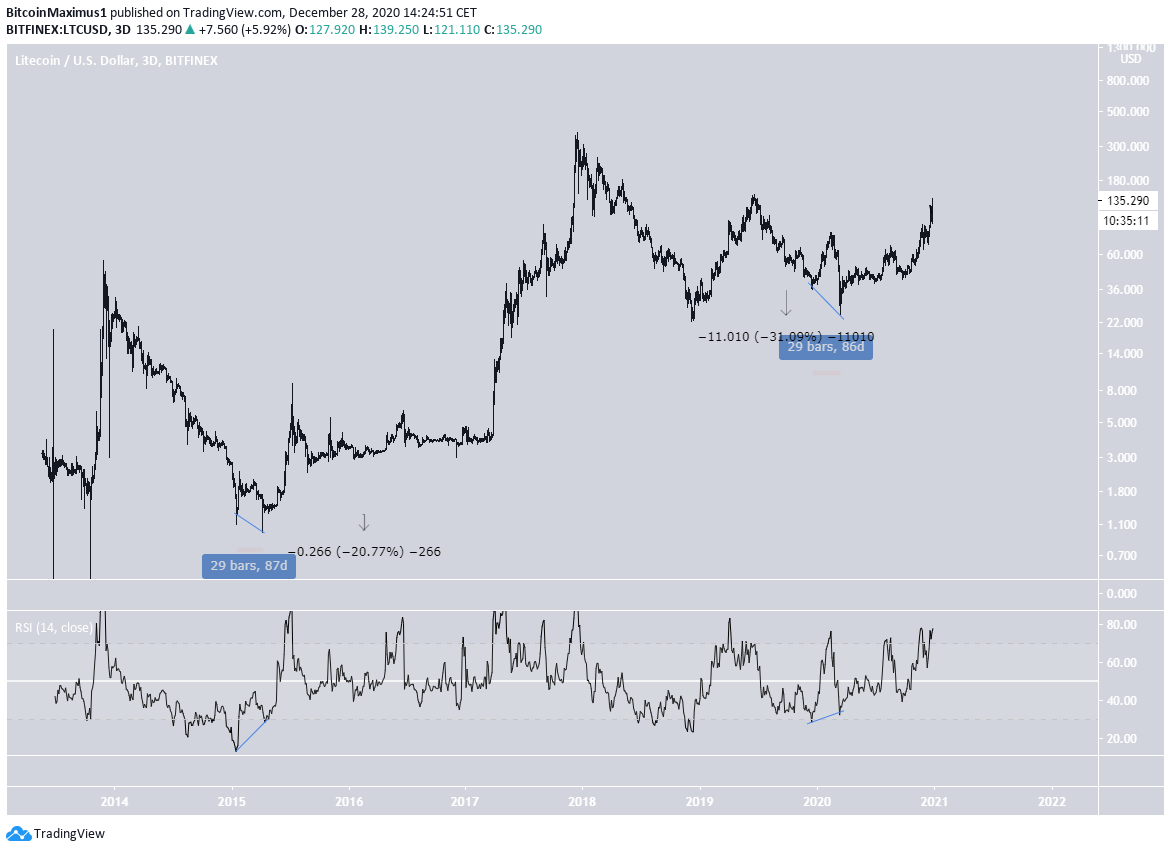
Using the same rate of time, we can find the date after the Jan 2015 bottom which correlates with Dec. 31, 2020, and use the rate of price change in order to determine the correct price.
After doing this, we arrive at a price of $165 for LTC on Dec. 31, 2021.
Litecoin Price Prediction 2025
Due to the fact that the January 2015 bottom occurred more than five years ago, we can continue using the same method in order to predict the price at the end of December 2025.
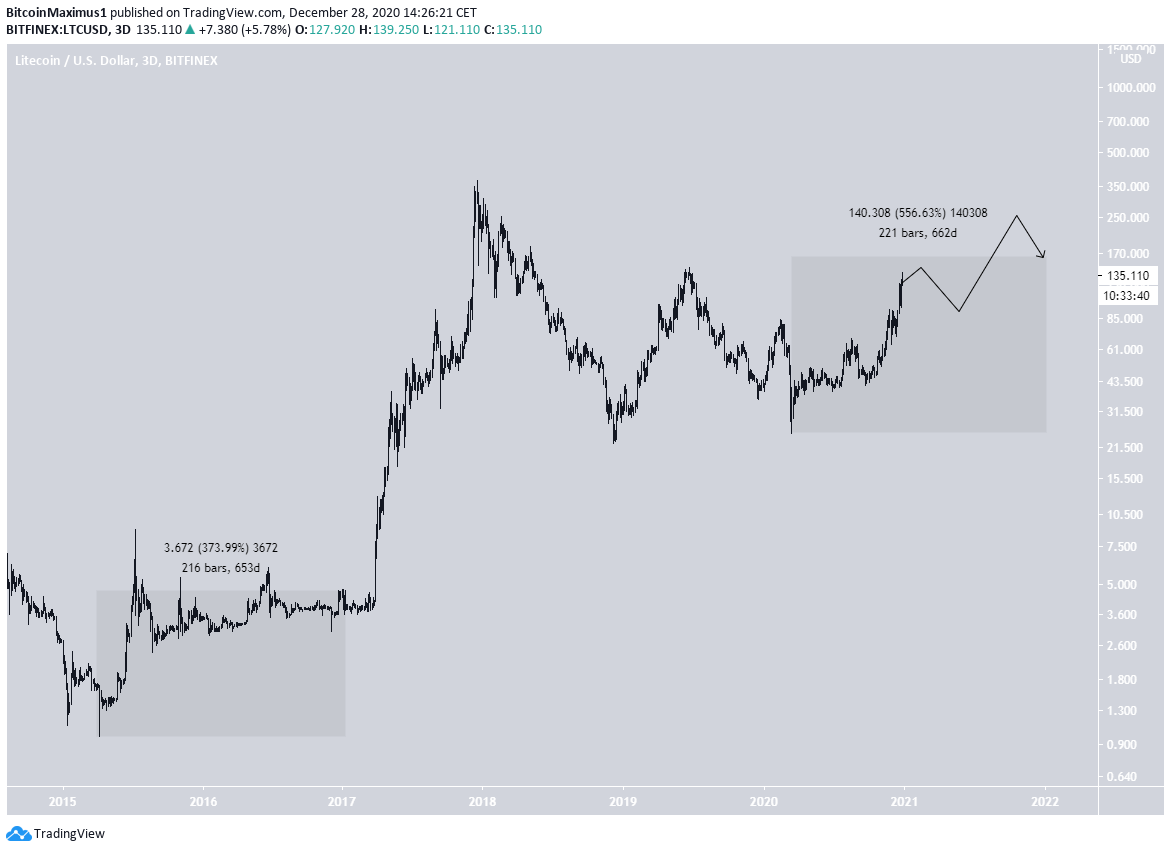
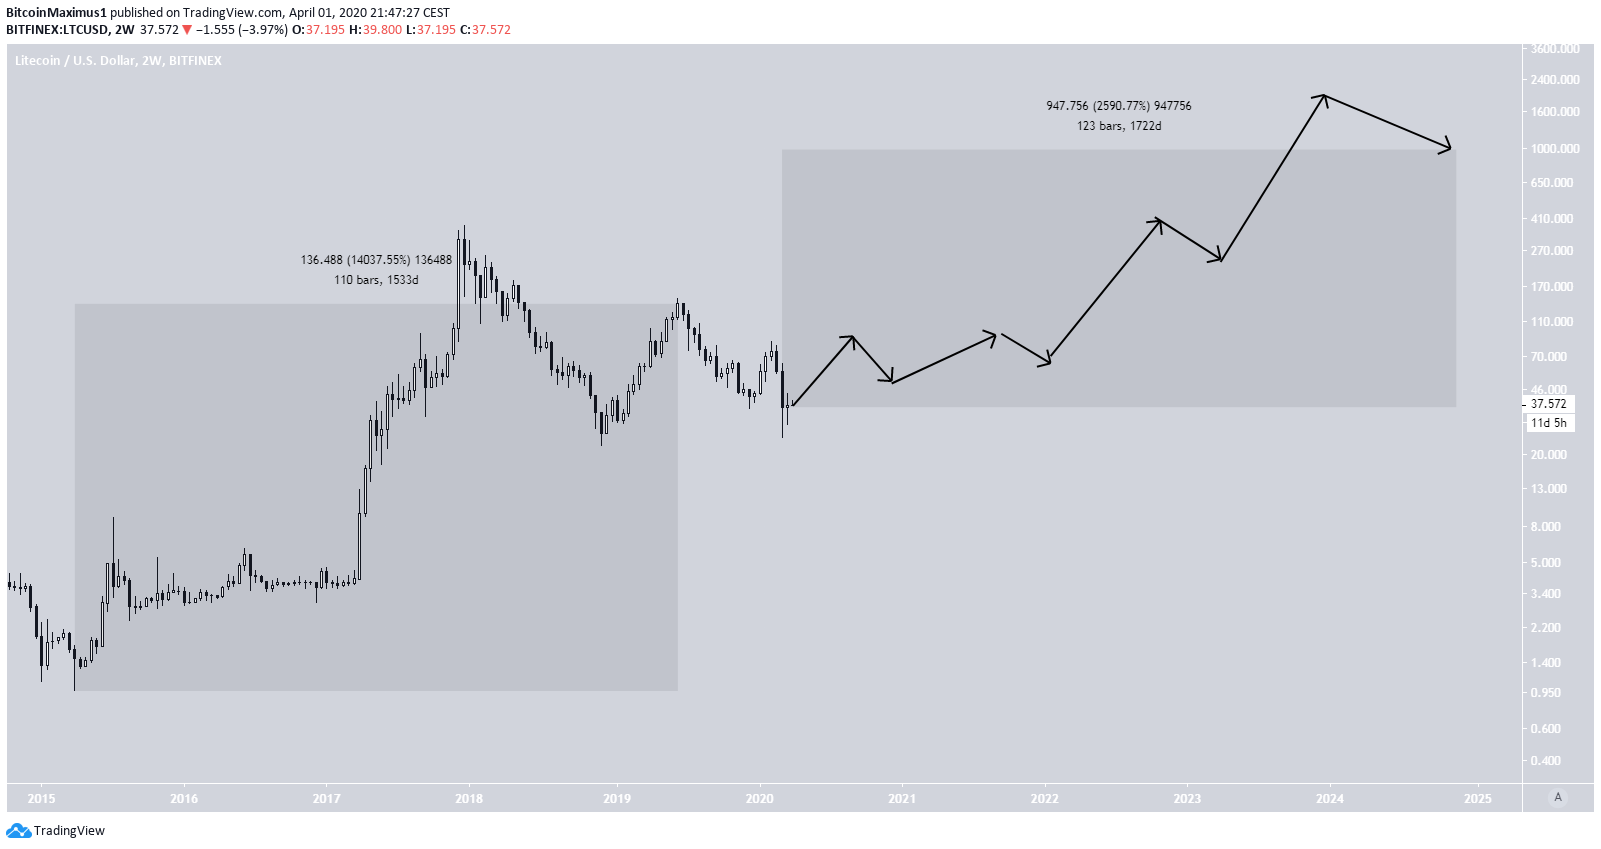
Doing so, we arrive at a high of $990 on December 31, 2025. However, prior to this price, LTC is expected to reach an all-time high of $1900 in December 2023.
The projected price movement is outlined in the image below.
Conclusion
The following Litecoin forecasts are made assuming that the Litecoin price is going to follow the pattern we have laid out due to numerous similarities between the price movement in January 2015 and March 2020.
The LTC price predictions are as follows:
- The price is expected to reach a high of $51 on December 31, 2020.
- The price is expected to reach a high of $165 on December 31, 2021.
- The price is expected to reach a high of $990 on December 31, 2025.
- The price is expected to reach an all-time high of $1900 in September 2023.
Until these prices are validated, we cannot consider the patterns we have defined as accurate indicators of future prices. Validation of these prices, however, would also validate the accuracy of the method we have used to arrive at our predictions. At the end of 2021, we will return to these predictions to assess whether the pattern appears to be holding true or not.
[Disclaimer: The contents of this article are not intended as financial advice, and should not be taken as such. BeInCrypto and the author are not responsible for any financial gains or losses made after reading this article. Readers are always encouraged to do their own research before investing in cryptocurrency, as the market is particularly volatile.]


