


On Mar 16, 2019, the price of Litecoin (LTC) reached a high of nearly $64. It reached a higher high on Mar 18. Then there were sudden losses. Should we expect lower prices for Litecoin soon?
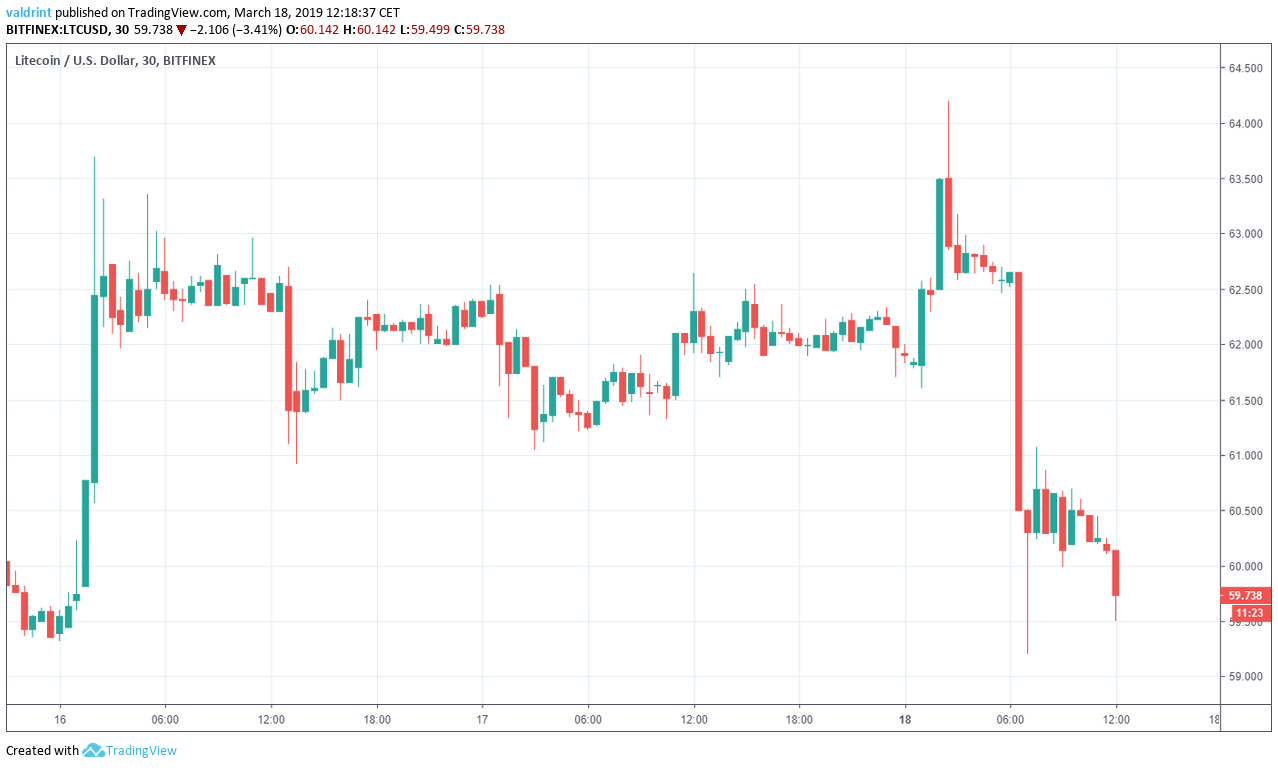
To answer this question, let’s begin by looking at Litecoin’s prices between Mar 16 and Mar 18:
In our Mar 13 Litecoin analysis, we predicted that the price of LTC reached its top and that it would break down within the next several days. We also suggested that this breakdown would result in rapid price decreases.
However, on Mar 16, the price made an unsuspected spike and reached new highs. It reached a higher high on Mar 18. Nonetheless, this did not necessarily invalidate our prediction since prices have since been on a steady downtrend with rapid price decreases now evident.
Based on today’s analysis, we believe that LTC has reached or is close to reaching its top and that further price decreases are still forthcoming.
Key Highlights For March 18
- The price of Litecoin (LTC) has been on a downward trend since Mar 16.
- LTC has been trading inside a short-term horizontal channel.
- LTC is trading inside a medium-term ascending wedge.
- It appears as if there is bearish divergence in the RSI and the MACD.
- There are resistance areas near $60 and $70.
- There are support areas near $50, $42 and $32.
Tracing Resistance
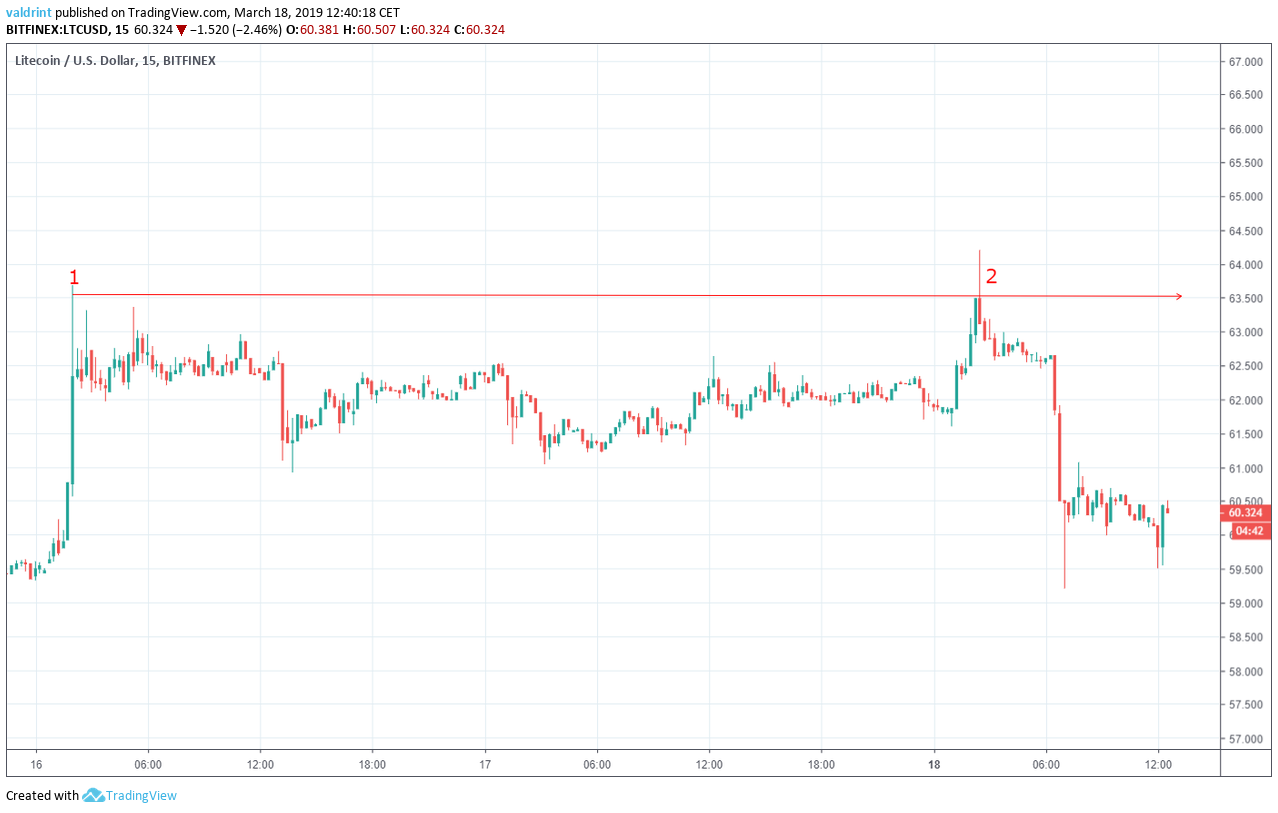
The price of LTC on Bitfinex was analyzed at 15-minute intervals from Mar 16 to Mar 18. The price reached Mar 16 high of $63.688 before reaching a higher high of $64.20 on Mar 18. Tracing these highs gives us a horizontal resistance line.
The first high was followed by a gradual downward move. However, the second high by a preliminarily gradual decline in price before more significant price decreases caused LTC’s price to drop below $59 within an hour. At the time of writing Litecoin was trading around $60—with recurring dips below this level.
The resistance line acts as a ceiling to price, preventing further upward movement. It theoretically traces the upper limits of the price.
Movement above this line is unlikely unless a breakout occurs. Wick breakouts such as the one on Mar 18 can be considered insignificant since they are not supported by continuous gains.
The resistance line alone is not sufficient in predicting when/if a break out will occur.
Horizontal Channel
The price reached a low of $60.921 on Mar 16. It revisited the same level on Mar 17. Tracing these lows gives us a horizontal support line.
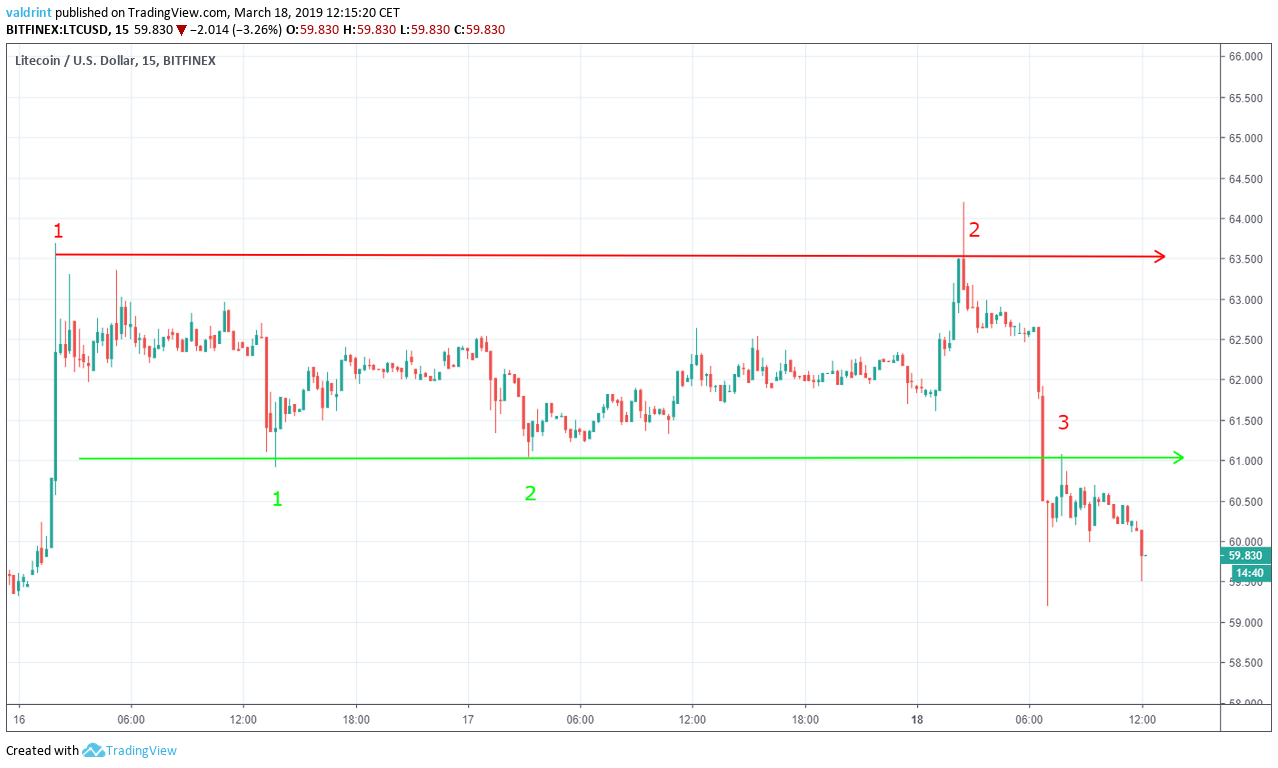
Similar to the resistance line, the support line can act as a floor to price, preventing further downward movement.
The support and resistance lines combine to create a horizontal channel. This is generally a neutral trading pattern. Price is typically expected to fluctuate between the support and resistance.
However, the breakdown below the support by Litecoin on Mar 18 is noteworthy. At the time of writing, the price remains below the support. In such an instance, support can become resistance. It is yet unclear if this is the case with Litecoin.
However, if prices continue trading below the support, it is likely that new support and resistance lines will emerge. These might change the overall trading pattern of Litecoin or generate a new horizontal channel.
RSI Divergence
The price of LTC is analyzed at one-hour intervals from Mar 5 to Mar 18 along with technical indicators in an effort to determine possible new support and resistance lines.
Price made a Mar 4 low of $47.75. It has continued making higher lows since. Tracing these lows gives us an ascending support line.
Price made a Mar 7 high of $59.01. It has continued to create higher highs since. Tracing these highs gives us an ascending resistance line.
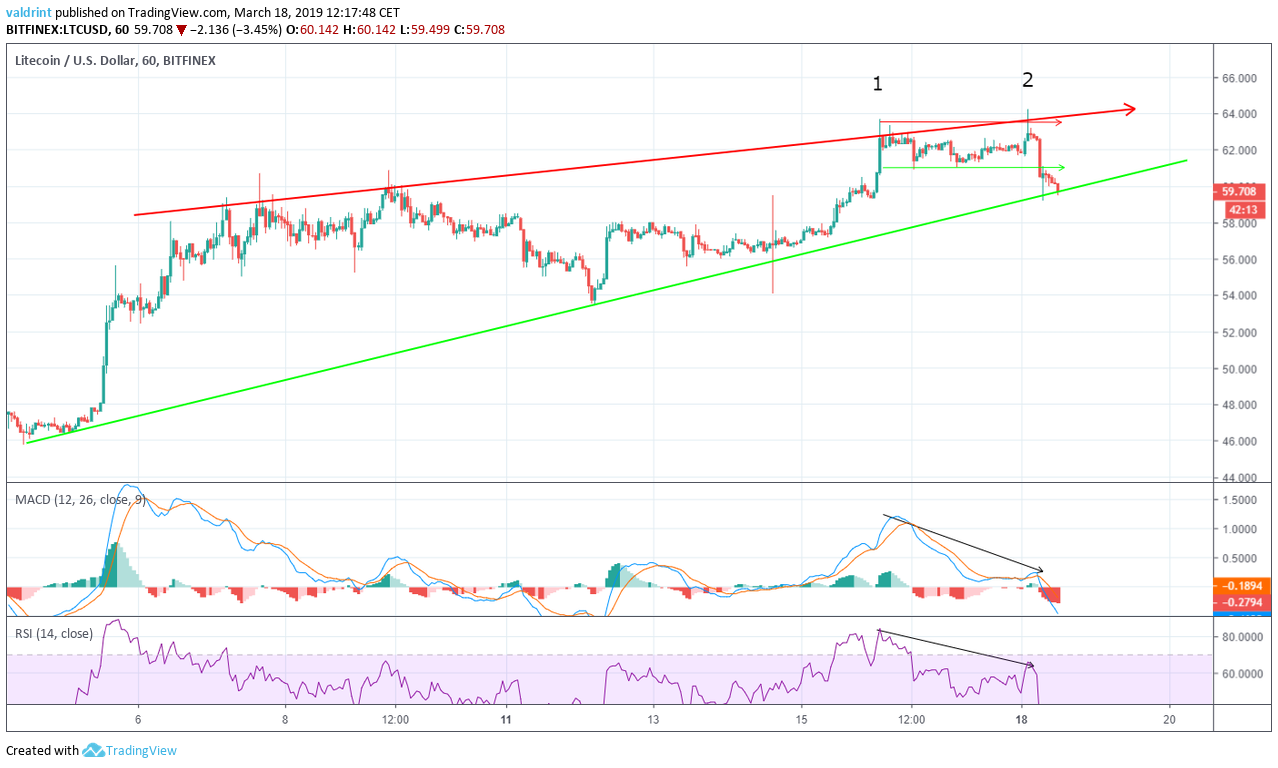
The support and resistance lines combine to create an ascending wedge, which is a bearish pattern, making price decreases more likely.
Combining moving average convergence divergence (MACD) and relative strength index (RSI) bullish/bearish divergence with support/resistance essentially predicts price fluctuations.
The MACD is a trend indicator that shows the relationship between two moving averages (long and short-term) and the price. It is used to measure the strength of a move. The RSI is an indicator which calculates the size of the changes in price in order to determine oversold or overbought conditions in the market.
LTC reached a high on Mar 16 and a higher high two days later. The RSI and the MACD made a high on Mar 16 that was higher than that on Mar 18.
This is called bearish divergence and often precedes drops in price. It is especially effective if bearish divergence occurs in a bearish pattern—as is the case with Litecoin.
Using these indicators and pattern, it is likely that the price of LTC eventually breaks down from the ascending wedge. Continued price decreases are to be expected.
Future Movement
The price of LTC on Bitfinex was analyzed at six-hour intervals from June 2018 to Mar 13, 2019, in order to better visualize potential reversal areas.
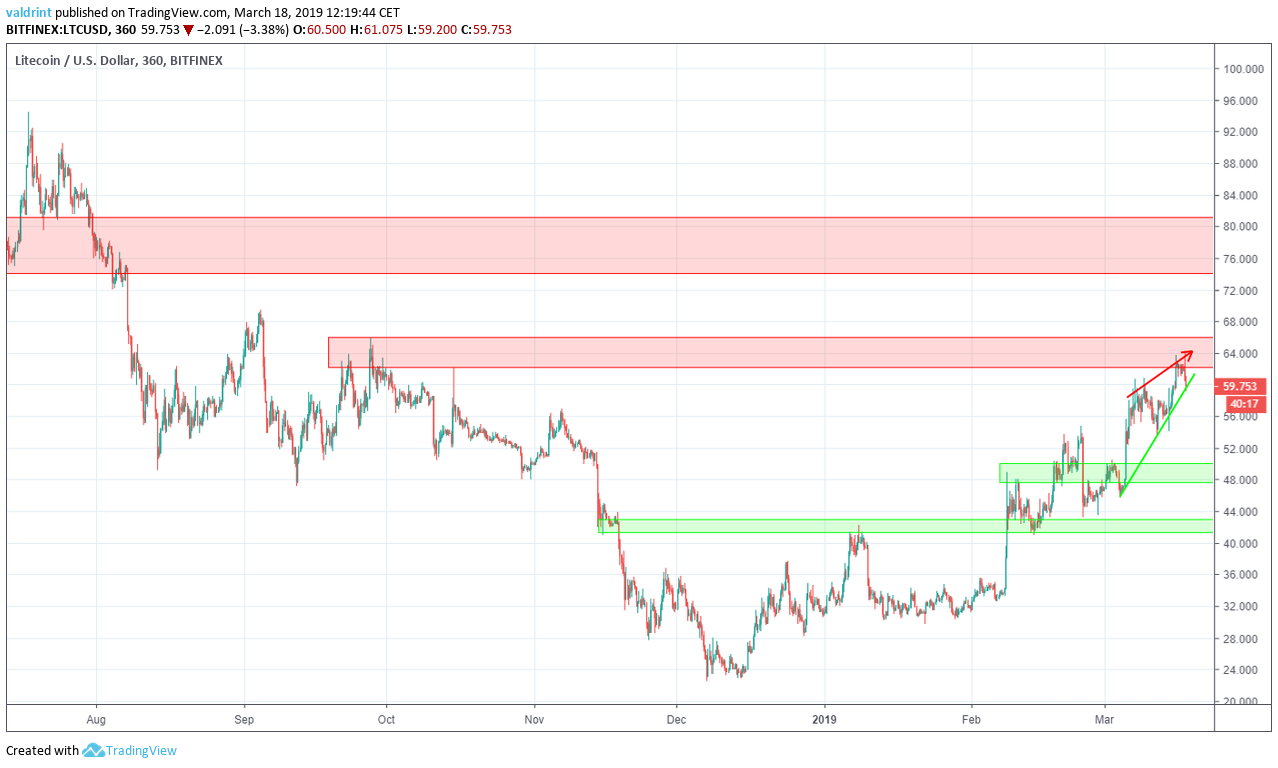
Resistance and support areas are formed when the price reaches a certain level several times. They can act as a ceiling/floor that prevents the price from moving further in that direction.
The current resistance area is found between $57-$60 where price is currently trading. If price were to break out from the wedge, the second resistance area can be found near $70. Based on our current analysis, this is unlikely. However, given the rapid increases in price which have occurred for LTC so far in 2019, this situation cannot be entirely ruled out.
The closest support area is found near $48, followed by areas near $42 and $30. We believe that the price will reach at least one of these areas.
Summary Of Analysis
Based on this analysis, it is unlikely that the price breaks out from the wedge. It is possible that the price drops to the support line and initiates a small bounce before ultimately breaking down. If the price begins to decrease in value without significant increases over $63 the prediction will be partially validated. If it breaks down from the support line, it will be fully validated. However, a significant price increase in which prices again touch $63 would seem to invalidate our current projection.
Do you think the price of LTC will finally break down from the wedge? Let us know in the comments below.
Disclaimer: This article is not trading advice and should not be construed as such. Always consult a trained financial professional before investing in cryptocurrencies, as the market is particularly volatile.


