


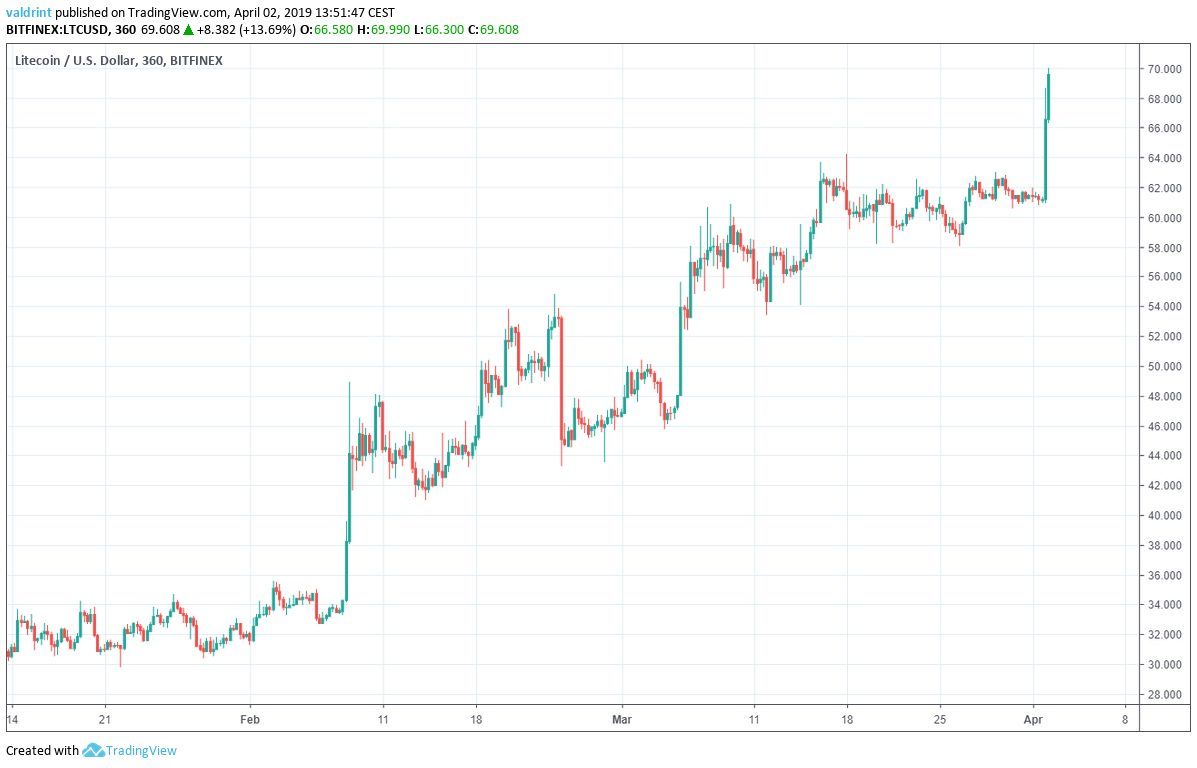
On Jan 14, 2019, the price of Litecoin (LTC) was trading at $30. A sharp upward move was initiated on Feb 18. This took Litecoin to a high of $48.90.
Since then, the price has been alternating between gradual decreases and sharp increases. One such increase occurred on Apr 1.
At the time of writing on Apr 2, Litecoin just missed the $70 mark with a high of $69.99.
Bitcoin (BTC) also faced a rapid rise as April began. After struggling to maintain $4000 throughout March, Bitcoin jumped to over $5000 on Apr 2. Other coins including XRP and Ethereum saw similar rises.
Litecoin (LTC): Key Trends And Highlights
- The price of LTC/USD began an uptrend Jan 14.
- Price increases accelerated on Feb 8.
- Litecoin has been trading inside an ascending wedge ever since.
- It is also trading above the daily moving averages.
- There is bearish divergence developing in the RSI and the MACD.
Ascending Wedge
On Feb 6, Litecoin reached a low of $32.60. A sharp increase was followed by a gradual decrease.
Tracing the lows during this period gives us an ascending support line.
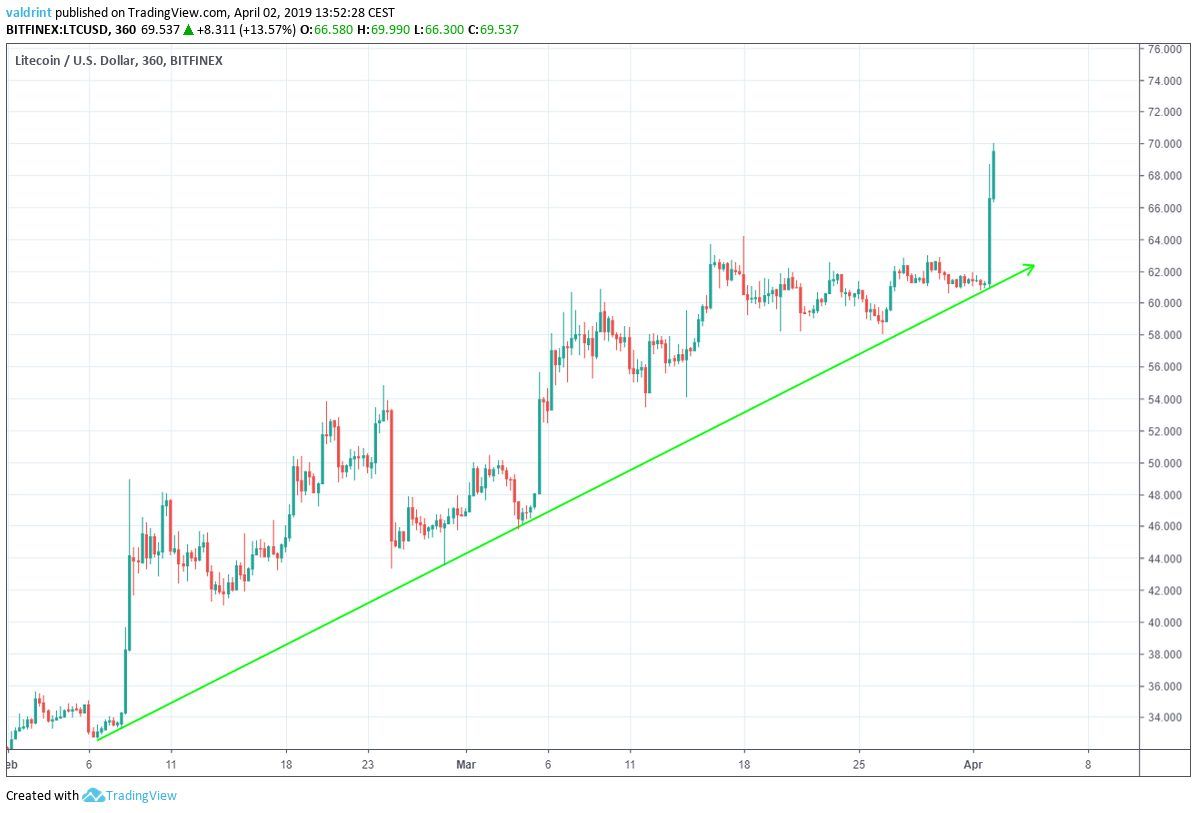
On Feb 8, the price reached a high of $48.90. Several market cycles have been completed since, with each high being higher than the preceding one.
Tracing these highs gives us an ascending resistance line.
Together, support and resistance trace an ascending wedge:
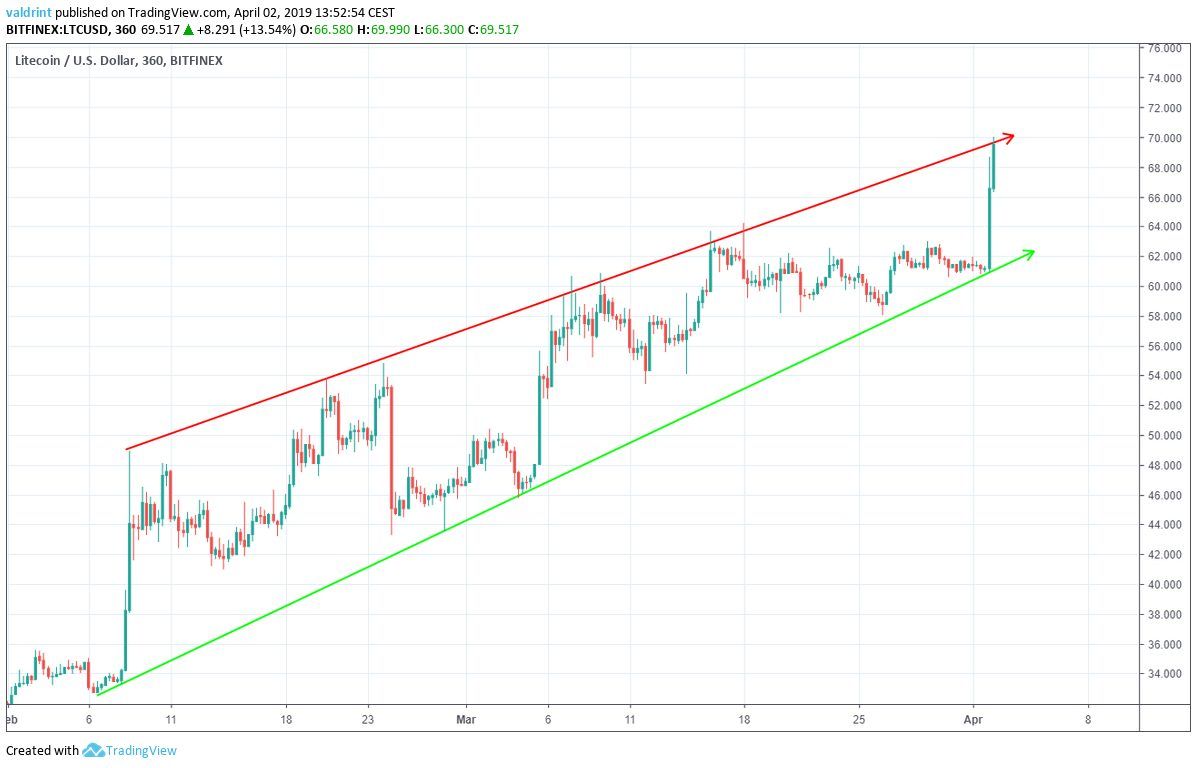
This is a bearish pattern. It suggests likely price decreases.
Future losses in the near future may be forthcoming based on this pattern and the recent spike. If Litecoin begins decreasing in price, the period of decline might mark a corrective period for the price.
Moving Averages
The price of LTC on Bitfinex is analyzed at one-day intervals from Jun 2018 to Apr 2019 in order to better visualize possible areas of resistance. Moving averages and resistance areas are incorproated into this part of the analysis to assist us.
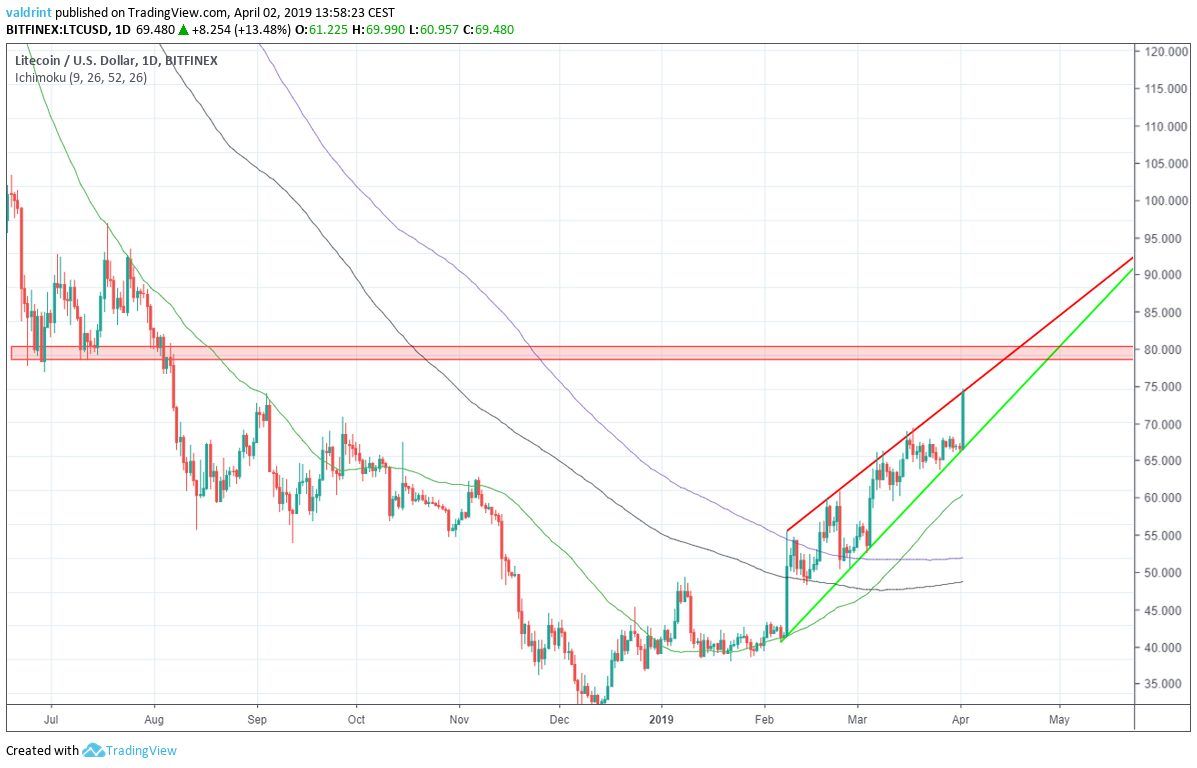
On Feb 7, the price moved past the 100-day moving average (black). On Feb 18, it proceeded to move past the 200-day MA (purple). Therefore, there is no resistance left provided by the moving averages.
It is also worth noting that Bitcoin’s recent spike pushed past all three levels of resistance as well.
Nonetheless, Litecoin faces significant resistance area near $80. This level was created by the lows of July 2018.
Possible Divergence
To better assess possible prices in April, we incorporate MACD and RSI into this part of the analysis.
Combining MACD and RSI bullish/bearish divergence with support/resistance essentially predicts price fluctuations.
They are seen alongside Litecoin’s current trading pattern in the graph below:
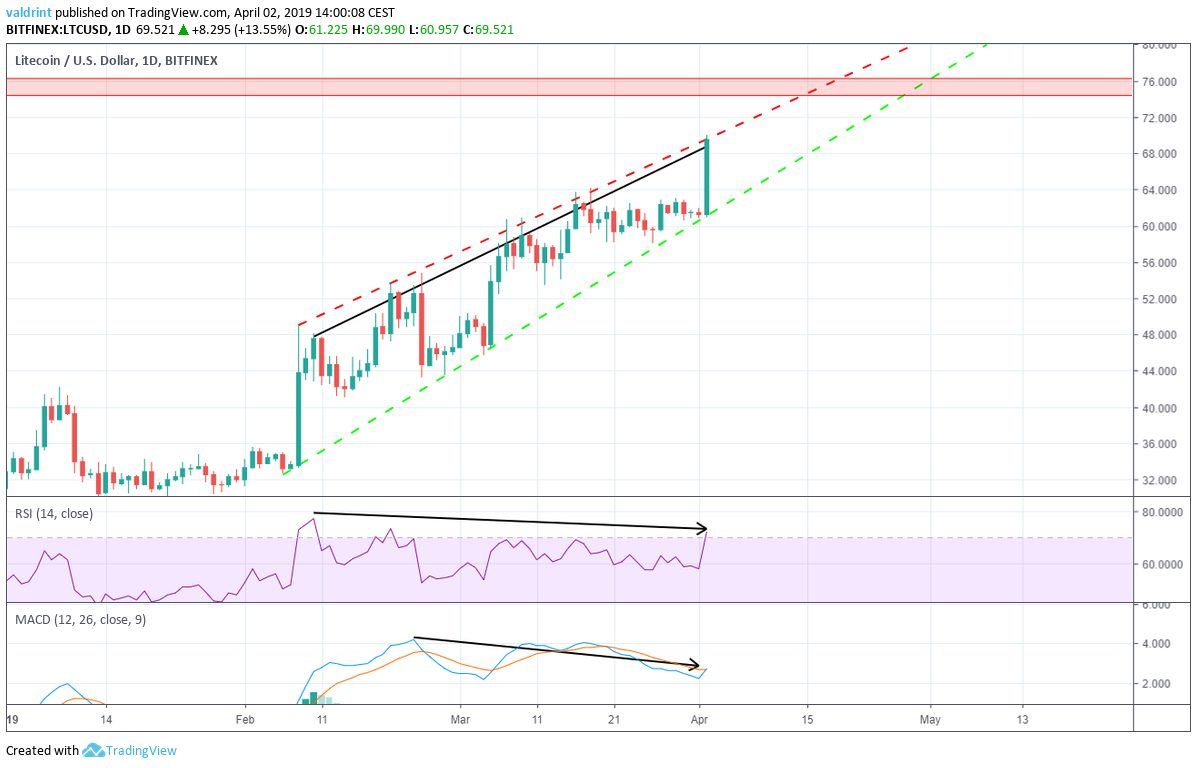
On Feb 10, the price reached a high of $48.10. Since then, it has continued to increase.
Similarly, the RSI reached the first high on Feb 10. The MACD followed eight days later. However, both have proceeded to generate lower values since.
This is known as bearish divergence and often precedes price decreases.
Based on these indicators, and the creation of a bearish pattern, we do not believe LTC has enough strength left to break out from the ascending wedge. Therefore, it is likely that the price will keep increasing at the rate predicted by the wedge, until it eventually breaks down.
April Price Prediction And Summary
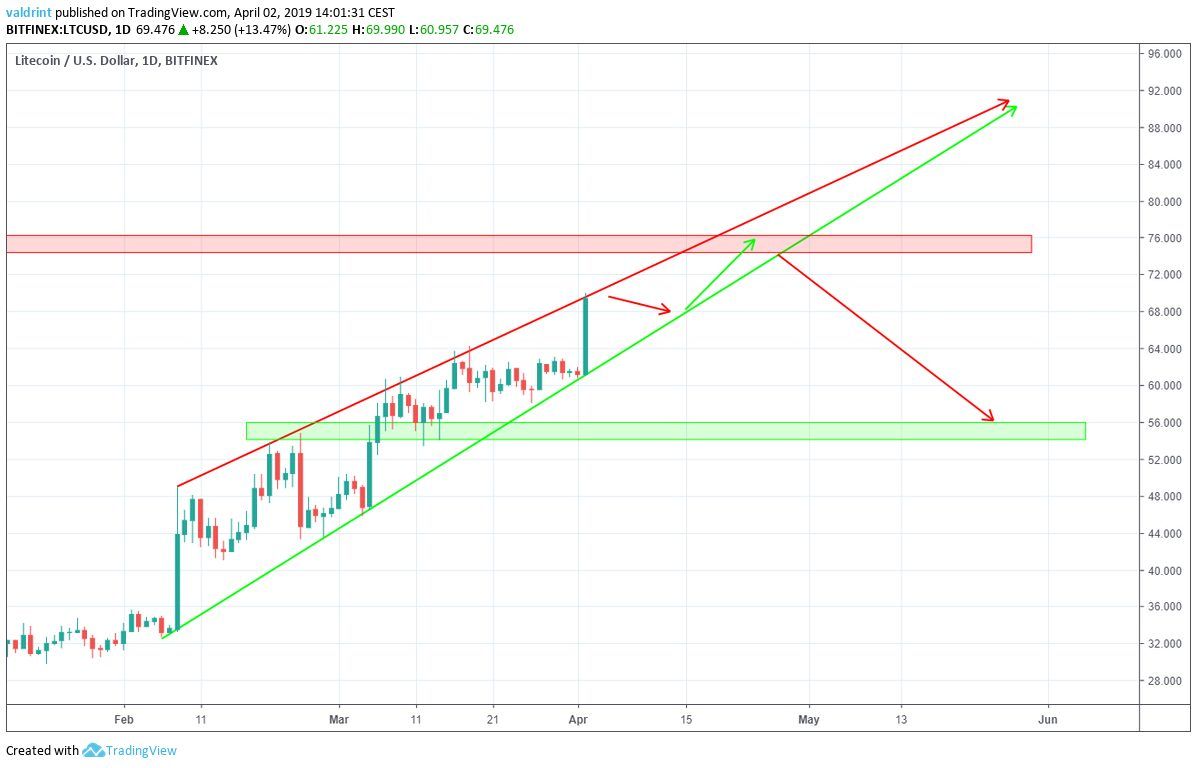
The closest support area is found near $55 Continuing from the conclusion in our previous section, we believe that the price of LTC will eventually break down from the wedge and reach this level
A breakdown or breakout will become inevitable at the point of of convergence between resistance and support. This is projected to occur on May 26.
We believe that the breakdown will occur much sooner—likely before the end of April. Furthermore, we predict that after reaching this level, Litecoin will continue trading between $55 and $65.
Do you think the price of LTC will eventually breakdown? When will that happen? Let us know your thoughts in the comments below!
Disclaimer: This article is not trading advice and should not be construed as such. Always consult a trained financial professional before investing in cryptocurrencies, as the market is particularly volatile.


