


The Litecoin (LTC) price is making its fourth attempt at breaking out from a crucial resistance area. Since resistances weaken each time they are touched, an eventual breakout seems likely. Can the LTC price push toward $130 after successfully testing $100?
Besides the price action, the wave count and RSI reading are both bullish, increasing the likelihood that the breakout will be successful.
Is Litecoin Ripe for Continuation?
The weekly time frame technical analysis for LTC gives a mostly bullish outlook. There are numerous reasons for this.
Firstly, the LTC price has traded inside an ascending triangle since the end of May 2022. The ascending triangle is considered a bullish pattern. As a result, a breakout from it is the most likely future price scenario.
Next, the LTC price has made several attempts at breaking out from the $100 resistance area. This makes a breakout more likely since resistances weaken each time they are touched. Currently, it has broken the $100 resistance. However, it still needs to hold and flip this into support.
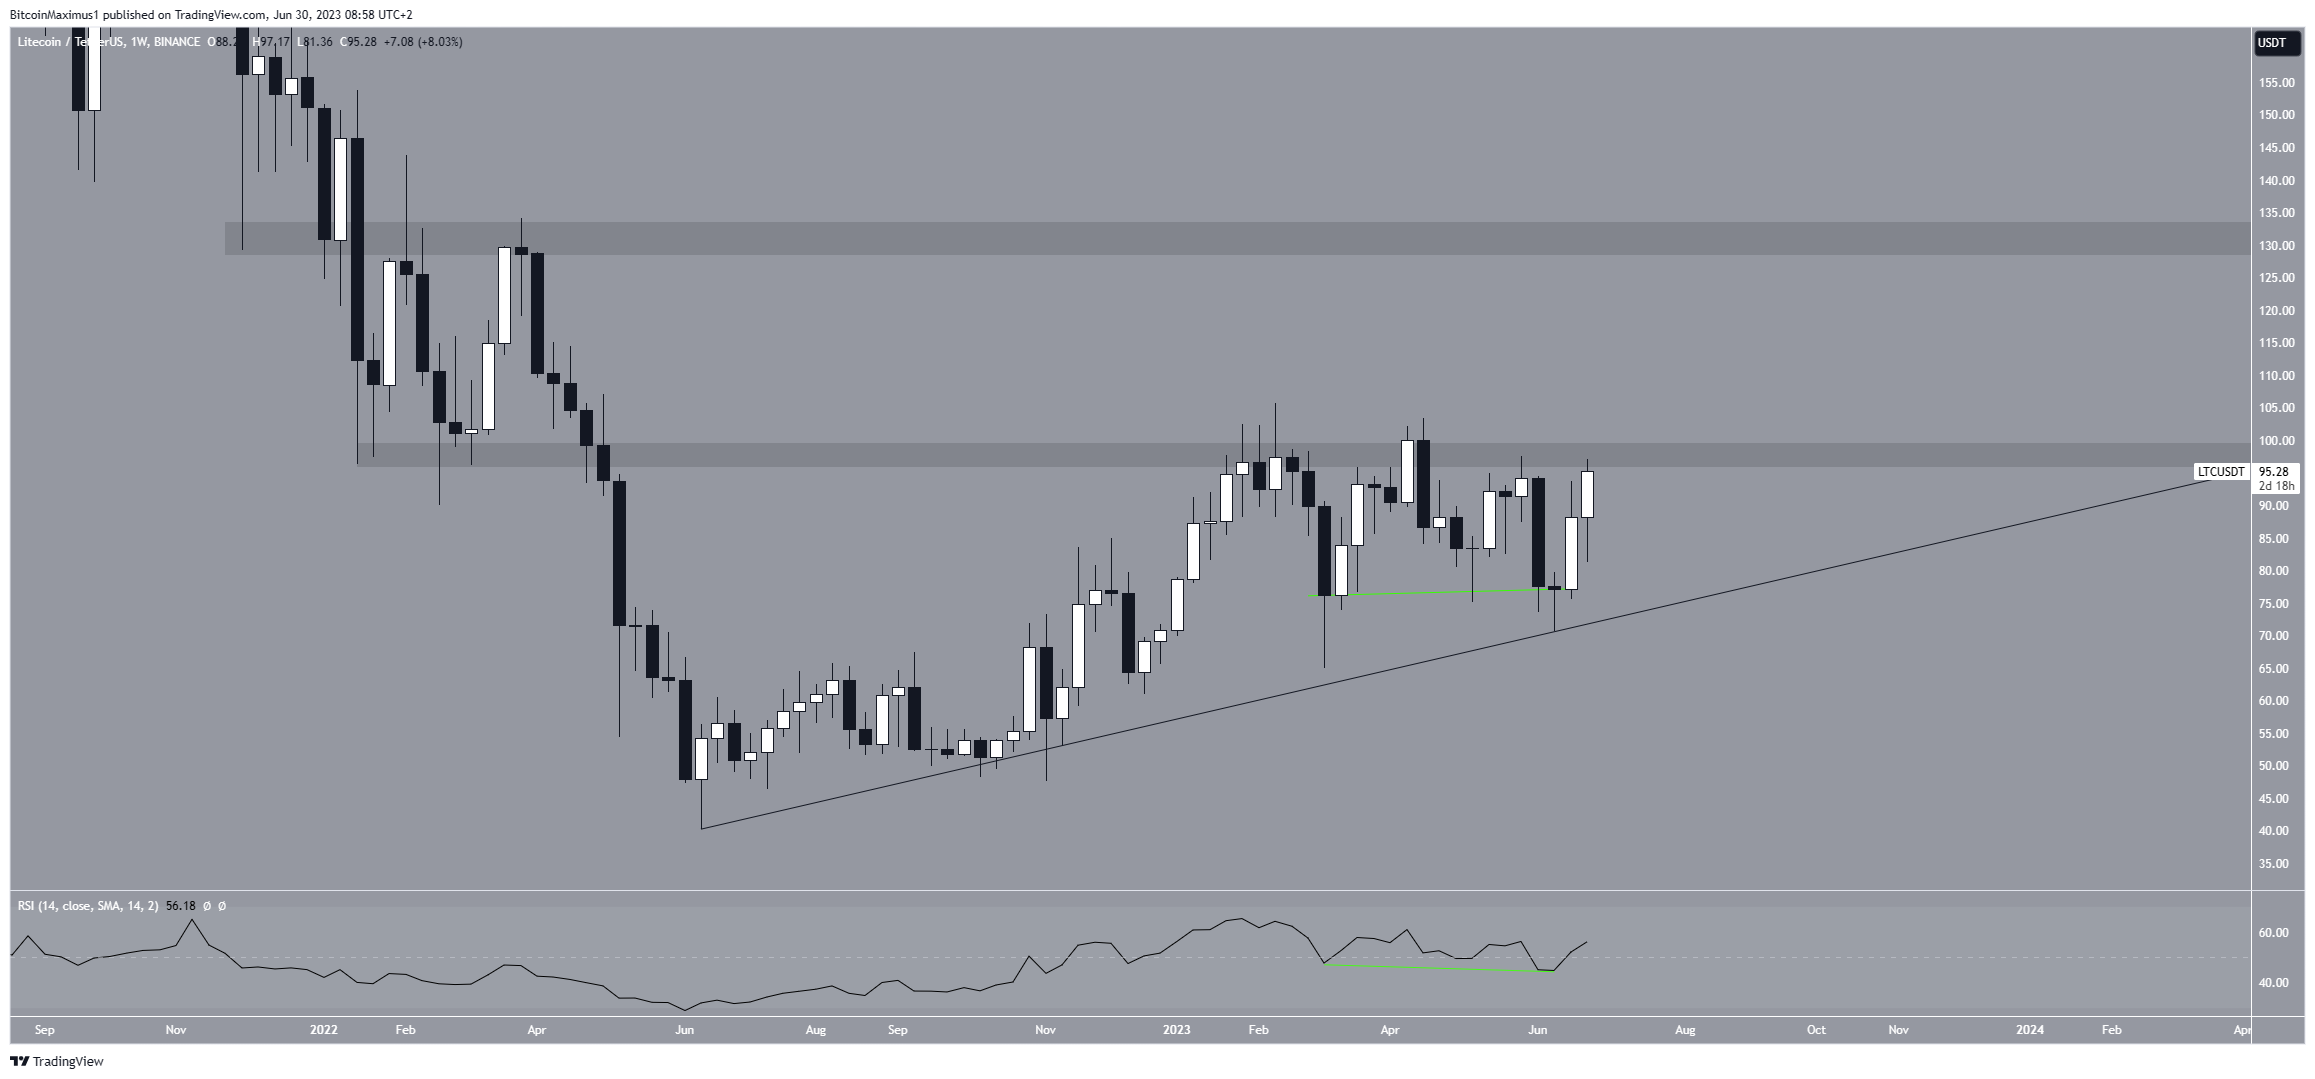
Finally, the weekly RSI is leaning bullish. With the RSI as a momentum indicator, traders can determine whether a market is overbought or oversold and decide whether to accumulate or sell an asset.
Bulls have an advantage if the RSI reading is above 50 and the trend is upward, but if the reading is below 50, the opposite is true. The indicator is above 50 and increasing. Moreover, it has generated a hidden bullish divergence (green line).
This is a type of bullish continuation pattern in which a momentum decrease accompanies a price increase. It often leads to the continuation of the preceding trend, which in this case, is bullish.
Read More: 9 Best Crypto Demo Accounts For Trading
LTC Price Prediction: Wave Count Suggests Price Will Reach New Yearly High
A closer look at the daily time frame analysis gives a decisively bullish outlook, mostly because of the wave count.
Technical analysts employ the Elliott Wave theory as a means to identify recurring long-term price patterns and investor psychology, which helps them determine the direction of a trend.
The most likely wave count suggests that the LTC price is in wave three (white) of a five-wave increase. Wave three is usually the largest and sharpest of the five waves. As a result, the rate of increase is likely to accelerate soon if the count is correct.
The shape of the corrective wave two (highlighted) aligns perfectly with the count. This is especially evident in the 1:1 length of waves A:C (black).
The LTC price will soon break out if the count is correct and head to the next resistance level at $130.
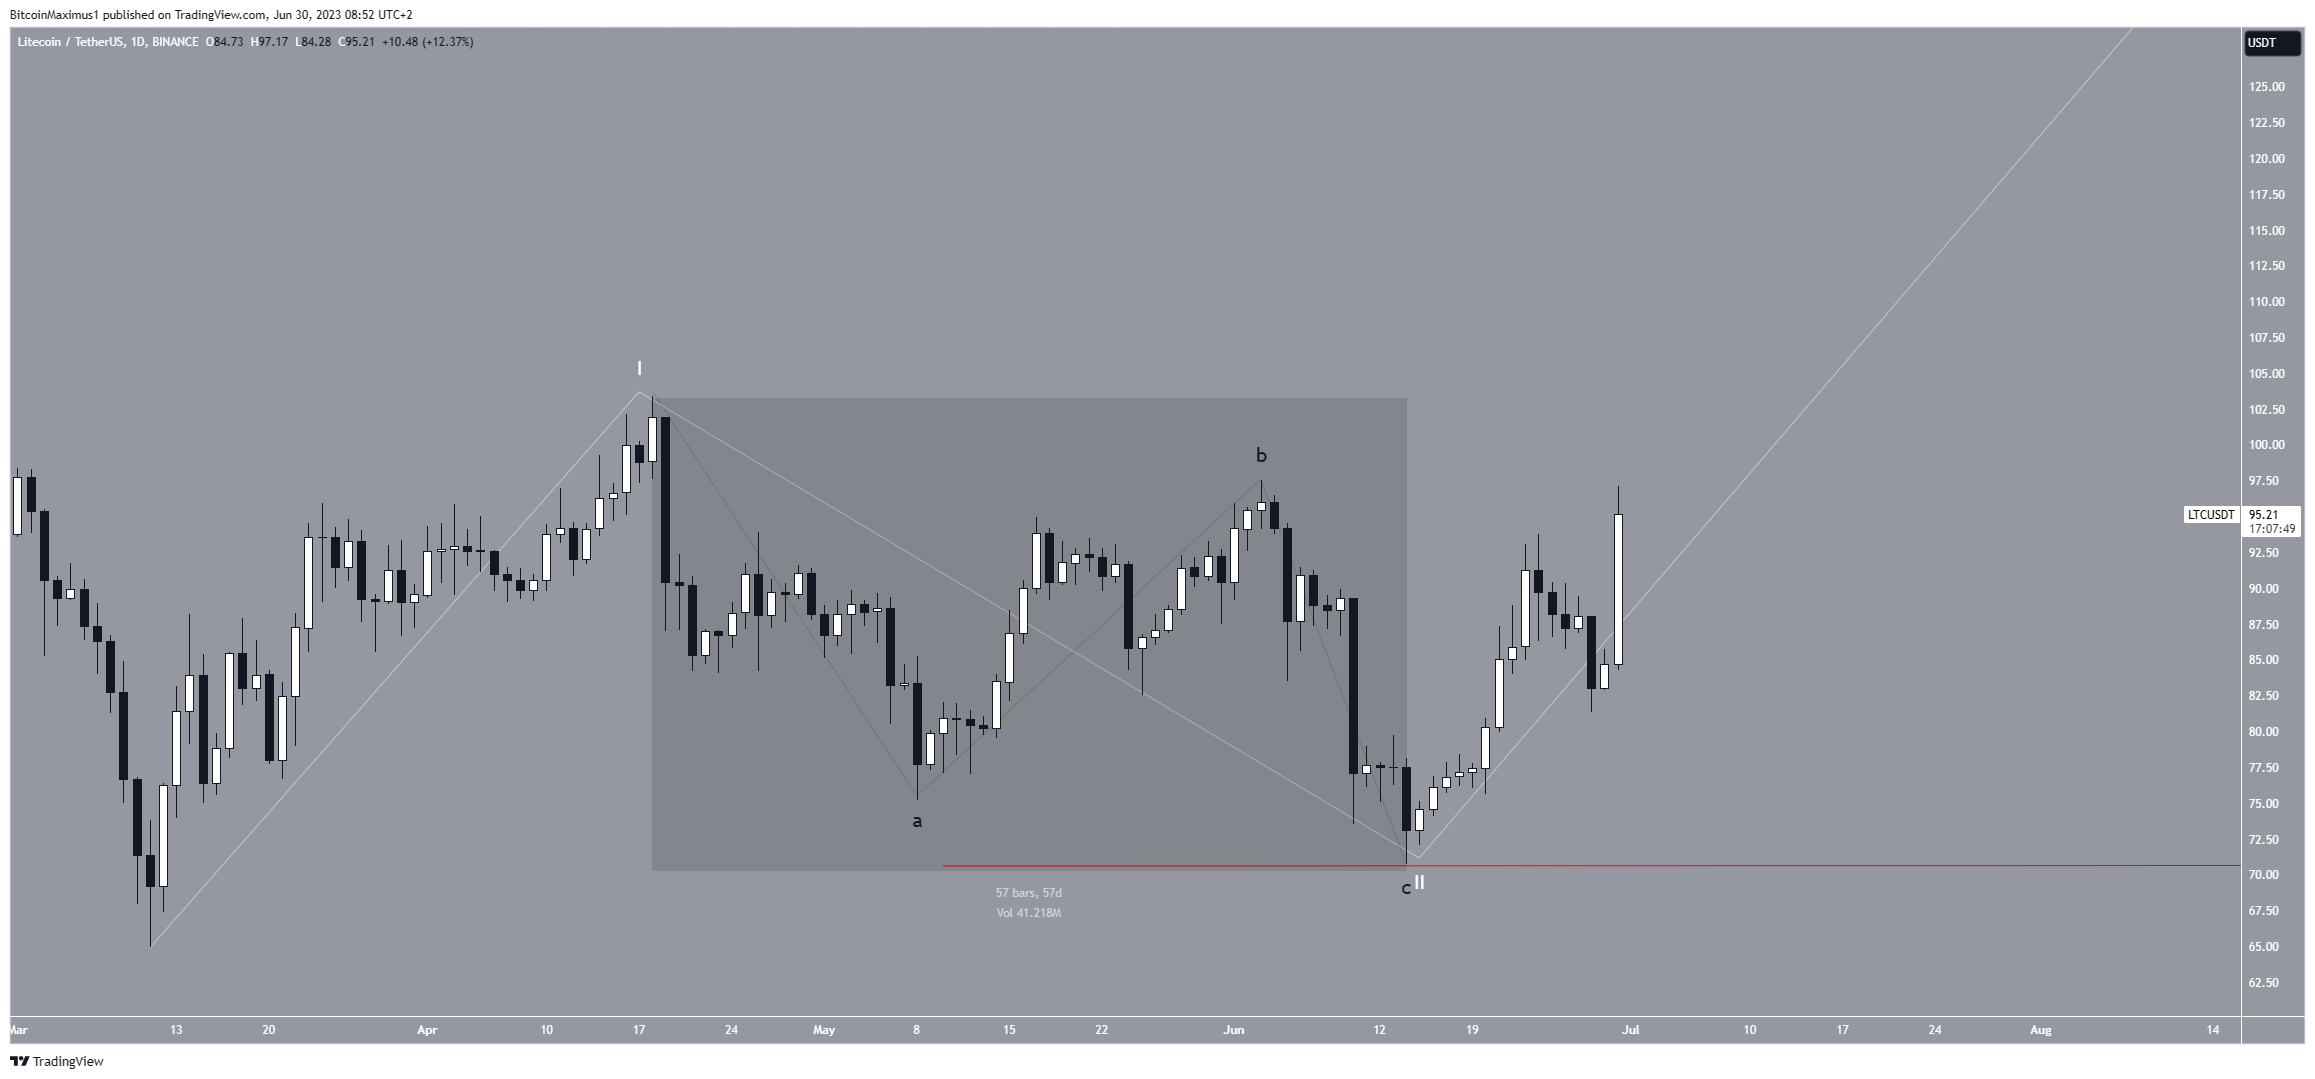
Despite this bullish LTC price prediction, falling below the wave two low (red line) of $71 will mean that the trend is bearish. Since this drop will invalidate the bullish forecast, it could lead to a decrease to $50.
More From BeInCrypto: 9 Best AI Crypto Trading Bots to Maximize Your Profits
For BeInCrypto’s latest crypto market analysis, click here


