


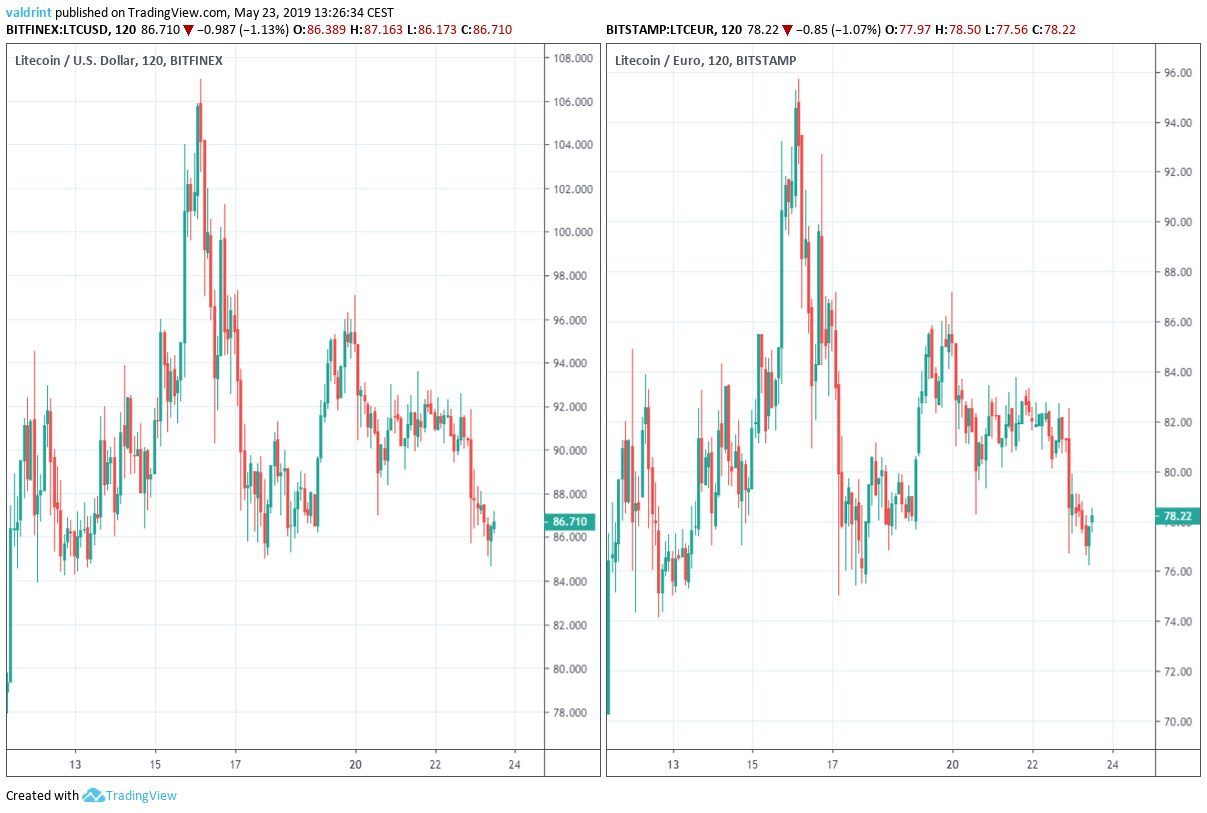
On May 16, 2019, the price of Litecoin peaked at $106.98/€95.7. A rapid decrease preceded a slight recovery between May 16 and 21.
However, prices were unable to break past the $100 mark before falling again. At the time of writing on May 23, it appeared as if prices were still falling.
In this analysis, we examine Litecoin’s trends and indicators to determine whether the price will likely continue falling or rebound.
Litecoin (LTC): Trends And Highlights For May 23, 2019
- Both LTC/USD and LTC/EUR have been on a downtrend since May 16.
- LTC has created a head and shoulders pattern.
- Bearish divergence has developed in the RSI and the MACD.
- There is support near $60/€55.
Falling From the Shoulder
On May 12, the price reached a low of $83.89. Several market cycles have since been completed. The price has reached the same level five times.
Tracing these lows gives us the horizontal support line outline below:
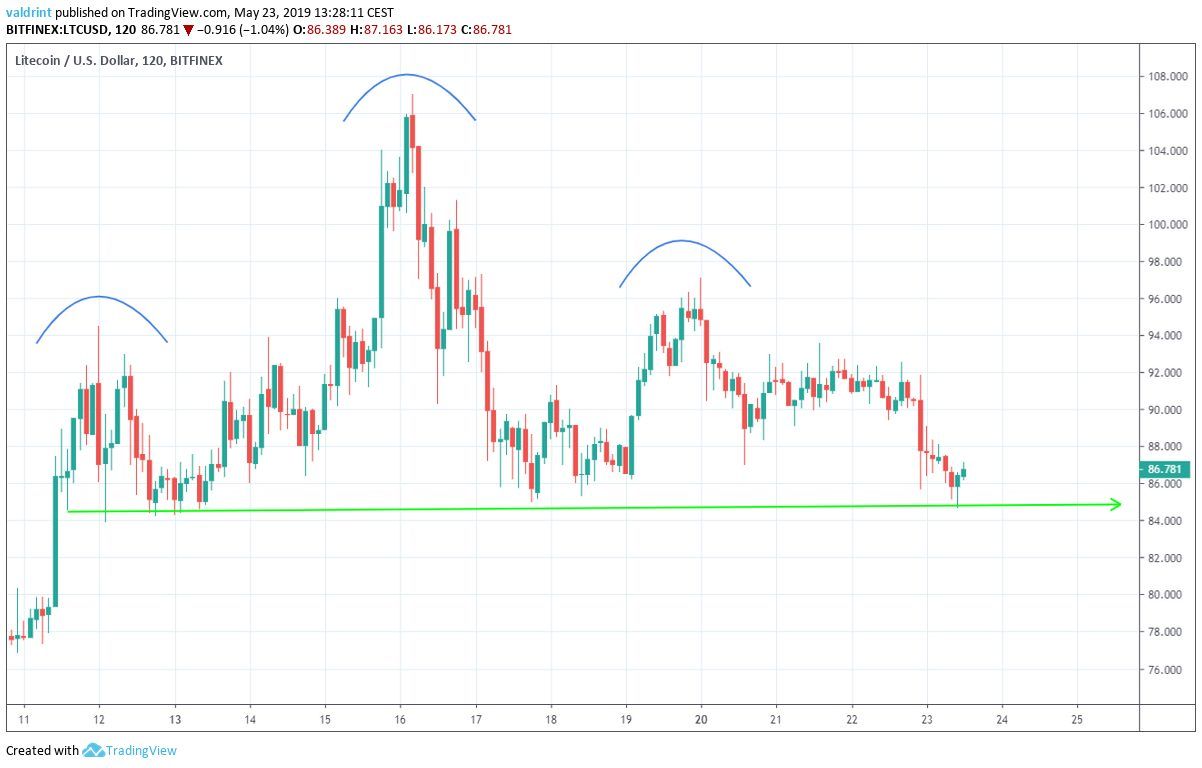
Furthermore, the highs of May 12, 16 and 20 appear to create a head and shoulders pattern. This is a bearish pattern and typically indicates future price losses.
After May 20, the price did fall—reaching the support line on May 23 and validating it for the fifth time. If price losses continue, a breakdown appears likely.
What About a Breakdown?
To better determine the likelihood of a breakdown, the price of LTC at daily intervals alongside the RSI and the MACD. Since Mar 10, Litecoin appears to have been trading above an ascending support line.
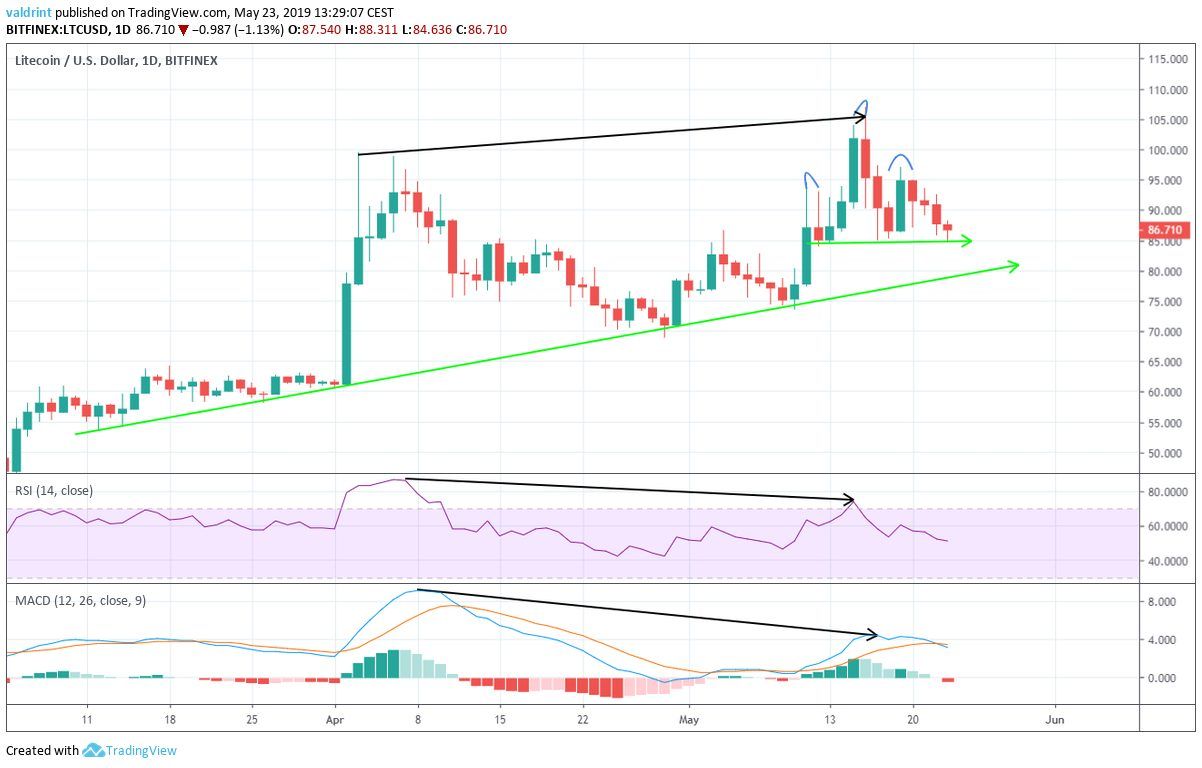 Bearish divergence is seen in both the RSI and MACD between Apr 3 and May 16. This indicates that future drops may still be in store. A breakdown from the short-term support line appears likely.
However, these indicators cannot adequately predict a breakdown from the long-term support line. It is possible that after reaching this line, the price of LTC will rebound.
Finding Long-Term Support
If the price does breakdown from the long-term support line, it may reach the support area outlined in the graphs below. In the first graph, a support area is traced for LTC/USD. A support area is also traced for LTC/EUR in the second graph.
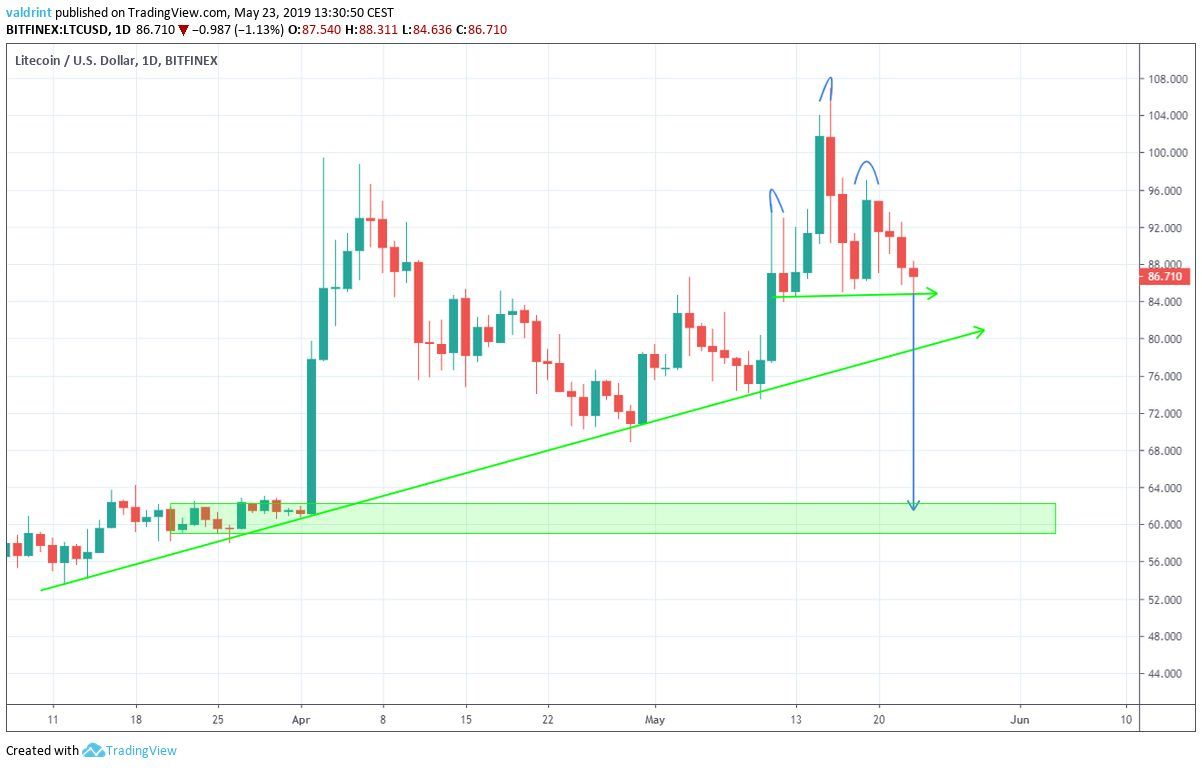
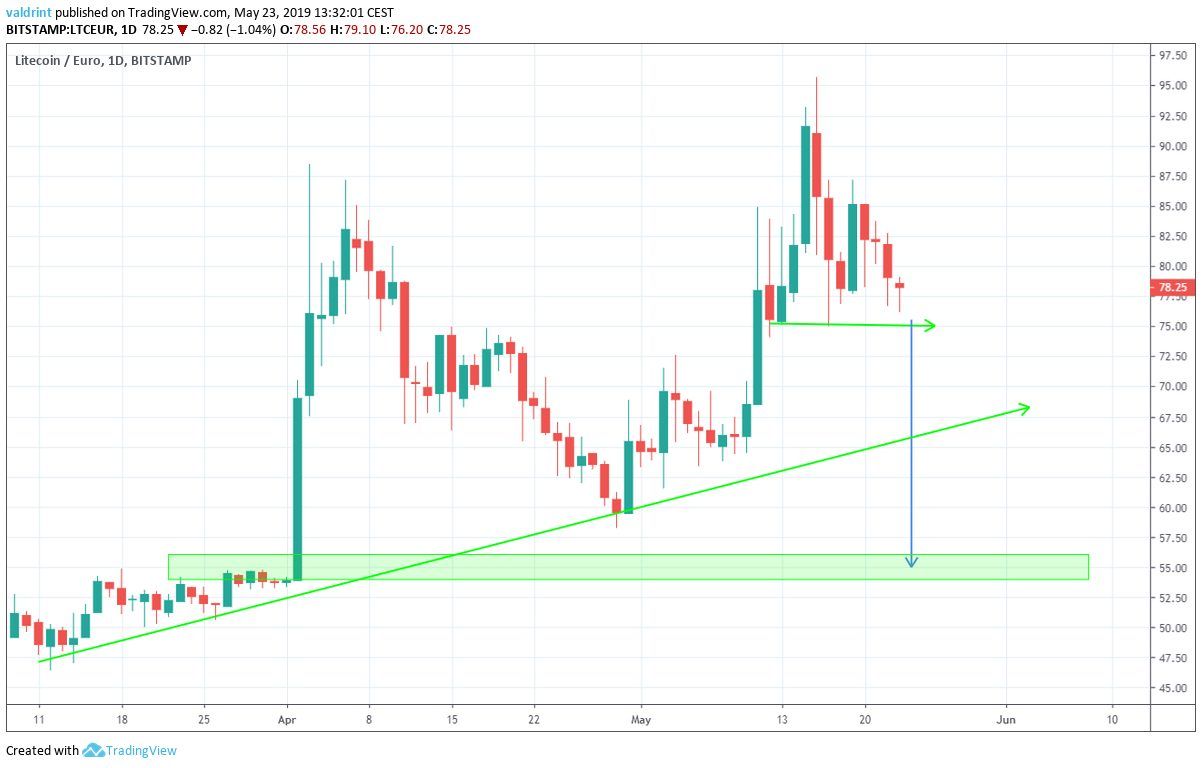
The vertical blue arrow measures the height from the top of the head and shoulders pattern to the support line. It is likely to provide a price target if a breakdown occurs.
Measuring from the support line, it gives a target of $60/€55. This coincides with the support area from the trading range in March.
If there is a breakdown from the long-term support line, we believe that Litecoin will drop to this area.
Summary Of Analysis
Based on this analysis, it is likely that the price will eventually break down from the head and shoulders pattern. It is likely to breakdown from a short-term support line and possibly a long-term one. If prices drop below the long-term support, LTC may drop to the psychological thresholds of $60 and €55.
Do you think the price of LTC will reach the support area? Let us know in the comments below.
If you’re interested in 2019 and 2020 price predictions for Litecoin in dollars, click on the blue button below
Disclaimer: This article is not trading advice and should not be construed as such. Always consult a trained financial professional before investing in cryptocurrencies, as the market is particularly volatile.


