


The Litecoin price has been decreasing since June, having lost 70% of its value measuring from the high. However, it is approaching a significant fib support level and could initiate an upward move within the next few months.
The fundamental outlook for Litecoin does not look very good, with the hash rate consistently falling. Also, this has caused the stock-to-flow model to predict a 0 value for Litecoin. On top of this, the technical outlook is not doing Litecoin any favors.
Full-time trader @coinzada stated that the Litecoin chart looks very bearish and has been decreasing since June.
Remember when bulls were saying LTC was a leading indicator for Btc?
This thing looks ROUGH after peaking at 146 in June. pic.twitter.com/2nIMcxuwOr
— A Voice of Reason in a Sea of Insanity (@sometrader78) December 4, 2019
Additionally, he outlined a broken RSI trendline and resistance validation in the weekly RSI.
Let’s analyze the Litecoin price and see if it really is heading downward.
Logarithmic Curve
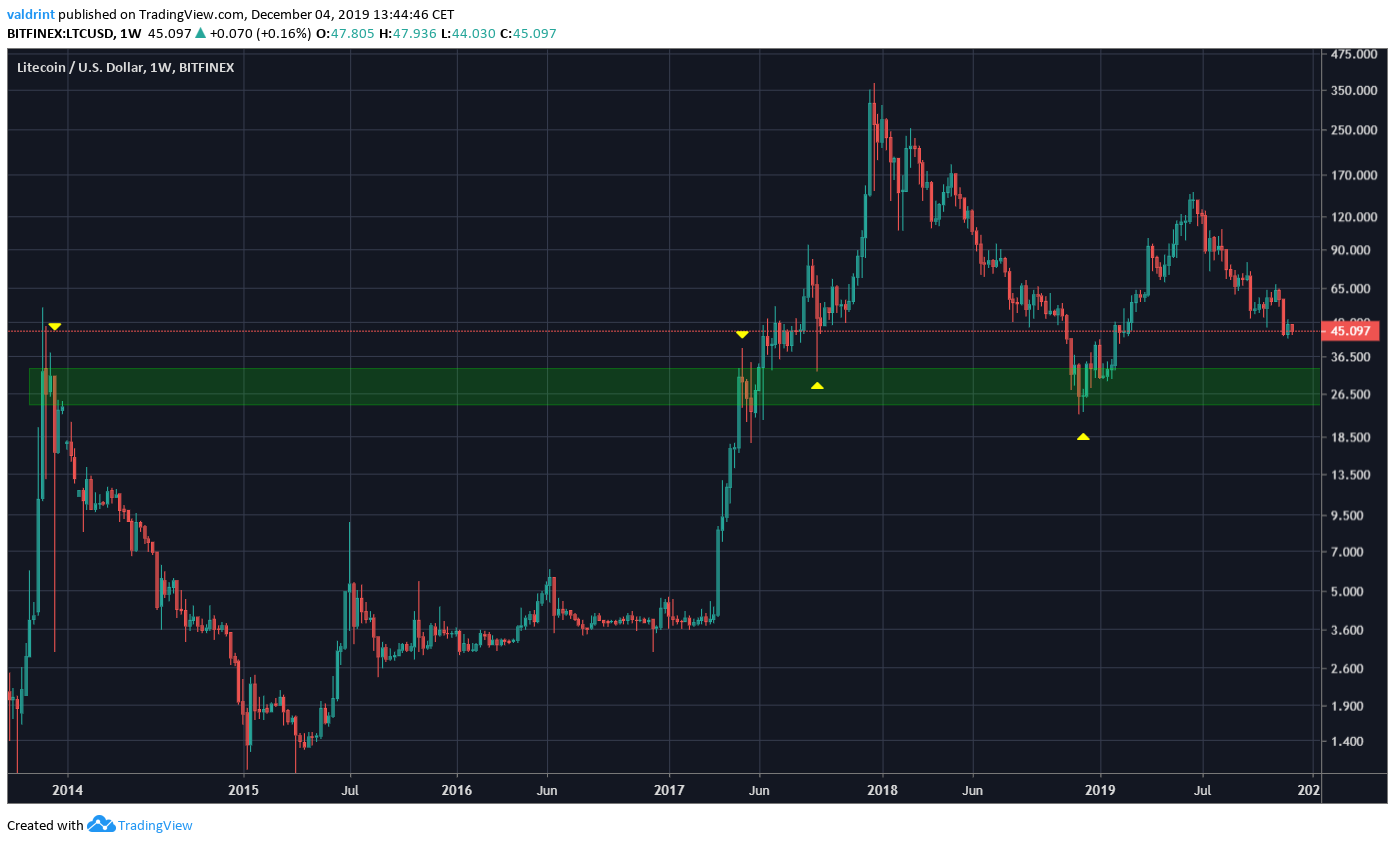
Looking at the historical price of Litecoin, we can see the signs of the $25-$30 area. This area served as the high during the 2013 bull run. The price broke out in 2017 and validated it as support afterward.
The price fell to the area for the second time in December 2018, beginning the current upward move.
Litecoin Current Correction
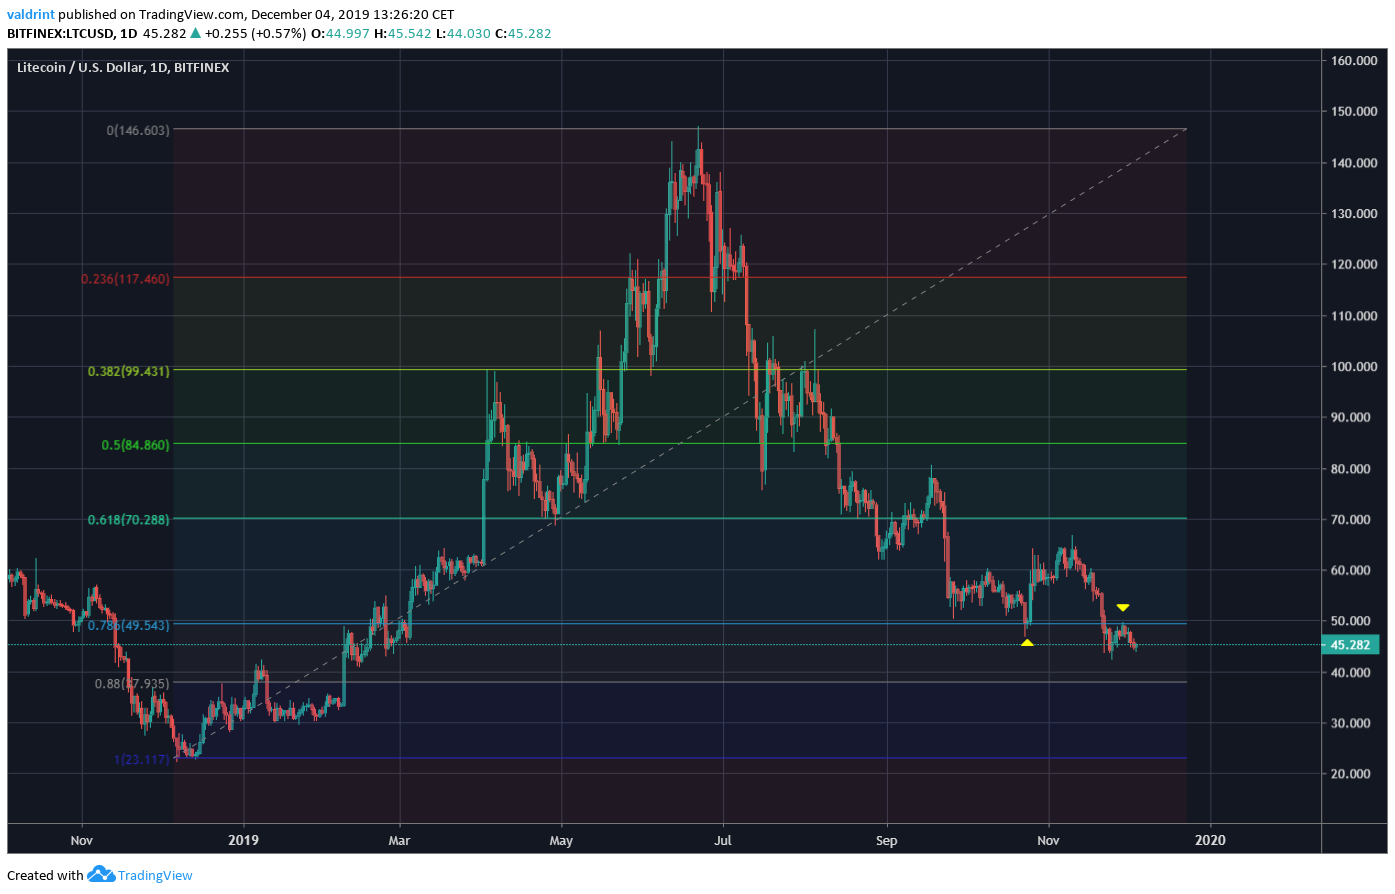
The Litecoin price began an upward move after reaching a low of $22 in December 2018. It has been decreasing since June 2019.
The price has almost reached the 0.88 fib level which is the final one before a full retracement.
Also, the price initially bounced on the 0.786 level, before validating it as resistance. This suggests that it will eventually fall to the 0.88 level at $39.
Possible Wedge
The Bitcoin price has possibly been trading inside a descending wedge since September. While the support line has been validated several times, the resistance line has not.
We can see a growing bullish divergence in both the RSI and the MACD. This gains more significance since the descending wedge is a bullish pattern.
So, we could see the price trading in this wedge until the end of the year, before breaking out. In January, the support line coincides with the 0.88 fib level mentioned in the previous section at $39, making it a suitable level to initiate a reversal.
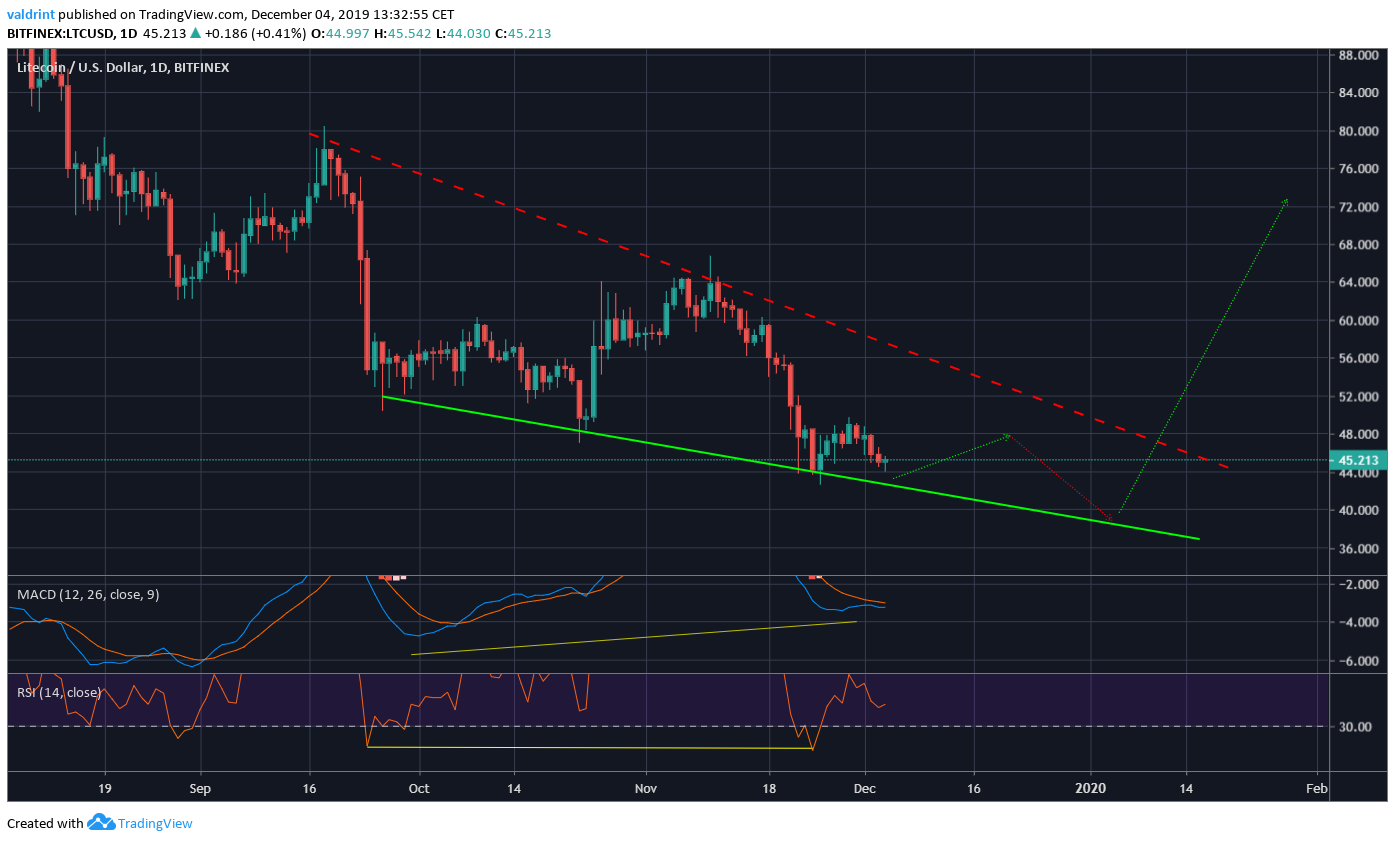
To conclude, the Litecoin price looks set to decrease at the rate predicted by the wedge until it reached $39. Afterward, a breakout is likely.
Disclaimer: This article is not trading advice and should not be construed as such. Always consult a trained financial professional before investing in cryptocurrencies, as the market is particularly volatile.
