
![LINK’s Double Top Suggests a Correction Awaits [Premium Analysis]](https://beincrypto.com/wp-content/uploads/2019/12/bic_chainlink_price_up-750x375.jpg.optimal.jpg)
The LINK price has likely reached its high for 2019. The corrective period should continue until LINK begins a new upward move at a more gradual rate.
The LINK price has been decreasing since November 16, having lost 30% of its value. However, on December 19. the price bounced inside a significant support area, suggesting that an upward move might begin. This move is supported by positive news, since Synthetix, the second biggest DeFi application in Ethereum, announced in a blog post that they have begun using the technology offered by Chainlink in order to obtain decentralized price feeds with high accuracy.
Crypto trader @PostyXBT outlined the LINK price bounce at the 25,000 satoshi support area, which also aligns with the 200-day moving average (MA). According to him, the next test for the price comes at the 27,500 satoshi resistance area, which also coincides with the 100-day MA resistance.
If it gets there, will the price be able to breakthrough? Continue reading below if you are interested in finding out.$LINK
— Posty (@PostyXBT) December 20, 2019
Nice start.
Let's see how price reacts at 27.5k resistance which aligns with the 100MA. pic.twitter.com/E6QeXJEoB5
Support Area
We can outline the support and resistance areas at 24,500 and 28,000 satoshis respectively. The price bounced on the first one, which coincides with the 100-day MA. The resistance area is outlined at 28,000 instead of 27,5000 satoshis, since besides the fake breakdown on December 5-9, the price had instead reacted to the 28,000 satoshis area as support.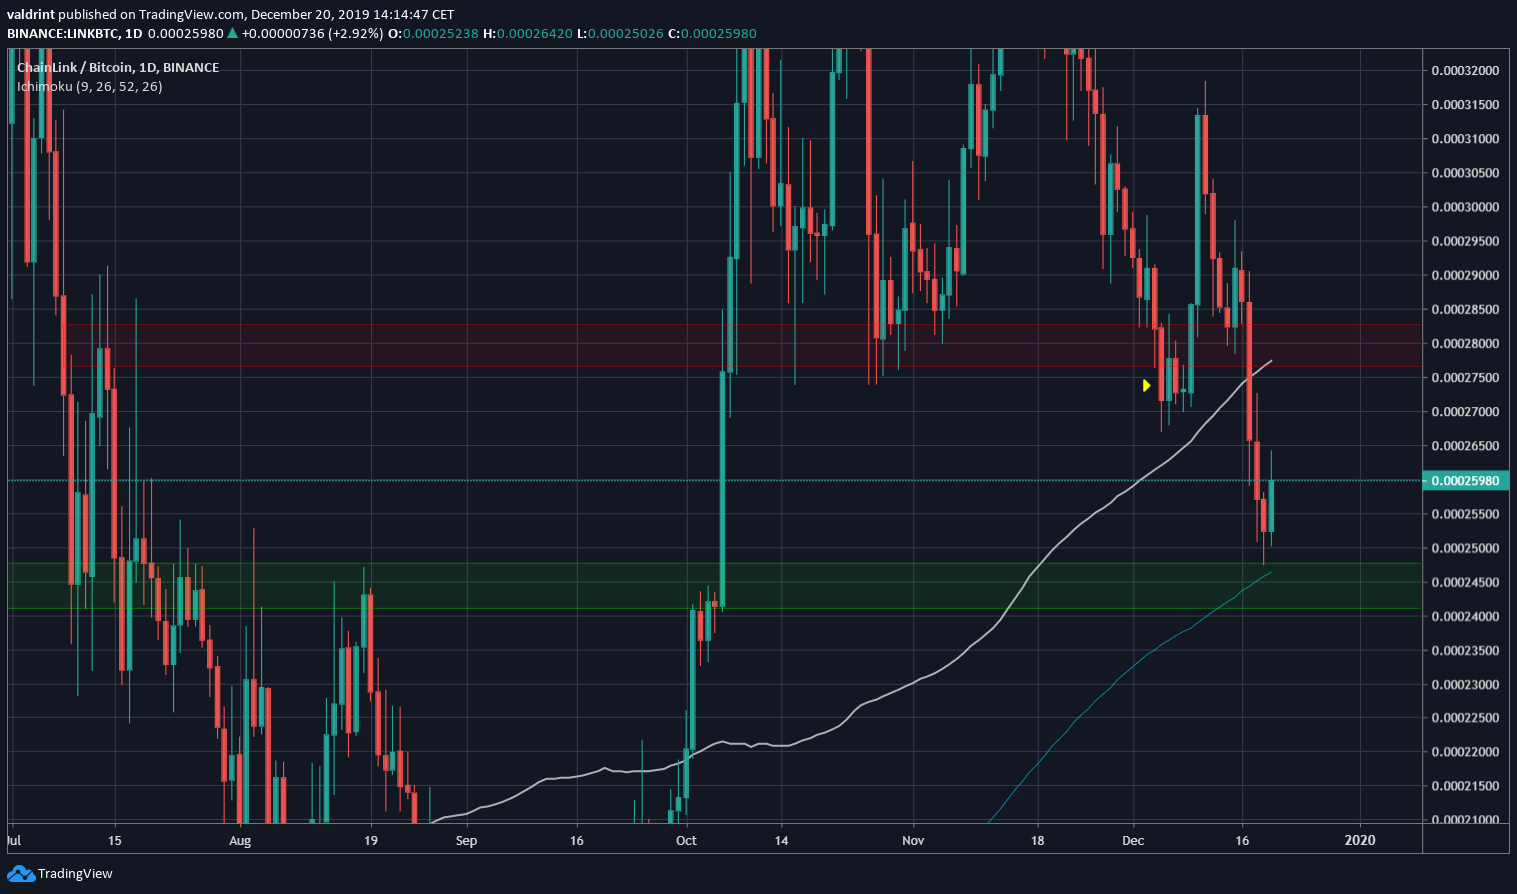 The bounce was likely aided by previous movement and technical indicators.
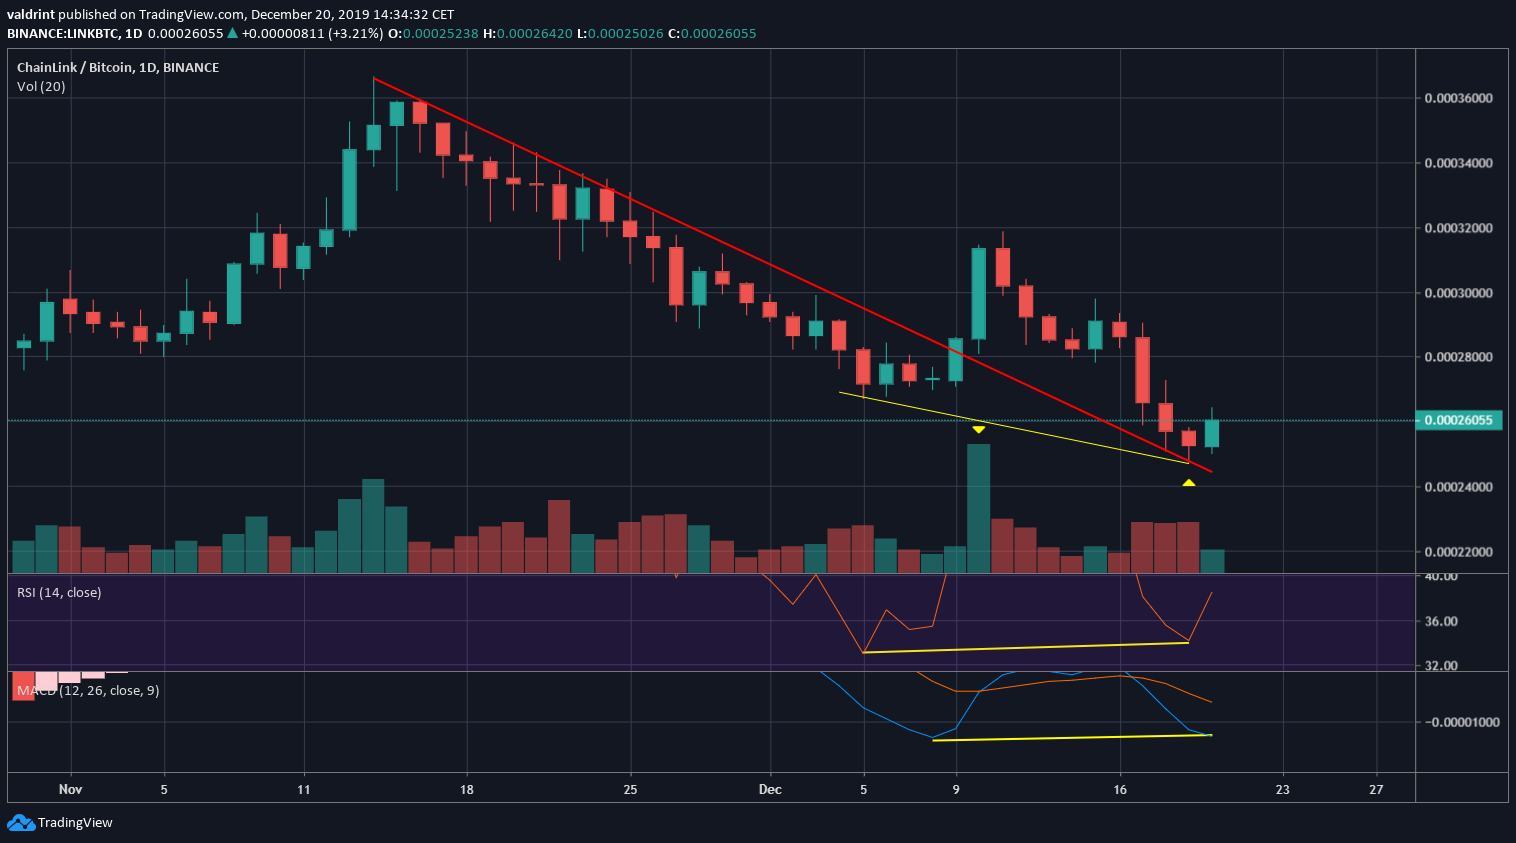
On December 9, the LINK price broke out from a descending resistance line with very significant volume. Afterward, it returned in order to validate the line as support.
Additionally, this movement was combined with a bullish divergence in both the RSI & the MACD. This suggests that the price will likely continue moving upward and reach the previously mentioned resistance area at 28,000 satoshis.
The bounce was likely aided by previous movement and technical indicators.
On December 9, the LINK price broke out from a descending resistance line with very significant volume. Afterward, it returned in order to validate the line as support.
Additionally, this movement was combined with a bullish divergence in both the RSI & the MACD. This suggests that the price will likely continue moving upward and reach the previously mentioned resistance area at 28,000 satoshis.
LINK Long-Term Chart
The weekly chart looks bearish. The price has made a double top near 35,000 satoshis. The first top had a very long upper wick, a sign of selling pressure. Besides the fact that the double top is a bearish reversal pattern, volume was almost non-existent during the formation of a second top, indicating that a downward move will likely follow. Finally, here is a very strong bearish divergence in both the weekly RSI & MACD. A divergence in such a high time-frame almost always leads to a price breakdown. When combined with the other bearish characteristics, we can be almost certain that one will transpire.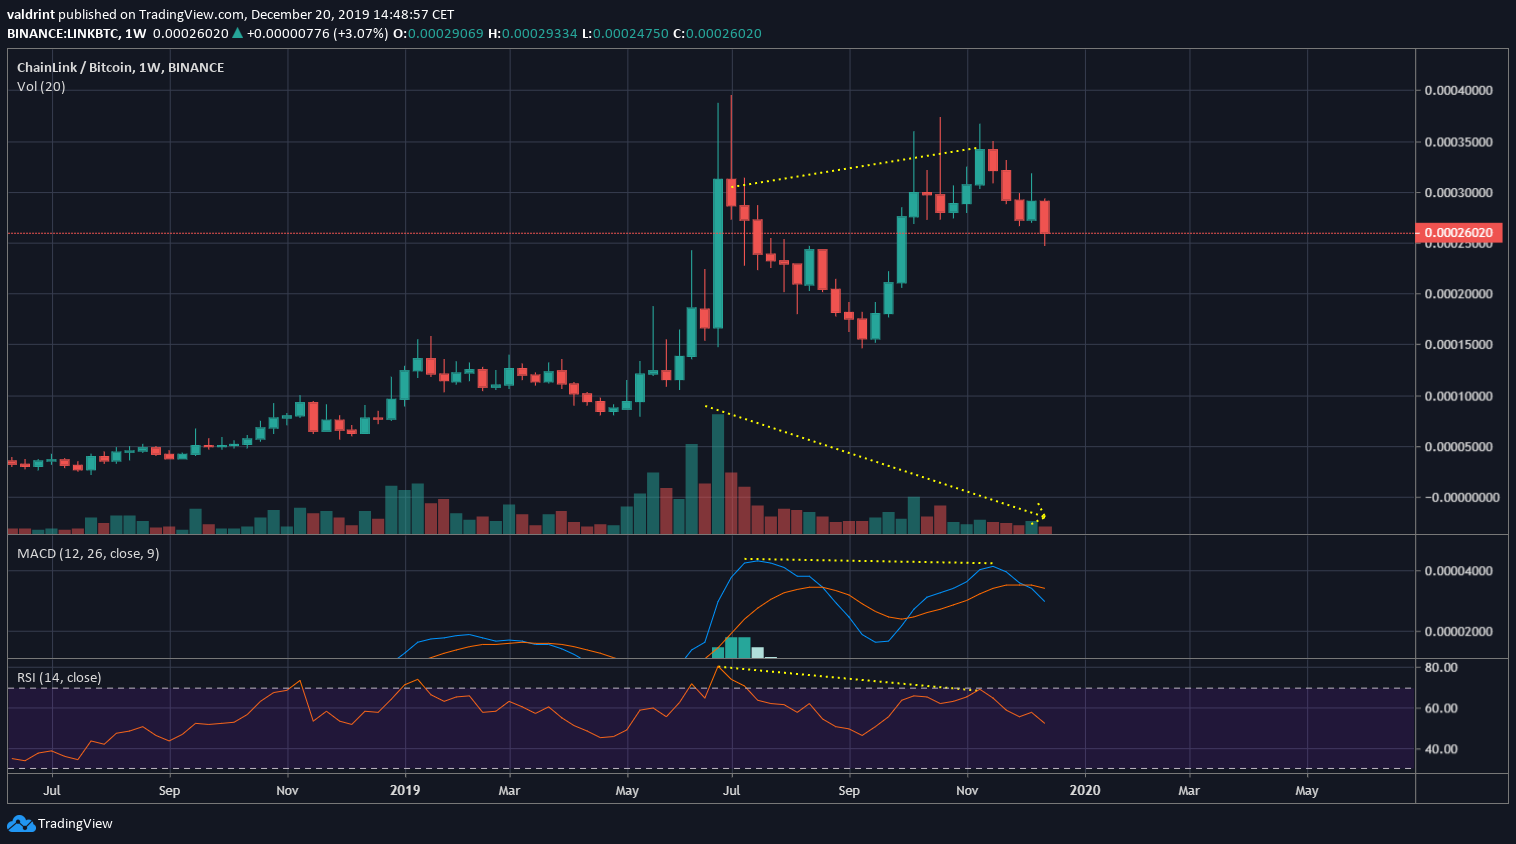 Additionally, the LINK price has accelerated its rate of increase every time it has made a higher low. This is unsustainable in the long-run.
If the price were to bounce at the 100-day MA, as stated in the first section, this would mark the fourth time that LINK has accelerated its increase.
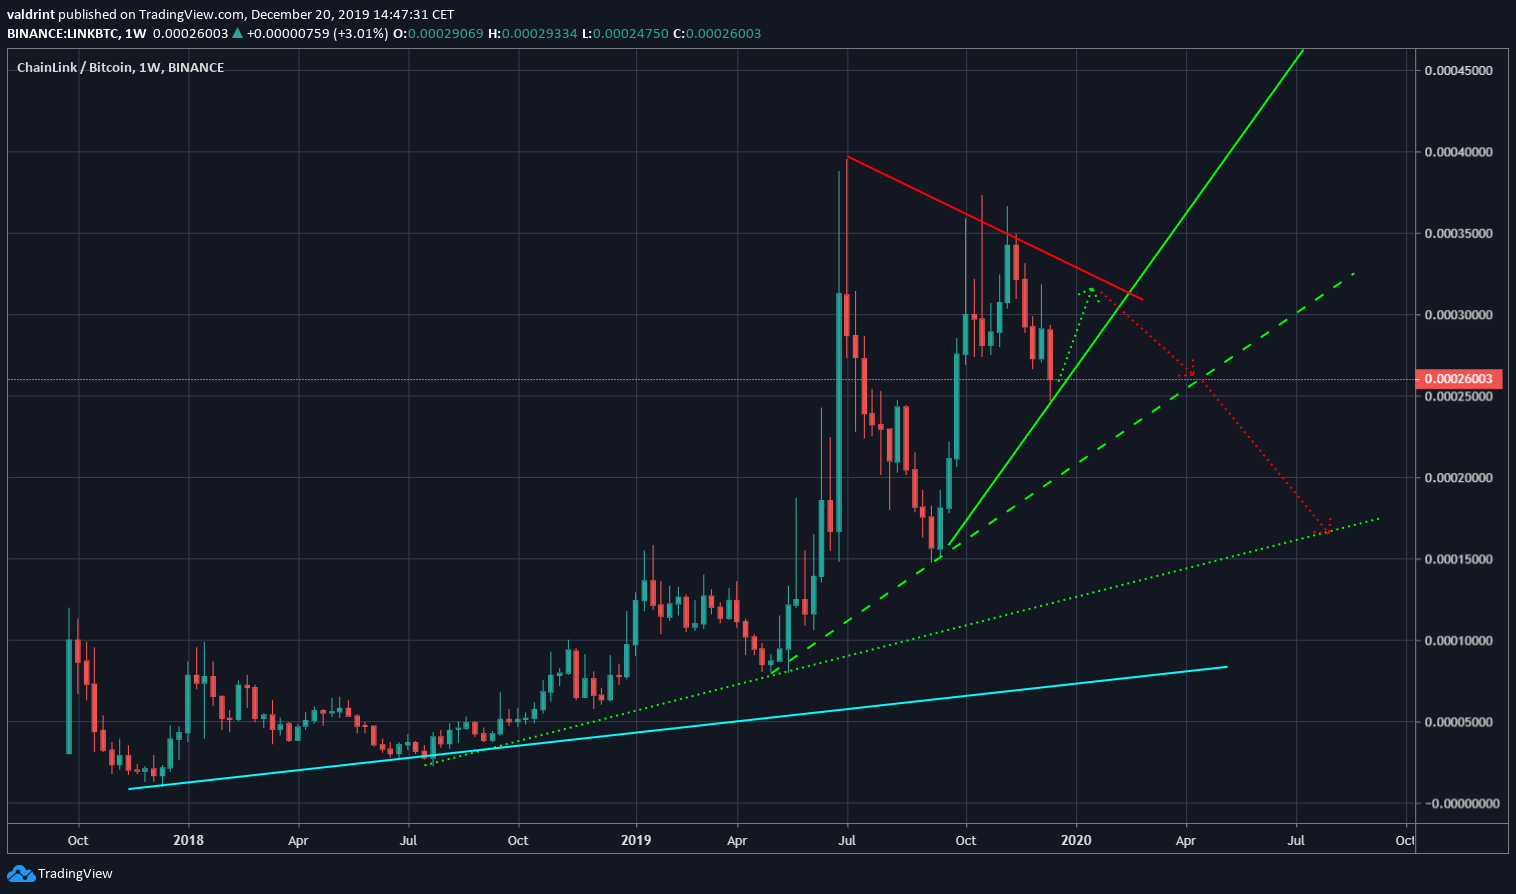
If we measure form the wick high, the price movement creates a symmetrical triangle. It is expected that the price reaches the resistance line, before breaking down towards the closest support line at 25,000 satoshis and possibly the next one near 15,000 satoshis.
We suggested a decrease to the support line in our previous article.
Additionally, the LINK price has accelerated its rate of increase every time it has made a higher low. This is unsustainable in the long-run.
If the price were to bounce at the 100-day MA, as stated in the first section, this would mark the fourth time that LINK has accelerated its increase.
If we measure form the wick high, the price movement creates a symmetrical triangle. It is expected that the price reaches the resistance line, before breaking down towards the closest support line at 25,000 satoshis and possibly the next one near 15,000 satoshis.
We suggested a decrease to the support line in our previous article.
 To conclude, the LINK price seems to have reached a high and a corrective period should ensue. A short-term increase towards 28,000 satoshis is possible before the price resumes its correction.
Disclaimer
In line with the Trust Project guidelines, this price analysis article is for informational purposes only and should not be considered financial or investment advice. BeInCrypto is committed to accurate, unbiased reporting, but market conditions are subject to change without notice. Always conduct your own research and consult with a professional before making any financial decisions. Please note that our Terms and Conditions, Privacy Policy, and Disclaimers have been updated.

Valdrin Tahiri
Valdrin discovered cryptocurrencies while he was getting his MSc in Financial Markets from the Barcelona School of Economics. Shortly after graduating, he began writing for several different cryptocurrency related websites as a freelancer before eventually taking on the role of BeInCrypto's Senior Analyst.
(I do not have a discord and will not contact you first there. Beware of scammers)
READ FULL BIO
Sponsored
Sponsored