


On October 25, 2019, the LINK price barely failed to reach a new all-time high. It has been decreasing since. We believe it has reached its high for the current year.
On November 14, LINK made another attempt at initiating an upward move, which failed at the same resistance area. Since then, it has decreased by 23%.
Altcoin Trader and analyst Crypto Krillin (@LSDinmycoffee) stated that the LINK price recently did what he calls a “dead cat bounce,” meaning that it has initiated a relief rally in response to the prior decrease. For the future, he has outlined two possible price paths:
- The price decreases to the ascending support line, bounces and resumes its upward movement.
- The price decreases to the support line, breaks down and heads lower.
update: dead cat bounced a bit on dma100, but will likely keep following the squiggly line pic.twitter.com/xeZ7BlDqil
— krillin ॐ (@LSDinmycoffee) December 17, 2019
Which one is more likely? Continue reading below if you are interested in finding out.
Steep, Steeper and Steepest
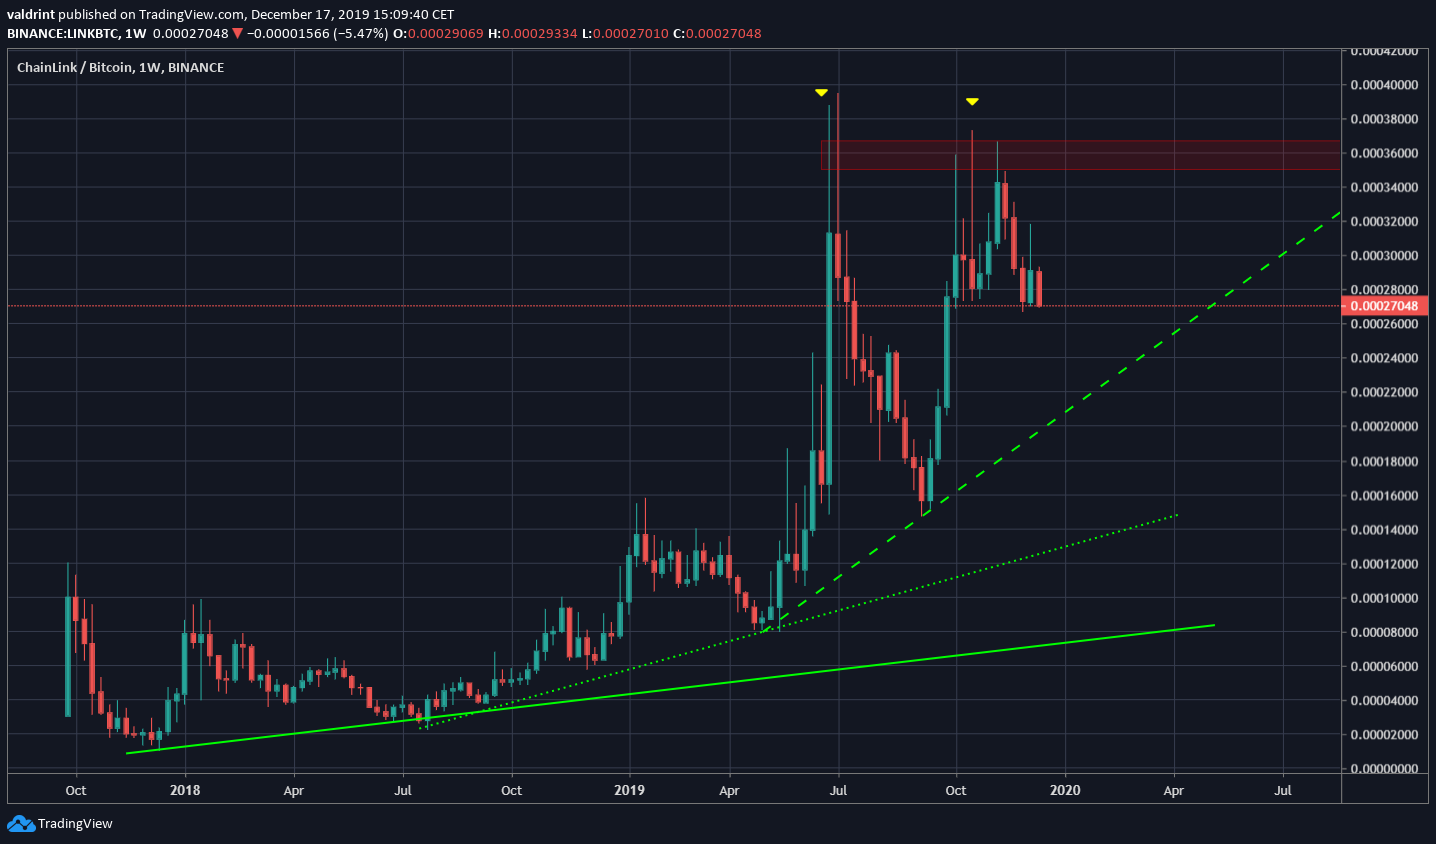
The LINK price has been increasing since 2018. Every time it has made a higher low, the rate of increase has accelerated. This seems unsustainable in the long-term.
Therefore, while the recent resistance area at 36,000 satoshis combined with the latest support line creates an ascending triangle, we think it is more likely that the price has created a double top and will decrease instead.
This view is supported by the presence of two long upper wicks near the resistance area.
Furthermore, both the weekly RSI and MACD have generated very strong bearish divergence. This all but confirms that the price will decrease until it reaches the support line.
We suggested this decrease will occur in our previous article.
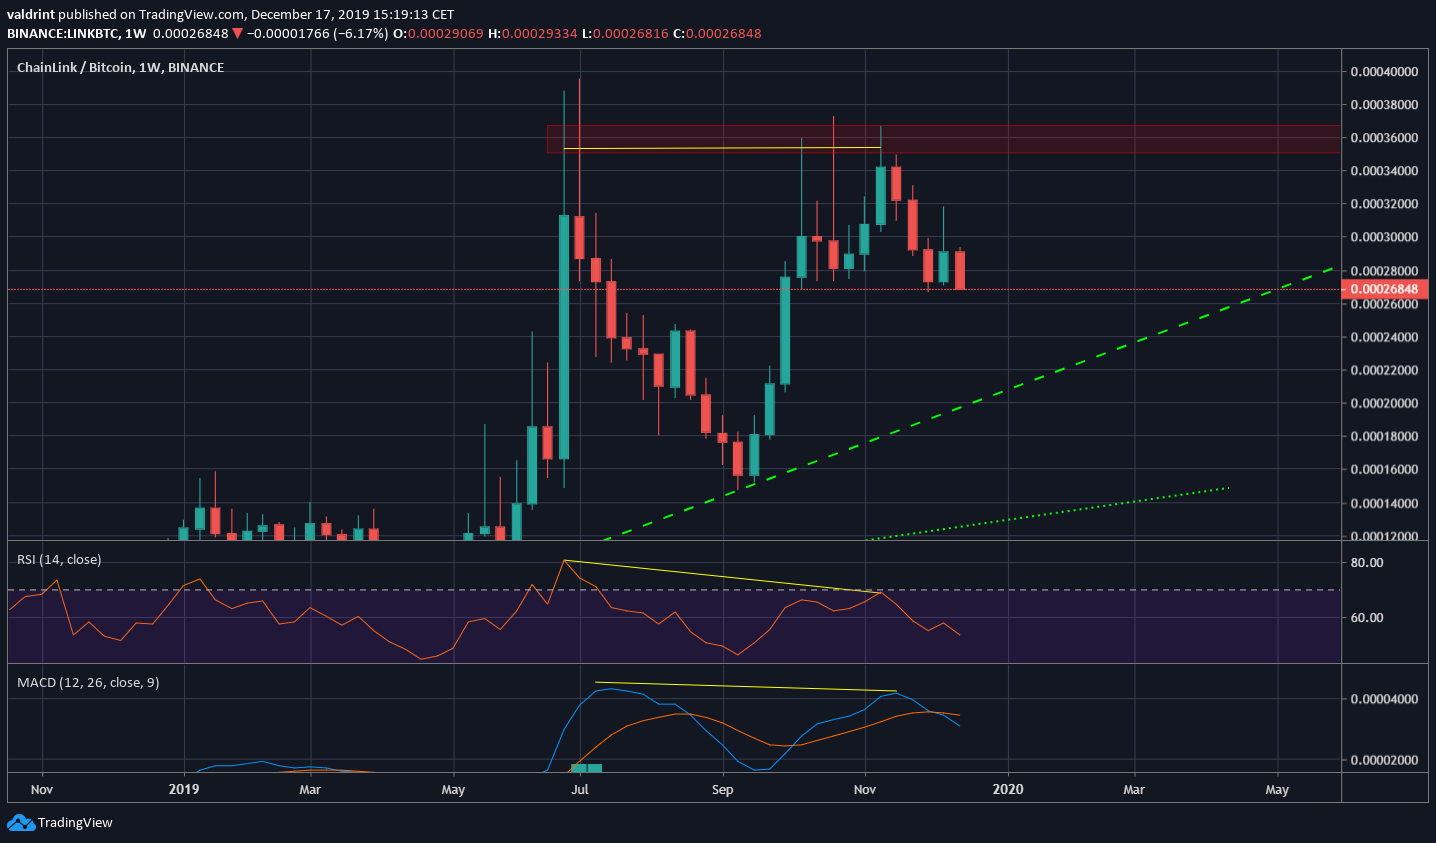
Therefore, we believe the first part of the move outlined in the tweet will definitely occur. However, after the price reaches the support line, will it bounce upward or decrease towards the second support line?
LINK Future Movement
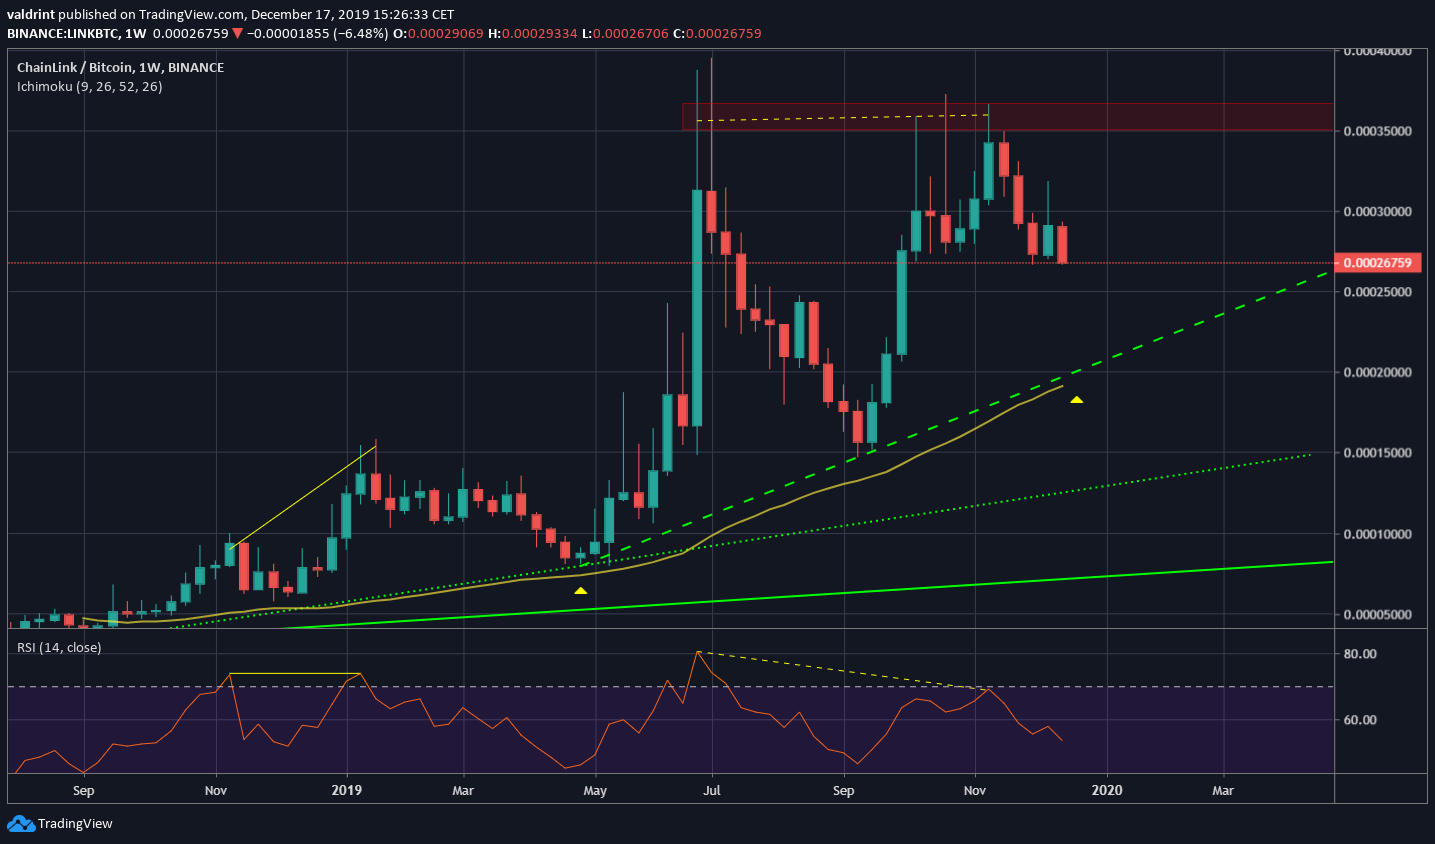
There is a previous pattern that can be helpful in determining future movement.
The weekly RSI has generated bearish divergence on only two occasions. The first time, a decrease towards the support line transpired, and the price bounced at the support line and the 50-week moving average (MA), before creating a steeper line.
In the current movement, the 50-week MA is just below the current support line. Therefore, if the price follows the same pattern once more, it will bounce at the point where the MA and support line meets, before accelerating its rate of increase once again.
Using a reverse fib retracement tool towards the possible bottom, we can assume this movement will end between 50,000 and 55,000 satoshis.
However, the move is still a long time away, so this prediction is bound to be relatively inaccurate.
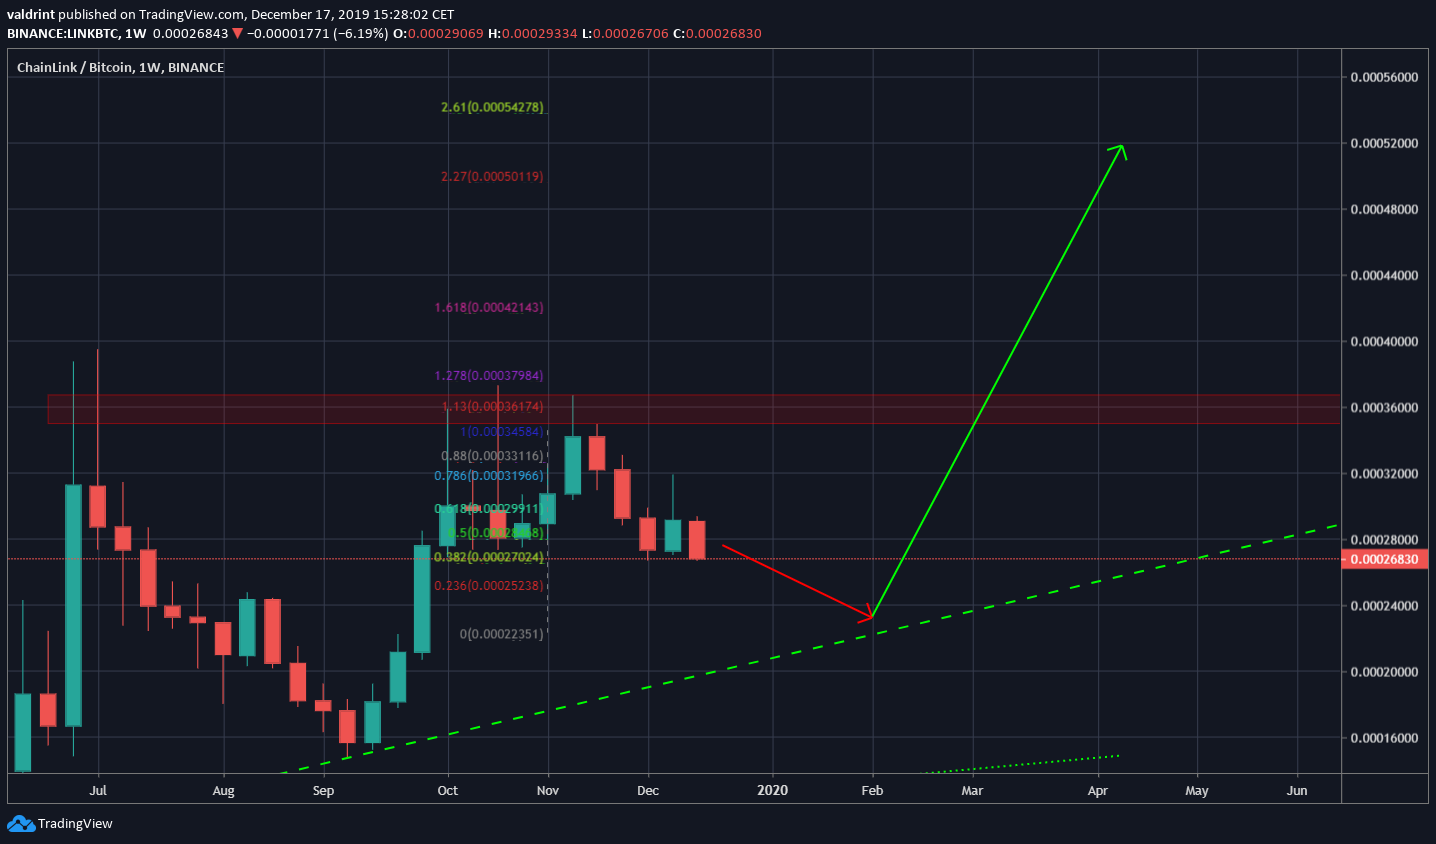
To conclude, the LINK price is expected to undergo a corrective period until it reaches the ascending support line before it bounces and initiates another upward move towards a new all-time high.


