
The ChainLink (LINK) price has been decreasing alongside a descending resistance line since its Aug 16 all-time high.
Unless the price is successful in breaking out above this resistance, the price movement is still considered corrective.
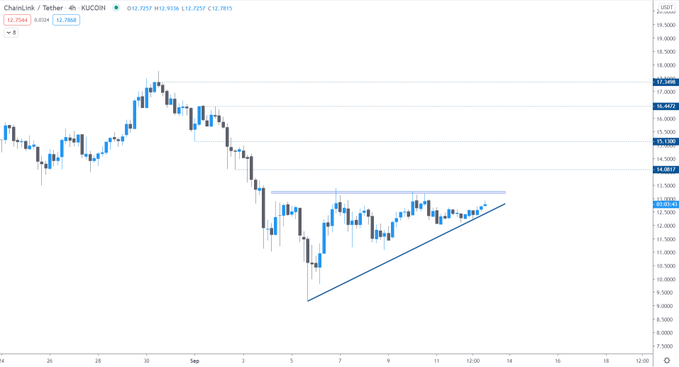
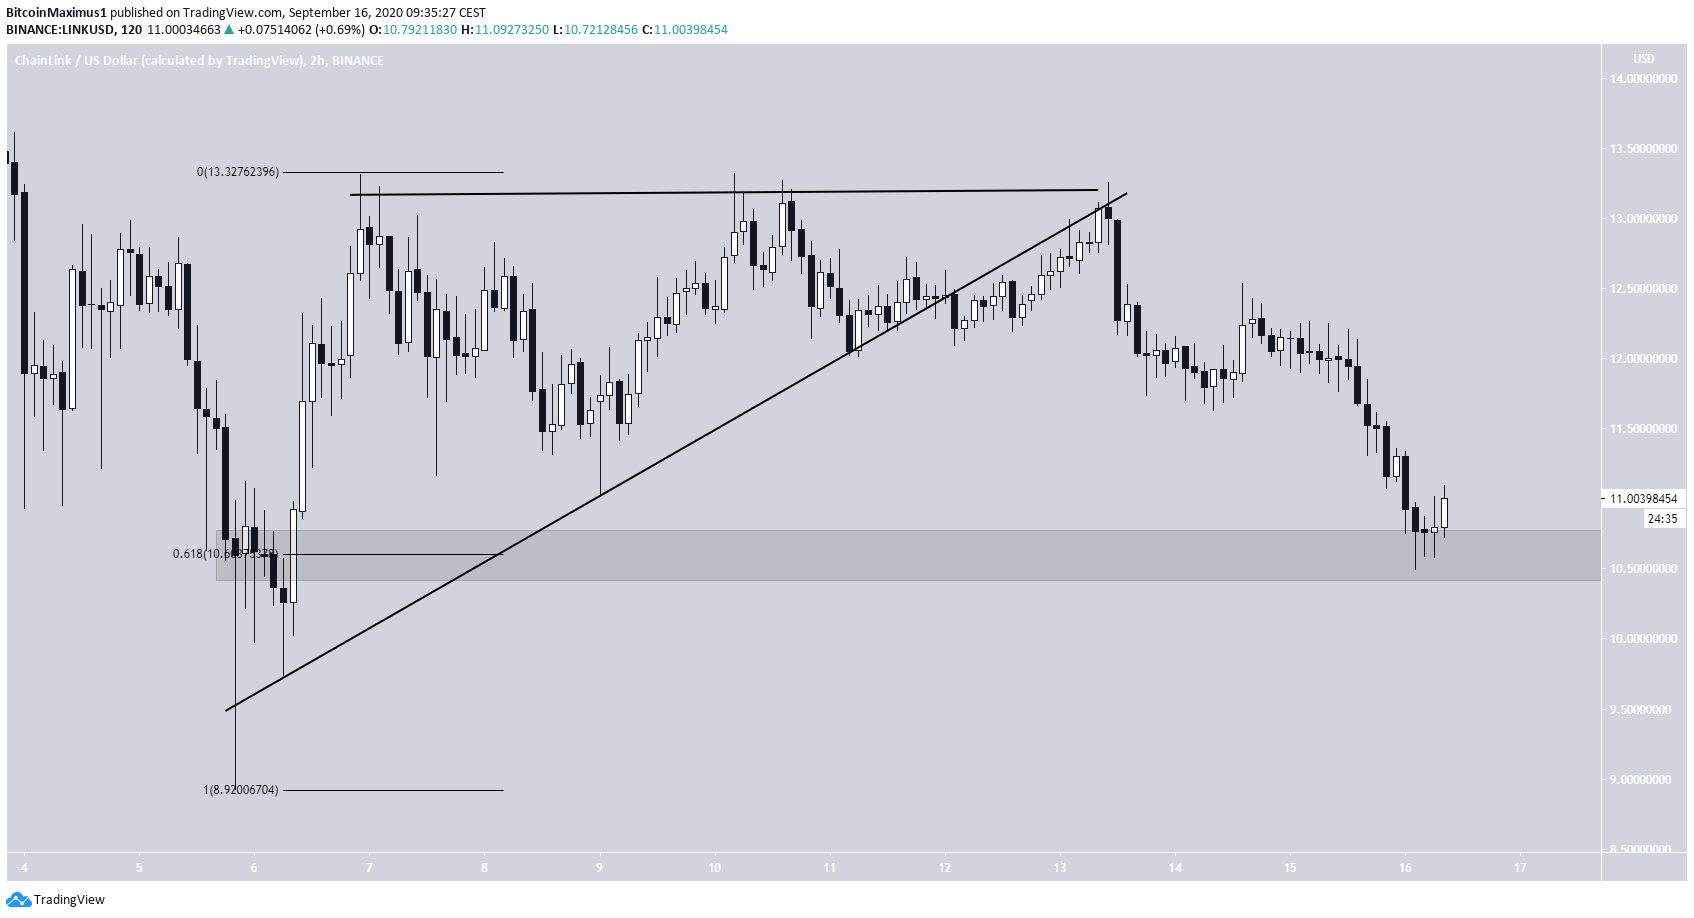
LINK Breaks Down from Bullish Pattern
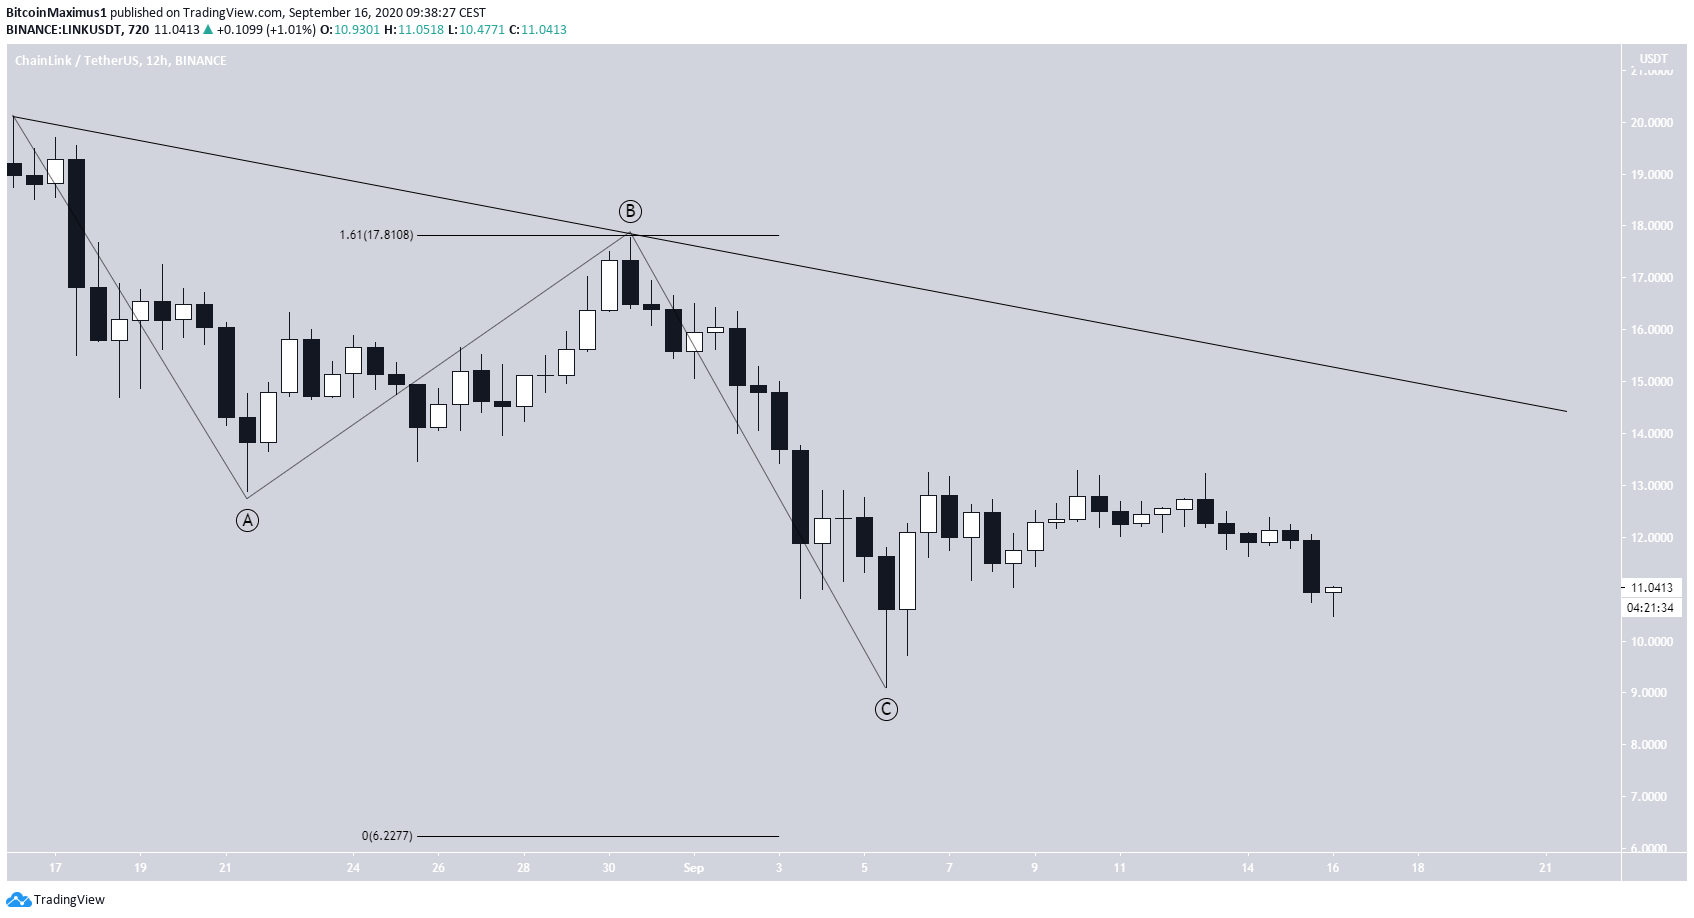
The LINK price has been decreasing since Aug 16, when it reached a high of $20.11. While the price seemingly began an upward move on Aug 21, it reached a top shortly after with a high of $17.77. This created a lower-high and a descending resistance line that the price has been trading under since. LINK has been recently trading between support and resistance at $10 and $13.30, respectively. The horizontal resistance has been validated multiple times, as can be seen in the multiple wicks on the daily chart.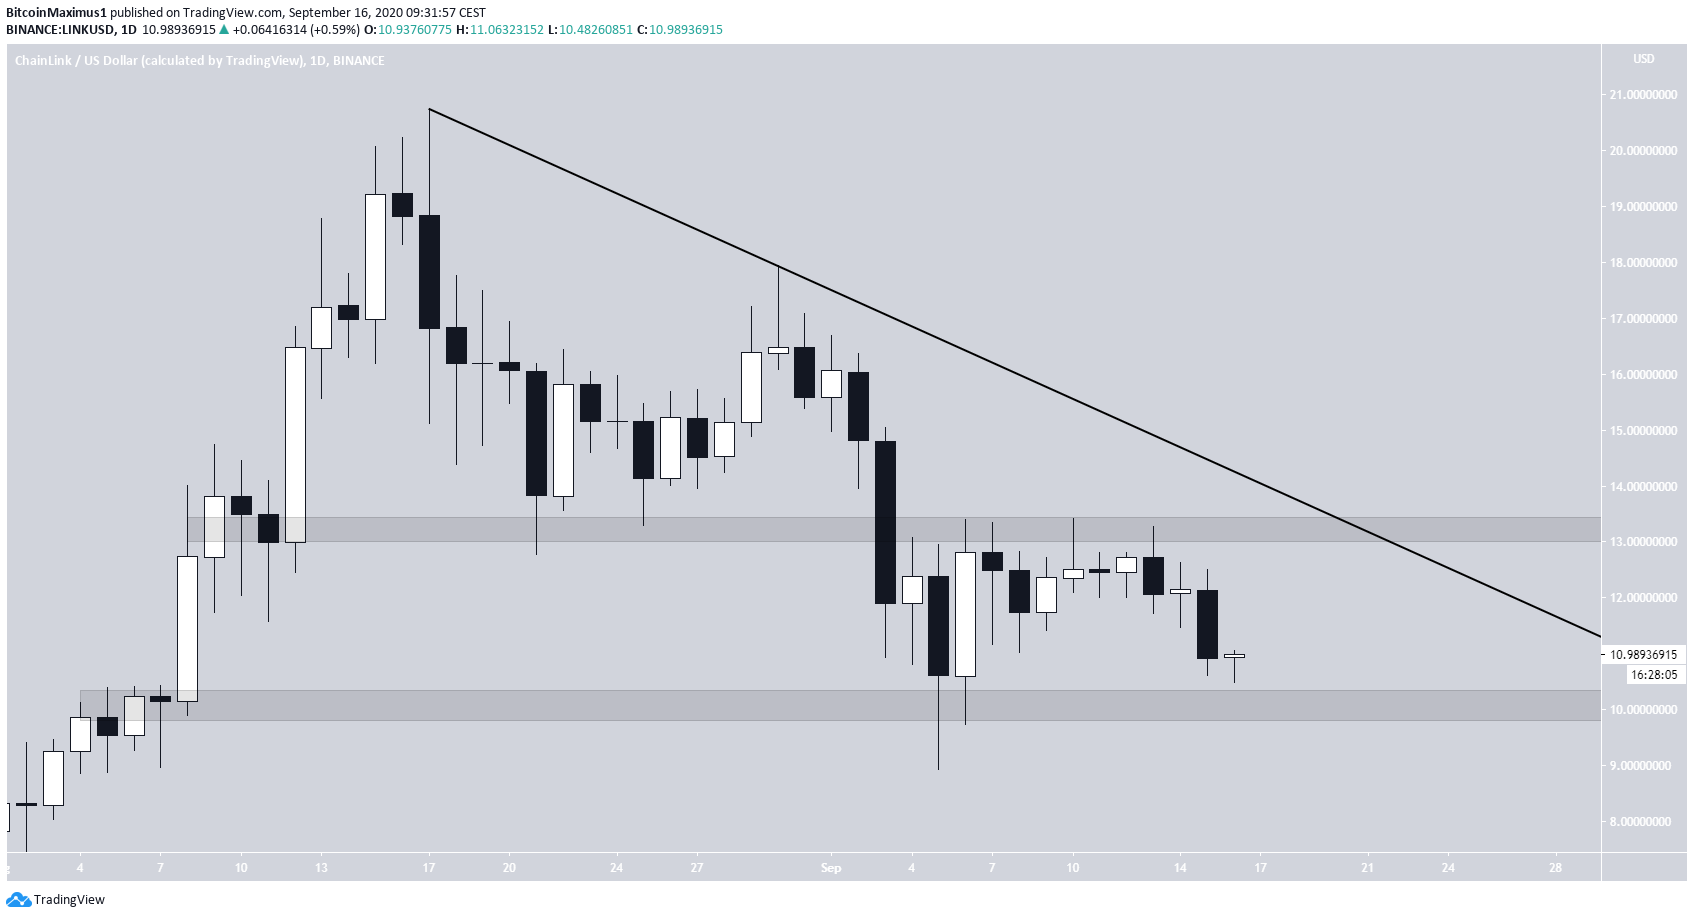
Continued Decrease
Technical indicators in the daily time-frame do not yet show any signs of a reversal. The MACD, Stochastic Oscillator, and the RSI are decreasing, the latter failing to even reach the 50-line. These are signs that further support the theory that LINK will reach the $10 support area.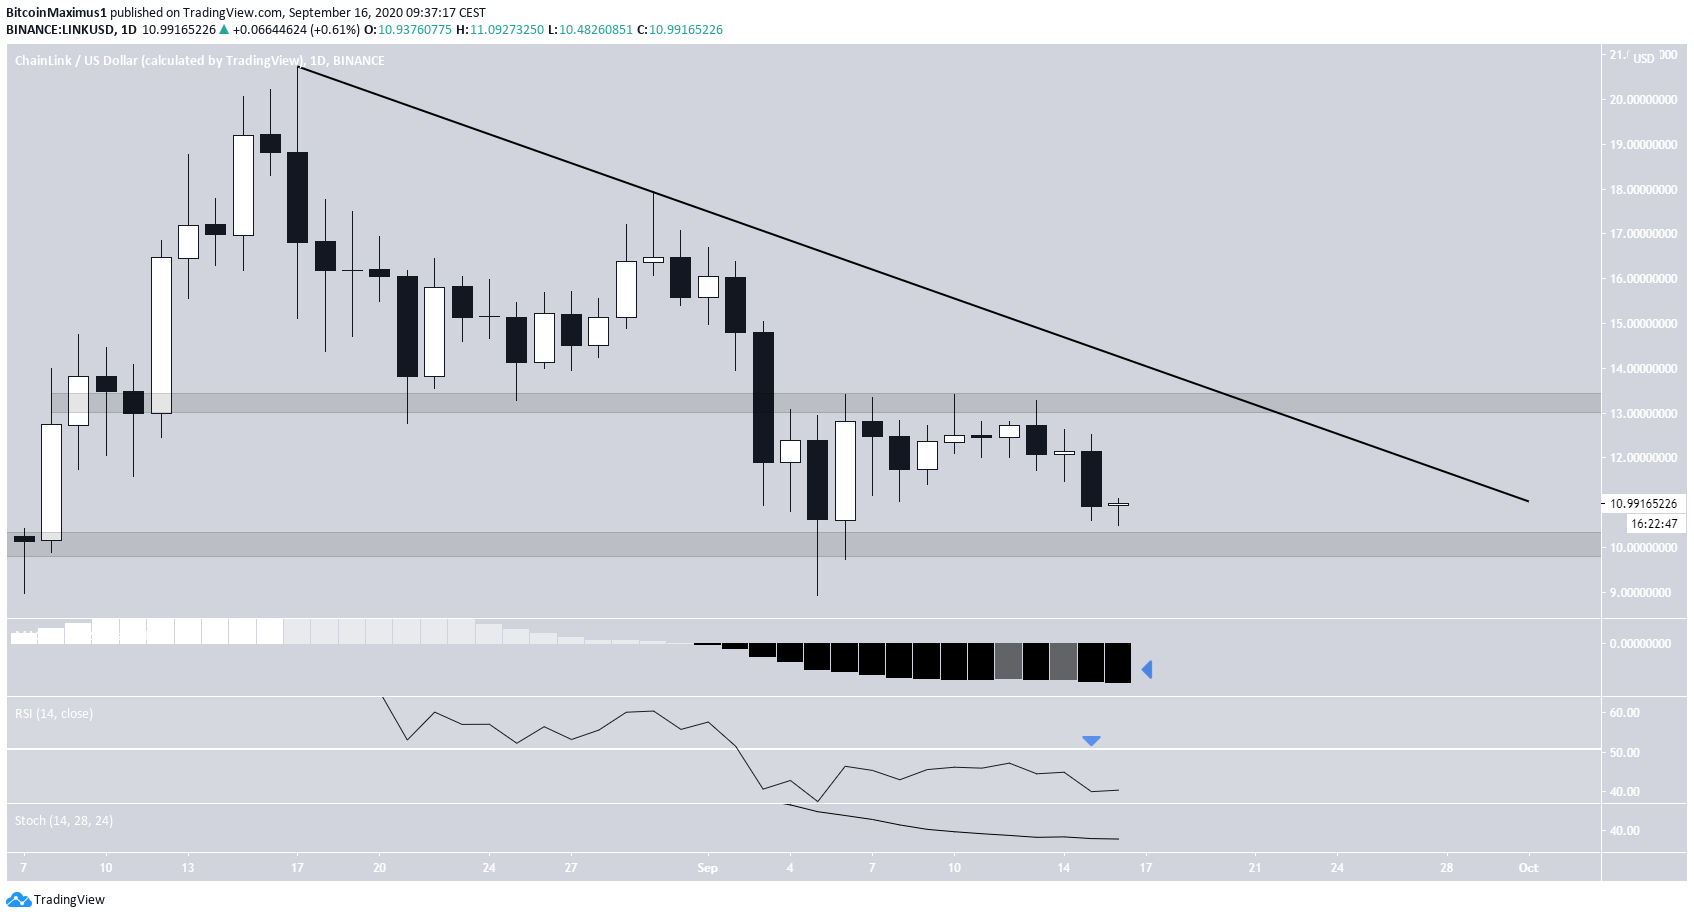
Disclaimer
In line with the Trust Project guidelines, this price analysis article is for informational purposes only and should not be considered financial or investment advice. BeInCrypto is committed to accurate, unbiased reporting, but market conditions are subject to change without notice. Always conduct your own research and consult with a professional before making any financial decisions. Please note that our Terms and Conditions, Privacy Policy, and Disclaimers have been updated.

Valdrin Tahiri
Valdrin discovered cryptocurrencies while he was getting his MSc in Financial Markets from the Barcelona School of Economics. Shortly after graduating, he began writing for several different cryptocurrency related websites as a freelancer before eventually taking on the role of BeInCrypto's Senior Analyst.
(I do not have a discord and will not contact you first there. Beware of scammers)
READ FULL BIO
Sponsored
Sponsored