The ChainLink (LINK) price has been gradually increasing over the past two months. While the upward move has shown considerable strength, the price is approaching a crucial resistance area, which could be an obstacle for the ongoing bullish trend.
Current Movement
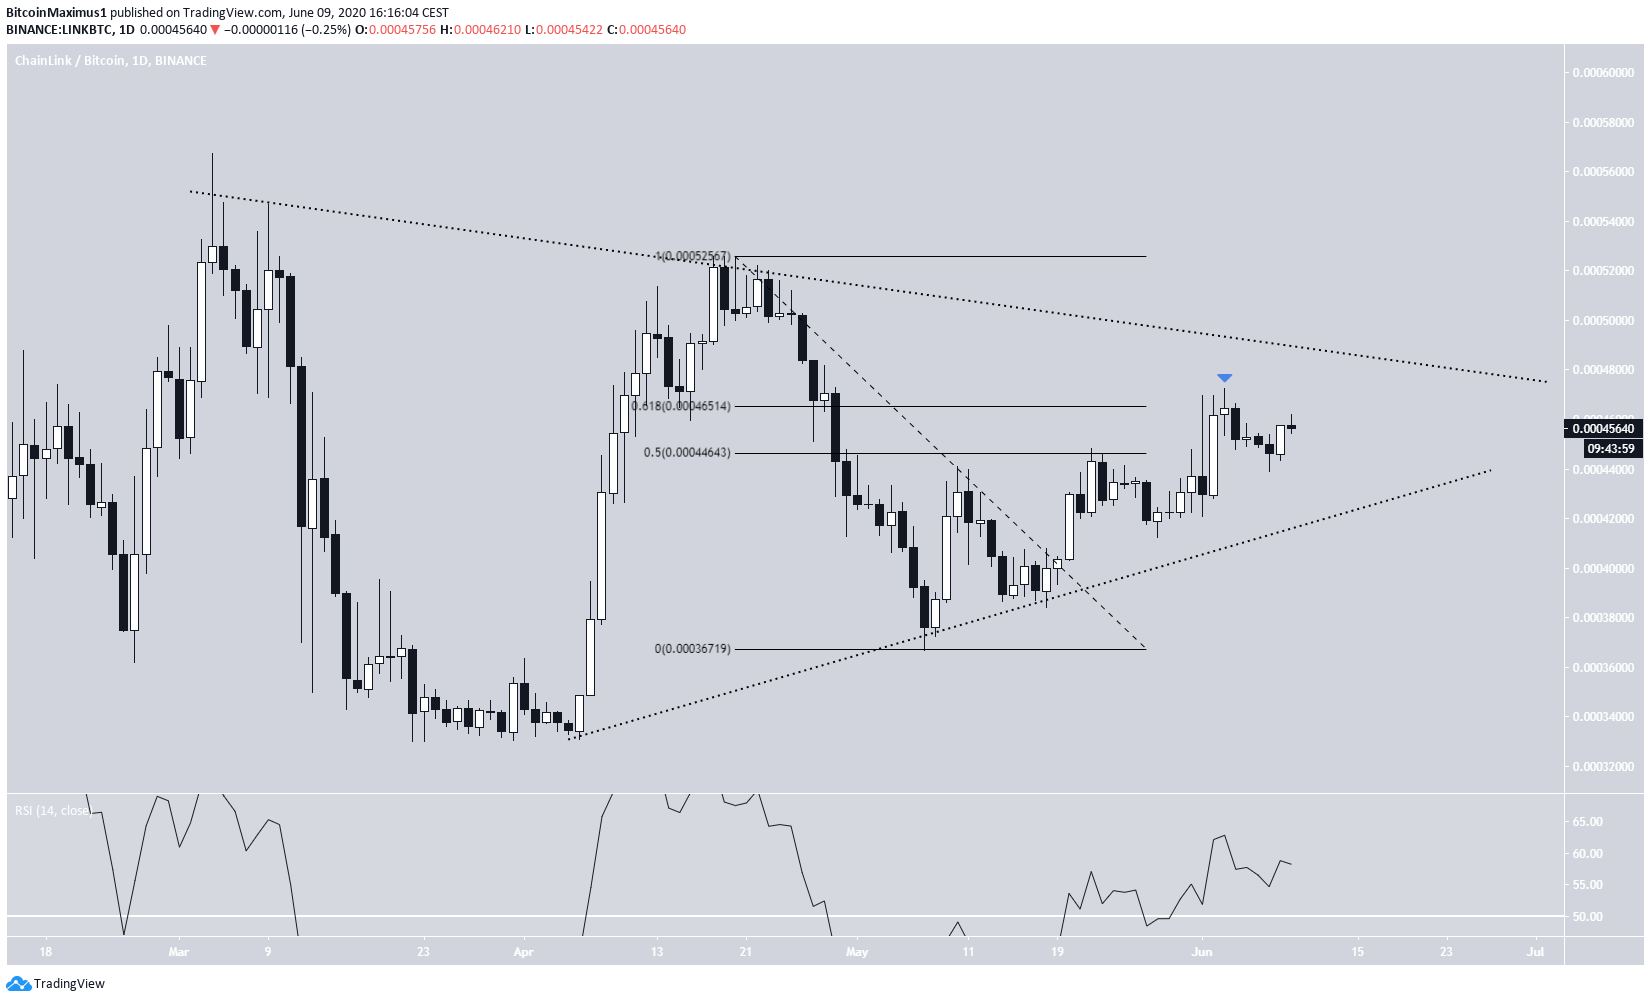
The LINK price has been trading inside a long-term symmetrical triangle since it reached an all-time high of 56,734 satoshis on March 3. Both the support and resistance lines have been validated three times.
At the time of writing, the price was trading near 45,000 satoshis, the 0.618 Fib level of the most recent decline. While this area rejected the price on June 4, it is gearing up to make another attempt. If successful in breaking out, the resistance line of the triangle can be found at 49,500 satoshis.
The daily RSI is above 50 and is not forming any bearish divergence, a sign that the price is likely to continue moving upwards.
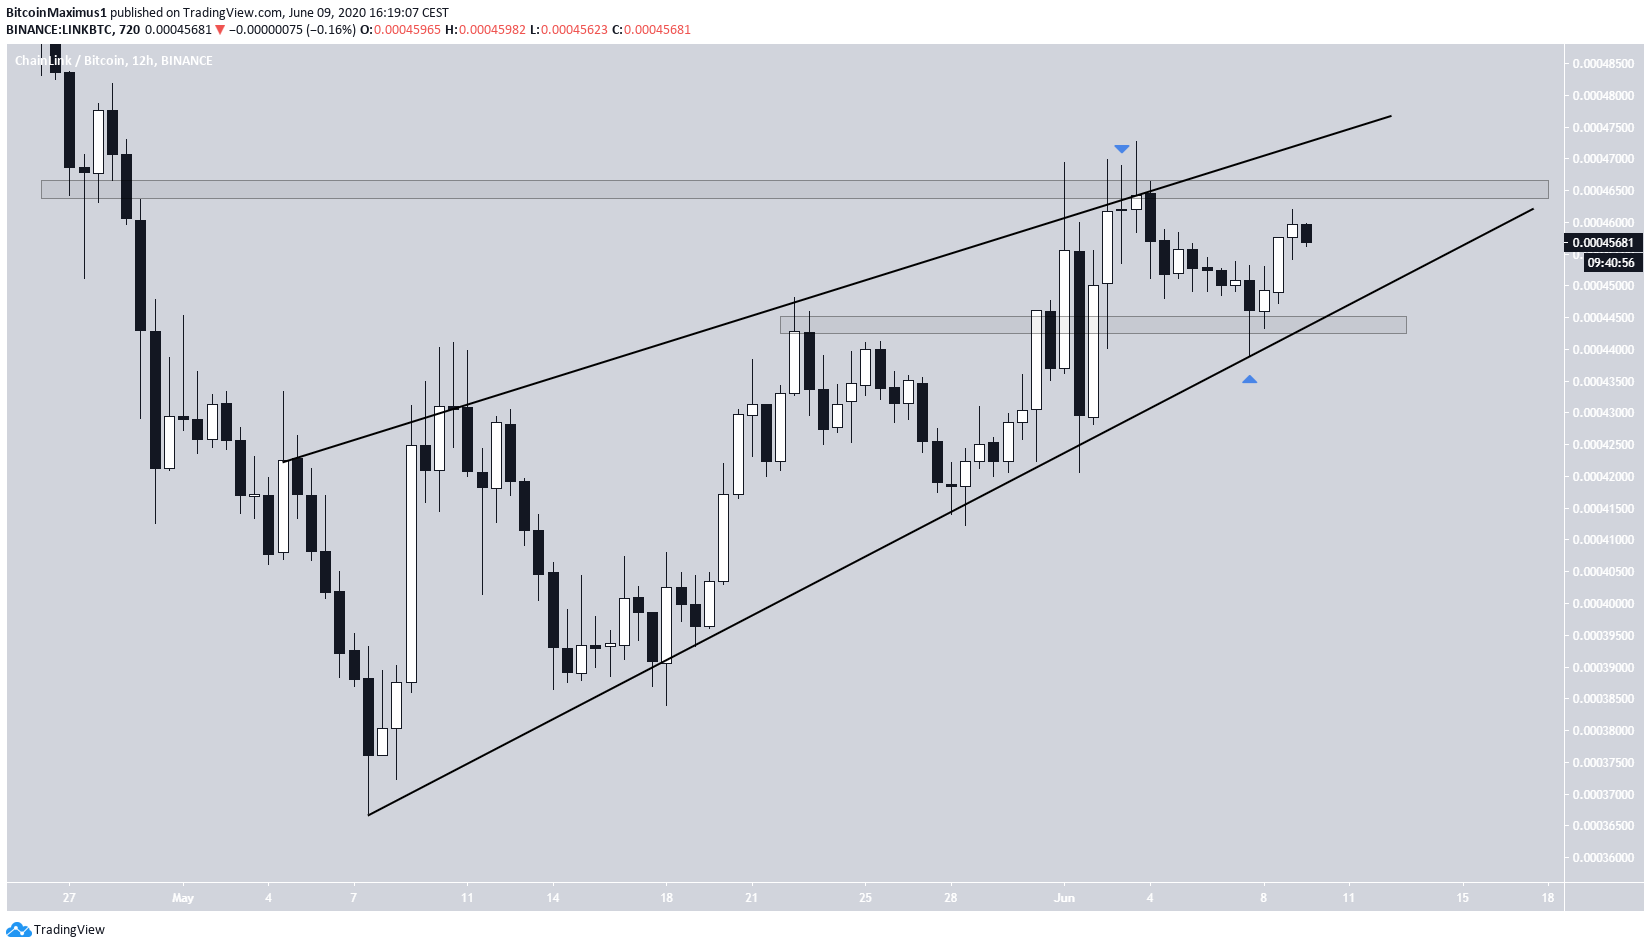
In the short-term, we can see minor resistance and support areas at 46,500 and 44,500 satoshis, respectively. The price was rejected by the former but validated by the latter as support afterward.
In addition, the price is possibly trading inside an ascending wedge, which is a bearish reversal pattern. However, the slope of the resistance line is not entirely clear, allowing for the possibility that it’s a rising channel instead.
The price seems poised to reach the resistance area. Once it gets there, the presence of divergence will determine if it breaks out towards the resistance line of the longer-term symmetrical triangle, or if it gets rejected and breaks down.
One well-known investor and trader @quintenfrancois is bullish and believes the price will move upwards, explaining that:
$LINK looks like it wants to go on a run again. Do it, and never return.
LINK/USD
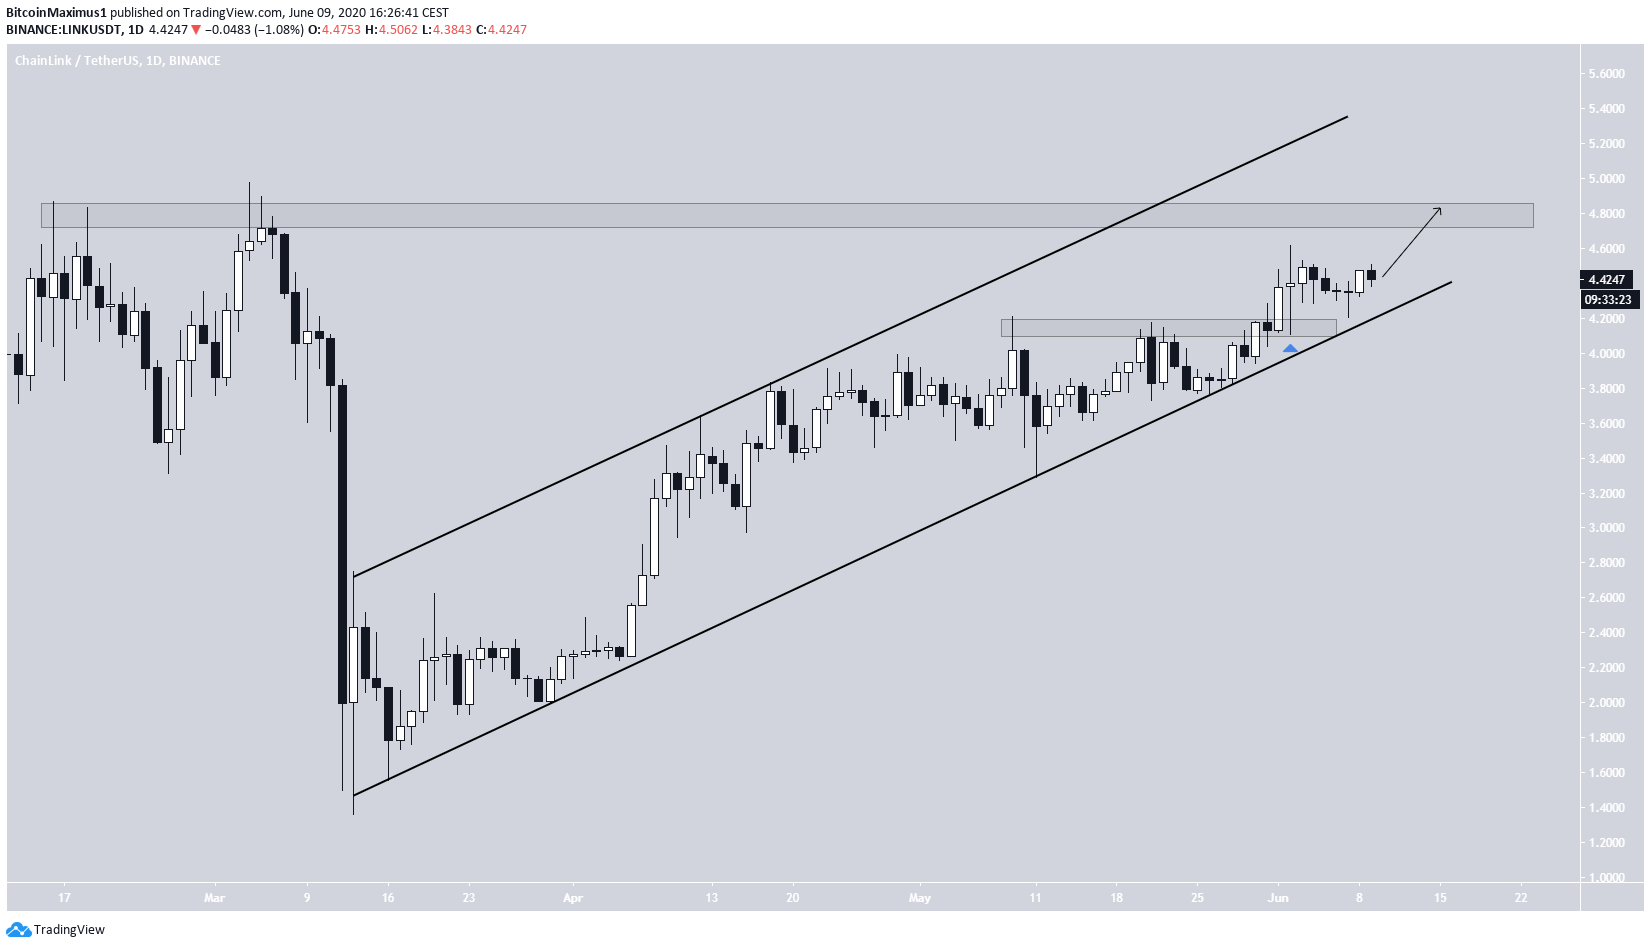
The LINK/USD pair has been trading inside a rising channel since March 13.
It showed strength by breaking out above the $4.1 area and then using that as support, creating a long upper wick in the process.
The price is expected to reach the $4.9 area, which is close to the all-time high price. A successful break out could move it towards the resistance line of the channel, which currently sits at $5.4.
At the time of writing, we cannot confidently predict whether it will break out or not. The mindful trader will have to pay attention to price movements and possible divergence when the time comes.