

Did you know that XDC Network is a bespoke Ethereum fork? The network emerged in 2019 under the tag of XinFin. As a blockchain, it is EVM-compatible and boasts the dPoS consensus — the backbone for faster transactions. Another interesting thing about this platform is the native token XDC that successfully reached and exceeded our 2023 XDC Network price prediction, with a high of $0.9, making us look at 2024 and beyond with bated breached.
This detailed XDC price prediction piece captures the project’s fundamental growth, tokenomics, and technical analysis. Is XDC — the native coin — a decent investment option? Let’s take a look.
Want to get XDC price prediction weekly? Join BeInCrypto Trading Community on Telegram: read XDC price prediction and technical analysis on the coin, ask and get answers to all your questions from PRO traders! Join now
- XDC network and the associated fundamentals
- XDC price prediction and tokenomics
- XDC network price prediction and key metrics
- XDC price and technical analysis
- XDC Network (XDC) price prediction 2023
- XDC Network (XDC) price prediction 2024
- XDC Network (XDC) price prediction 2025
- XDC Network (XDC) price prediction 2030
- XDC Network (XDC’s) long-term price prediction 2035
- Is the XDC price prediction model accurate?
This article may be outdated, we suggest you visit our new XDC Network Price Prediction tool.
XDC network and the associated fundamentals
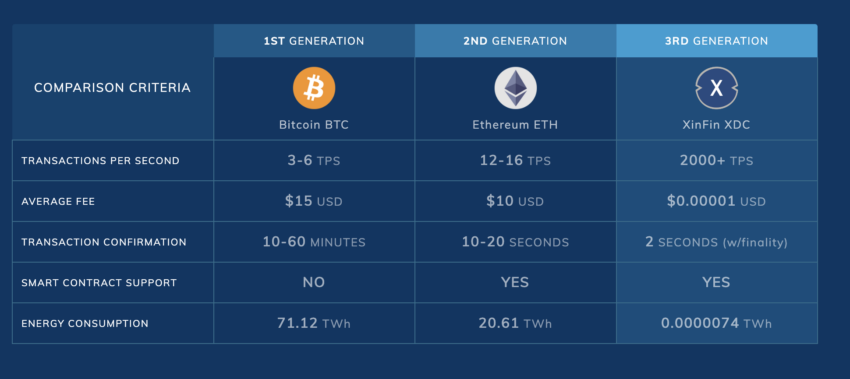
We’ve already covered a few fundamental areas where the XDC Network excels. For instance, its delegated proof-of-stake (PoS) consensus makes it ultra-fast and scalable. Here is how that helps:
- XDC Network can achieve near-zero transaction fees.
- It makes the blockchain capable of reaching more than 2000 transactions per second.
- Some proof-of-work task handling is involved for additional network security and robustness.
- The native XDC coins can be staked.
Here are some more pointers that make XDC an enticing project:
- Open-source blockchain
- Can enable relay bridges to connect with other ecosystems
- Supports instant block finality
- The architecture supports asset tokenization and smart contracts
- Developers can use the Apothem (testnet) before deploying apps on the XDC Network.
XDC price prediction and tokenomics
XDC comes with a capped supply of 37.5 billion. As of Dec. 20, 2023, almost 13.9 billion XDC coins make the circulating supply. Here is what the distribution chart looks like:
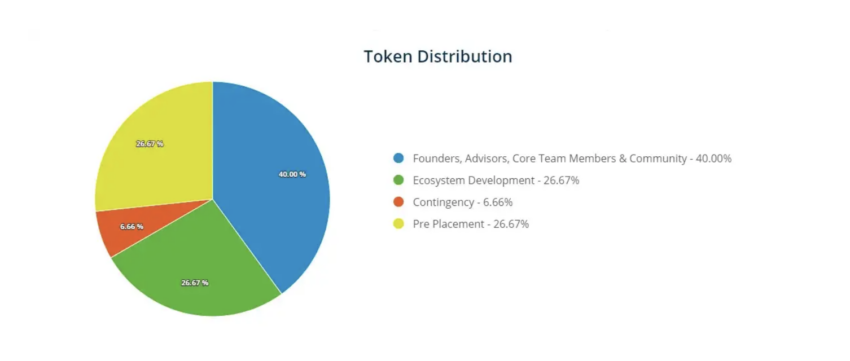
Most importantly, the 40% founder allotment section comes with a yearly 3% unlocking or vesting schedule. This approach helps keep the sell-off pressure under control. Even the ecosystem development chunk of almost 27% has a 2.5% yearly issuance cap. The slow-release mechanism explains why the circulating supply of XDC is hardly breaking out. The managed release could have positive implications for the long-term value of XDC.
Did you know? XDC Network boasts a hybrid architecture, with use-cases involving sectors like supply chain, trade finance, and more.
XDC network price prediction and key metrics
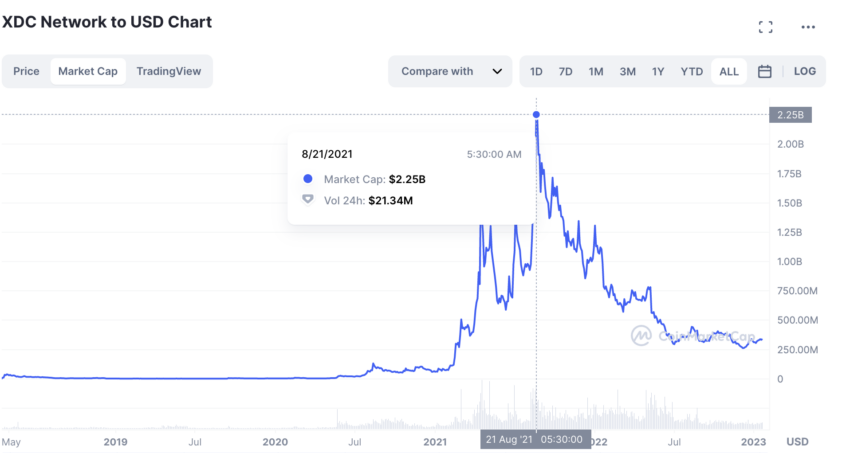
When compared to its peak market cap and trading volume, XDC dipped significantly in early 2023. At its market cap peak on Aug. 21, 2021, XDC was at $2.25 billion. The trading volume on that very day was $21.34 million. However, as of Jan. 16, 2023, the trading volume was $2.85 million, and the market cap was $338.47 million.
Yet, things got better as 2023 unraveled. Per the latest market capitalization chart, XDC’s market cap level retouched the $1.2 billion mark with a very high trading volume of $37.33 million. At present, the market cap is somewhere around the $700 million mark and making lower highs — hinting at a price correction.
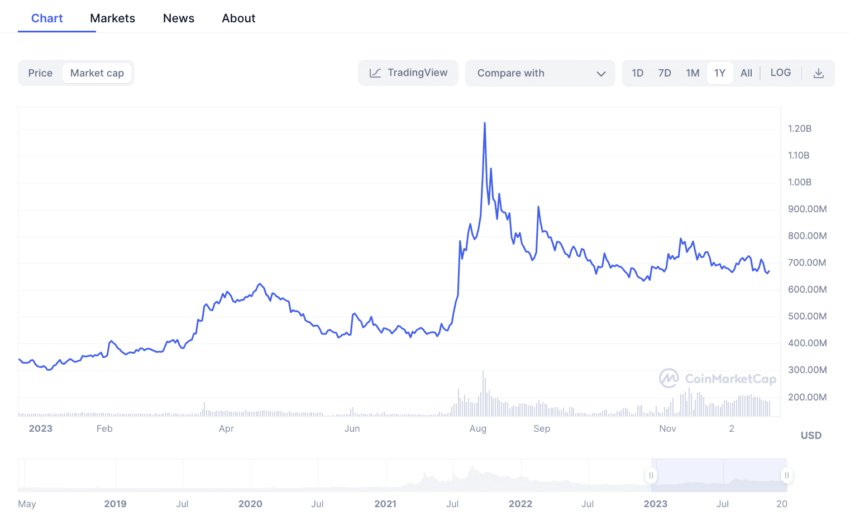
These figures suggest that the turnover ratio — trading volume/market cap — has been higher recently. This development suggests that XDC is less volatile at the time of writing.
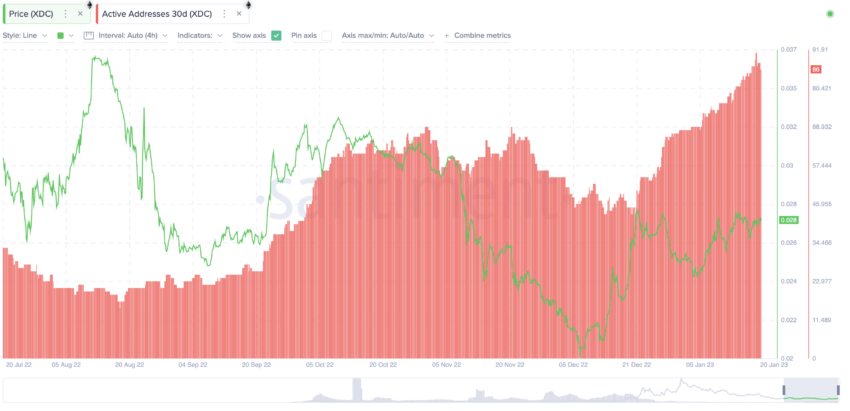
Another optimistic sign is the growth in the number of active addresses. Do note prices have also started looking up now that the active addresses were at a peak in January 2023.
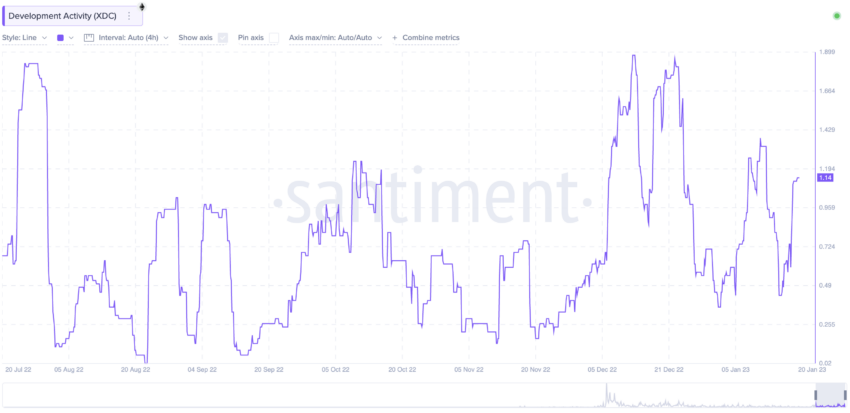
And the development activity at XDC’s counter shows things have simmered down in January 2023. Compared to the peaks made in December, the development activity is low but trying to move up. This indicates improving network adoption.
“Dreaming of bringing your blockchain-based projects to life? The XDC Network is your launchpad to success.”
Ritesh Kakkad, Co-Founder of XinFin: X
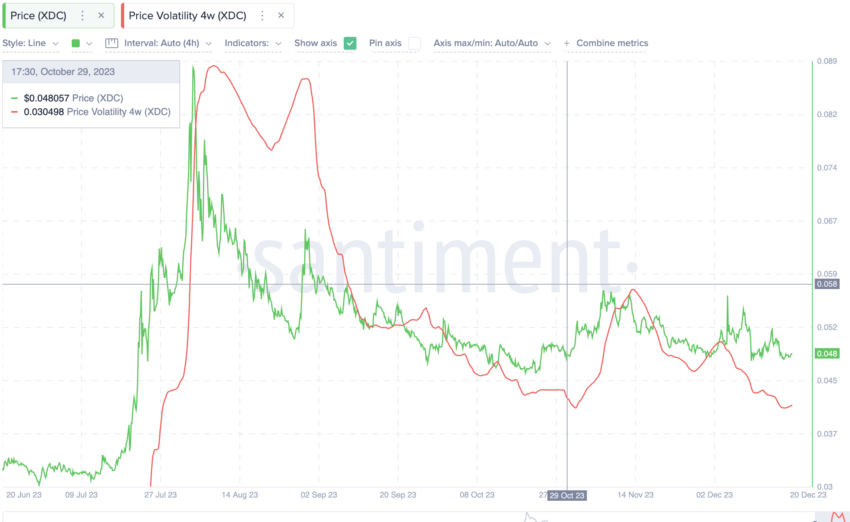
Plus, the XDC volatility metric is languishing at the bottom, hinting at a price strengthening of sorts.
XDC price and technical analysis
Clearly, XDC is fundamentally strong and benefits from a transparent tokenomics model. However, moving to technical analysis is necessary to identify the price patterns. Doing so will help us predict the price action of XDC in the short and long term.
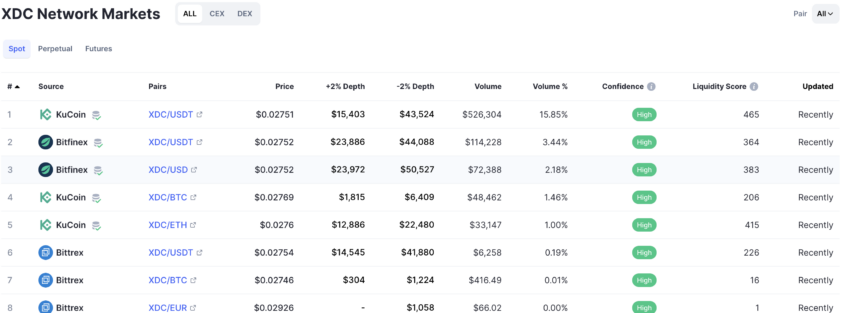
But before delving into the price analysis, we should look at a few insights that will support our calculation accuracy. Firstly, XDC has a widespread trading market, with KuCoin’s XDC-USDT pair dominating the trading volume.
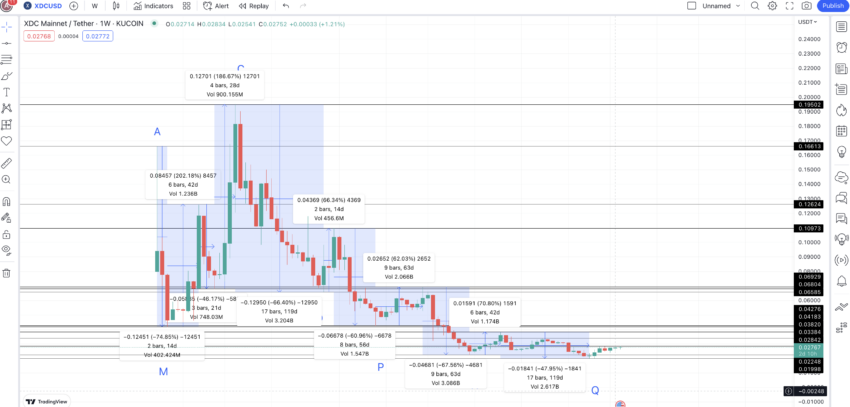
We shall use KuCoin’s XDC-USDT chart for our calculation. Here is the weekly chart:
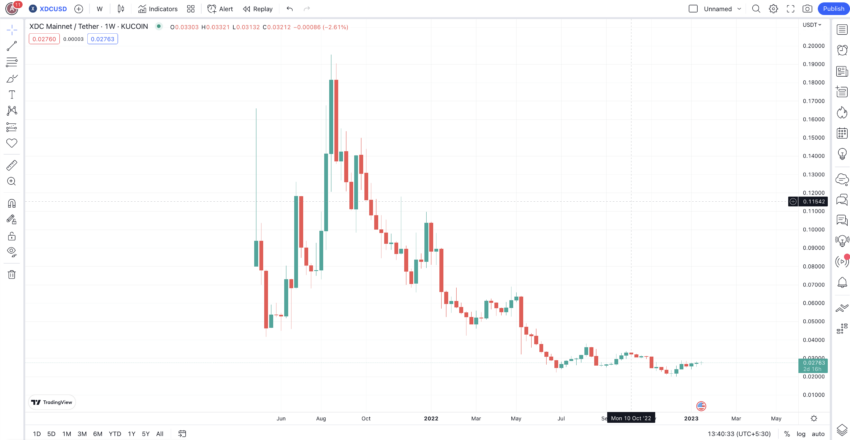
The maximum price of one XDC coin was $0.1939 — reached on Aug. 21, 2021.
Pattern identification
Looking at the weekly chart to predict the price of XDC, an interesting trend surfaces.
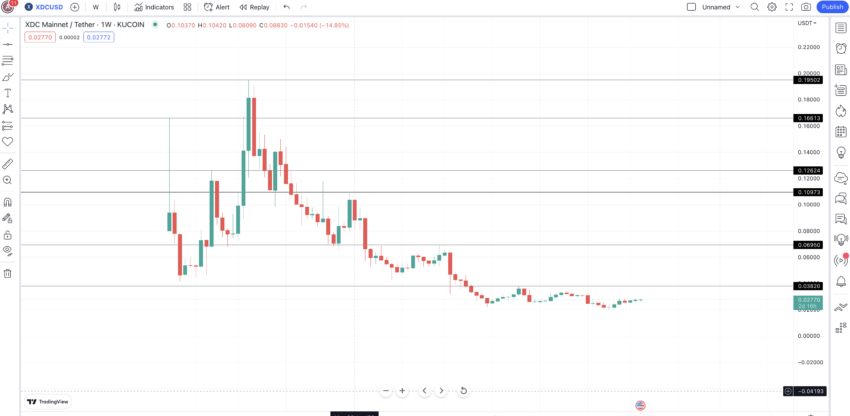
XDC starts with a high and then makes another high (lower high) before peaking at $0.1939. From there, the price of XDC has been in a clear downtrend, courtesy of all the lower highs it has been making. However, if the price rebounds and trades above the previous high, we can expect the existing pattern to conclude. And after that, the same pattern can be repeated, as per the repetitions evident in the historical data.
/Related
More Articles


Could the price of XDC move toward the immediate high or resistance level of $0.03820? Let’s head over to the daily chart to find out.
Short-term XDC price prediction: Our early 2023 analysis
Our short-term XDC Network price prediction was successful as XDC did breach the crucial resistance of $0.038 to make new 2023 highs. Here is what we covered in our early 2023 analysis:
The daily price analysis chart reveals a falling wedge — a bullish pattern keeping the current market condition in mind. Notice that XDC is trying to breach the upper trendline, which is also a bullish indication.
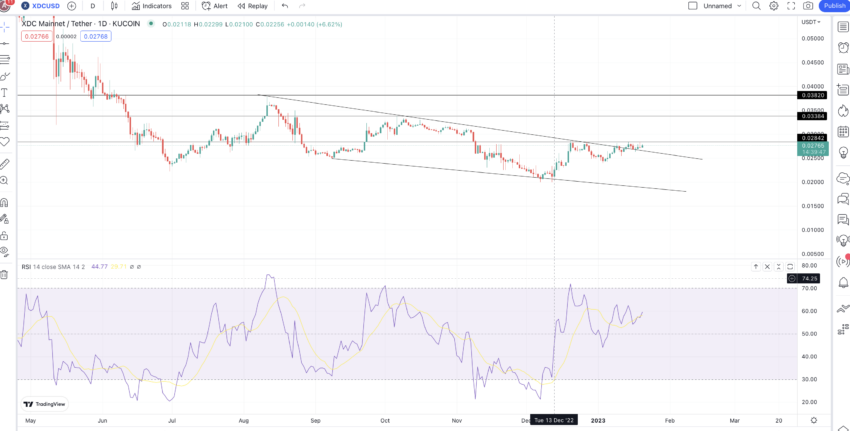
The momentum indicator or RSI must move above the last few peaks to indicate a short-term price surge. As of Jan. 27, 2022, XDC is trading at $0.0276. Any clear breach above the upper trendline could take it to the resistance levels of $0.028, $0.0338, or even the much anticipated $0.03820. Therefore, if the market conditions are right, XDC has the potential to breach the last high.
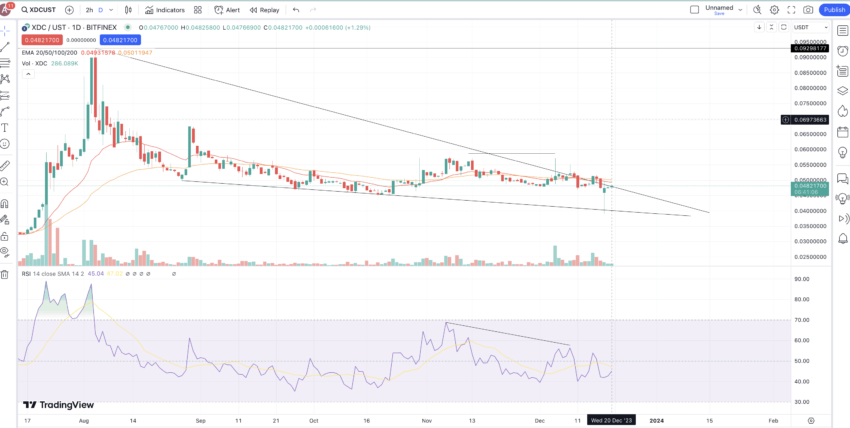
Our December 2023 short-term analysis
The falling wedge pattern associated with the XDC/UST daily chart is evident enough. And even though it is a relatively bullish pattern with the $0.052 level acting as the next crucial resistance for XDC to go up to the 2024 prediction levels, the RSI is fresh out of the bearish divergence pattern. This might lead to a quick correction at the counter, more so as the volumes are pretty low.
However, to see when this level is breached (tentatively), we need to locate the distance and price changes from the highs to lows and lows to highs.
Price change
We might be looking at a forward-moving pattern. Hence, it is appropriate to locate the price change percentages and distances from A to Q, two points simultaneously.
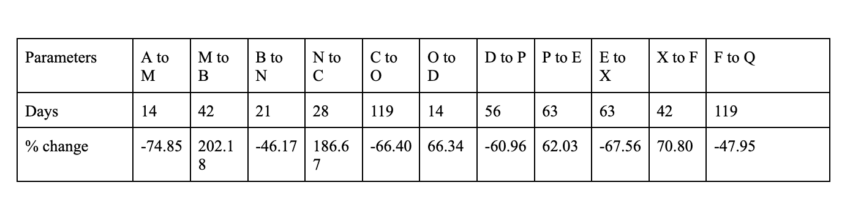
Columns with negative values signify high-to-low movements. The average timeframe and percentage change for a high-to-low move are 65 days and 60.64%. The maximum timeframe is 119 days, whereas the minimum percentage drop is 47.95%.
Columns with non-negative values signify low-to-high movements. The average timeframe and percentage hike for a low-to-high move are 38 days and 117.60%. The minimum price hike in case of a continued bearish crypto market is 62.03%. Also, the maximum timeframe is 63 days.
Now, we can consider these average values and start plotting the XDC network price prediction levels.
XDC Network (XDC) price prediction 2023
Our XDC price prediction for 2023 was spot on. XDC even exceeded the same by going as high as 2.5 times our predicted value. Even the low-level prediction for 2023 held strong, as XDC didn’t drop below $0.02. Here is what the prediction analysis read:
We have the last low at Q. Assuming that we get the next high post-that, per the historical data, the level surfaces at $0.0325. Notice that this high is still lower than the last high or F. This means that even in early 2023, we can expect the broader downtrend to continue.
The XDC price prediction low for 2023 surfaces at $0.0169. We have taken the minimum drop of 47.95% into account because XDC coins haven’t dropped this low since they started trading.
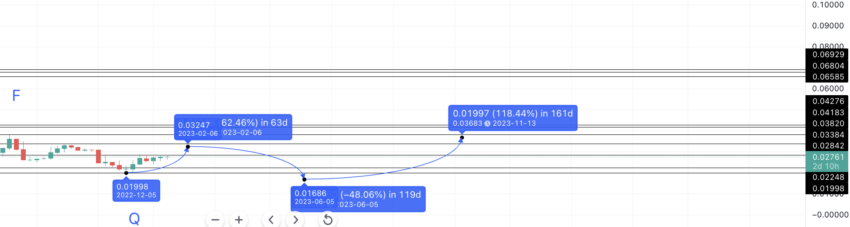
At the lowest point in 2023 — $0.0169 — we expect XDC to be under massive selling pressure. After this, we can expect a high that actually adheres to the average low-to-high values. The next high surfaces at 117.60%. However, we can expect the timeframe to differ. In a volatile market, it is difficult to pinpoint the exact location of a high or a low.
We can still expect this high to the surface by the end of 2023, as by this point, the broader crypto market may be in recovery. The maximum XDC price prediction for 2023 might therefore surface at $0.0368. This would finally break the lower-high pattern going into 2024.
XDC Network (XDC) price prediction 2024
Outlook: Bullish
As per the short-term price prediction, XDC, upon crossing the $0.034 mark, can shoot up to $0.03820. This is the level to beat as per the XDC price prediction 2024 model. However, as 2023 saw XDC move as high as $0.092, the next high could be at the immediate resistance of $0.052.
But first, we need to locate the low, post-2025 high. As per the table above and the high-to-low pointers, we can expect the next low to surface in 119 days (max distance) and at a deficit of almost 48% (from the table above). But there is a catch.
Notice that several strong support lines are in play, which might stop the price of XDC from dropping below $0.02841. This can be the XDC price prediction low for 2024.
Also, you might be wondering why we have such a conservative high prediction for 2024 now that 2023 was very bullish. Honestly speaking, we are looking at a deeper short-term correction at XDC’s counter in days to come with strong support at $0.02841. And if this support is respected, the 2024 high could go as far as $0.052.
Projected ROI from the current level: 8%
XDC Network (XDC) price prediction 2025
Notice that as mentioned previously, the next high shows up at $0.03820 — a 35.15% high. The next low can take support at the previous support level of $0.02842. Therefore, we can expect the early 2024 low to coincide with the late 2024 low.
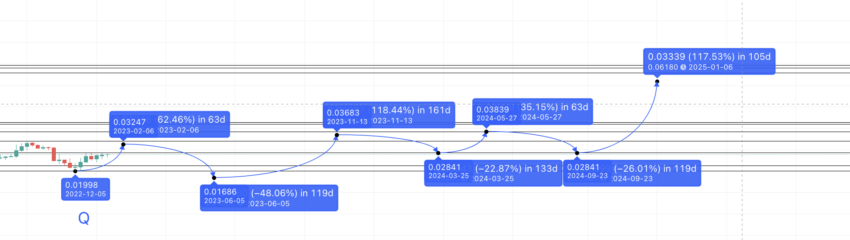
Now comes the fun part. After taking support at $0.02842, XDC might be able to move up, keeping the average price percentage value of 117.60%. And this high can slip into 2025, considering the steady growth as XDC’s counter. This level can surface at $0.06180.
Projected ROI from the current level: 28%
XDC Network (XDC) price prediction 2030
Outlook: Bullish
Now that we can see the 2025 high, the low can end up being 47.95% lower — per the above-mentioned table. Therefore, the XDC network price prediction is low for 2025 surfaces at $0.032. From this level, we can expect the XDC high for 2026 to surface at $0.0699.
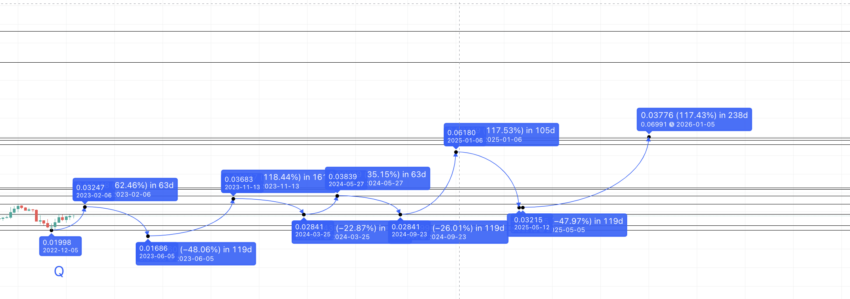
Now that we have the high for 2026 and the low for 2025, we can draw the Fib extension levels to predict the price of XDC until 2030 and beyond. This price path puts the XDC price prediction high for 2030 at $0.244.
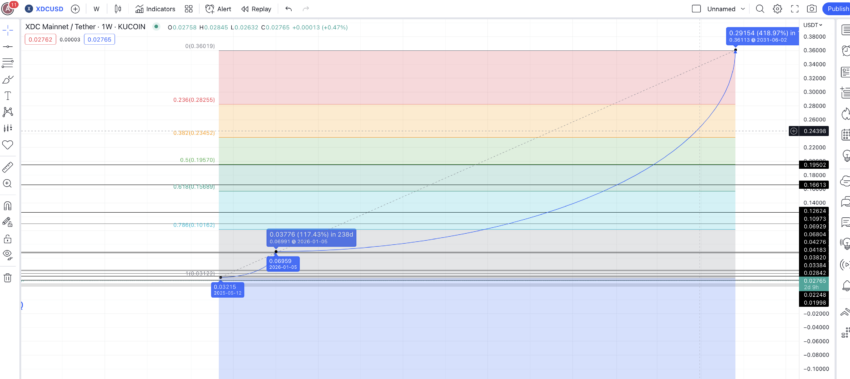
The low for 2030 can surface at $0.1939, which was the previous resistance level and XDC’s previous all-time high. Projected ROI from the current level: 408%
XDC Network (XDC’s) long-term price prediction 2035
Outlook: Bullish
Now we have the XDC price prediction levels till 2030; we can use the model to calculate the price of this smart contract-driven network until 2035. Technically, we can extrapolate the same to locate the XDC price prediction levels until 2040. However, that is beyond the scope of this discussion. Still, we have the XDC price prediction 2031 path drawn using the Fibonacci indicator.
You can easily convert your XDC to USD here
Here is a table to help you predict the price of XDC until 2035:
| Year | | Maximum price of XDC | | Minimum price of XDC |
| 2023 | $0.092 | $0.024 |
| 2024 | $0.03820 to $0.52 | $0.02841 |
| 2025 | $0.06180 | $0.032 |
| 2026 | $0.0699 | $0.043 |
| 2027 | $0.0943 | $0.058 |
| 2028 | $0.1132 | $0.0883 |
| 2029 | $0.1471 | $0.1147 |
| 2030 | $0.244 | $0.1939 |
| 2031 | $0.3611 | $0.2283 |
| 2032 | $0.3806 | $0.2359 |
| 2033 | $0.4567 | $0.3562 |
| 2034 | $0.5937 | $0.4630 |
| 2035 | $0.890 | $0.6942 |
Do note that some amount of proof-of-work consensus is involved. This makes the XDC network a more acceptable crypto asset than relying solely on PoS. Therefore, the chances of decent price action are higher. But then, the initial price action might be a bit slow; XDC is a low-key asset, and the crypto market isn’t currently all that exuberant.
Is the XDC price prediction model accurate?
This XDC price prediction model looks reliable and practical. Firstly, the technical analysis considers both short-term and long-term price moves. Secondly, this model also involves fundamental analysis and analyzes key on-chain metrics. This makes this XDC price forecast as attainable as possible in a volatile crypto market.
Trusted
Disclaimer
In line with the Trust Project guidelines, the educational content on this website is offered in good faith and for general information purposes only. BeInCrypto prioritizes providing high-quality information, taking the time to research and create informative content for readers. While partners may reward the company with commissions for placements in articles, these commissions do not influence the unbiased, honest, and helpful content creation process. Any action taken by the reader based on this information is strictly at their own risk. Please note that our Terms and Conditions, Privacy Policy, and Disclaimers have been updated.