

As the vulnerabilities of centralized exchanges (CEXs) like FTX are exposed, decentralized finance (DeFi) is increasingly seeing the popularity it deserves. But complexity hinders extensive adoption. VVS Finance plans to simplify DeFi, thus spurring adoption. We’ll explore more about its ability to do so — using fundamentals and prices alike — in this VVS Finance price prediction.
KEY TAKEAWAYS
➤VVS Finance aims to make decentralized finance (DeFi) more accessible by reducing complexity, helping drive broader adoption.
➤Growth will depend on market cycles, trading volume, and adoption rates.
➤VVS Finance’s success hinges on its ability to attract users, expand its ecosystem, and innovate in the DeFi space.
- VVS Finance (VVS’s) long-term price prediction
- VVS Finance price prediction using technical analysis
- VVS Finance (VVS) price prediction 2024
- VVS Finance (VVS) price prediction 2025
- VVS Finance (VVS) price prediction 2030
- VVS Finance price prediction: the role of fundamental analysis
- Tokenomics of VVS Finance
- How accurate is the VVS Finance price prediction model?
- Frequently asked questions
VVS Finance (VVS’s) long-term price prediction
The below data table will help predict the VVS price until 2035. Do note that the average price of VVS tokens might still change during any given year. Plus, the highs and lows only take linear growth into consideration and the appearance of standard bear and bull cycles.
| Year | | Maximum price of VVS | | Minimum price of VVS |
| 2025 | $0.000012443 | $0.000000771 |
| 2026 | $0.00001866 | $0.000000933 |
| 2027 | $0.000025 | $0.0000155 |
| 2028 | $0.00003375 | $0.00002092 |
| 2029 | $0.0000506 | $0.00003137 |
| 2030 | $0.0000628 | $0.00003140 |
| 2031 | $0.0000942 | $0.0000584 |
| 2032 | $0.0001413 | $0.0000876 |
| 2033 | $0.0001880 | $0.0000940 |
| 2034 | $0.0002350 | $0.0001457 |
| 2035 | $0.0003290 | $0.0002566 |
The price levels aren’t consistent across years. The reason is the assumption that bear and bull cycles follow each other and will hit the crypto market at least two to four times in the span of 12 years.
VVS Finance price prediction using technical analysis
Pattern identification
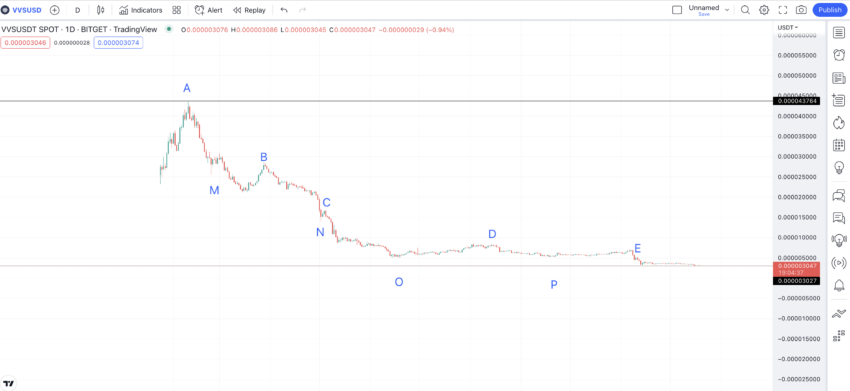
At first glance, you will see the VVS token price chart making a lower-high swing pattern. The points are marked A, B, C, D, and E.
Also, the lows between the patterns are lower lows, marked M, N, O, and P.
Now let us find the distance and price change percentage between every consecutive point on the chart to find two things:
- Is VVS Finance at its lowest, or might it correct further?
- Where can be the next high for the VVS token?
Here is the chart with all the points:
Here is the data (data set 1)
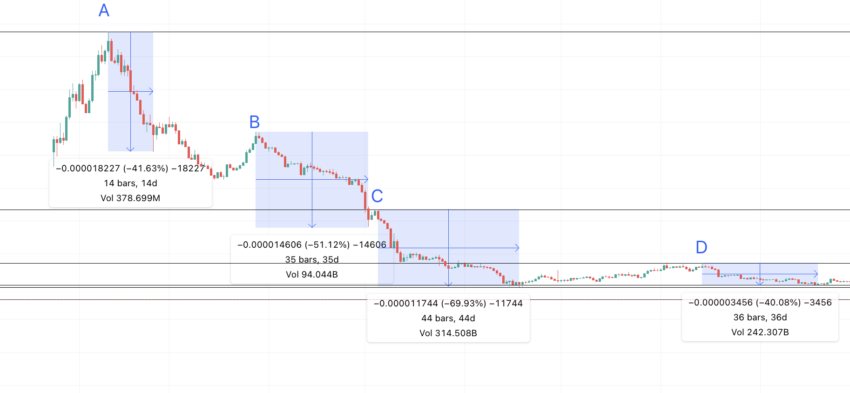
All highs to lows:
A to M = 14 days and -41.63%; B to N = 35 days and -51.12%; C to O = 44 days and -69.93%; D to P = 36 days and -40.08%
Here are the markings on the price chart:
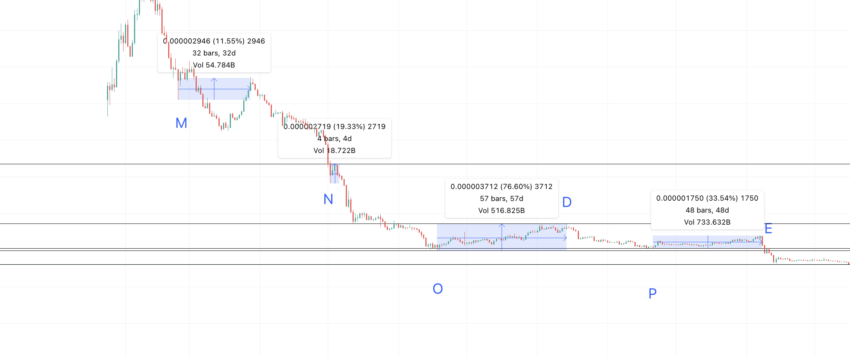
All lows to highs:
M to B = 32 days and 11.55%; N to C = 4 days and 19.33%; O to D = 57 days and 76.7%; P to E = 48 days and 33.54%
Here are the markings on the price chart:
We will use the two tables to find the next set of points.
VVS Finance (VVS) price prediction 2024
We saw higher highs in 2023, with G being higher than F. Ultimately, the continuing downtrend associated with the price of VVS finance was expected to be defeated. But, the current market conditions justified the modest high of $0.000004666.
Calculations
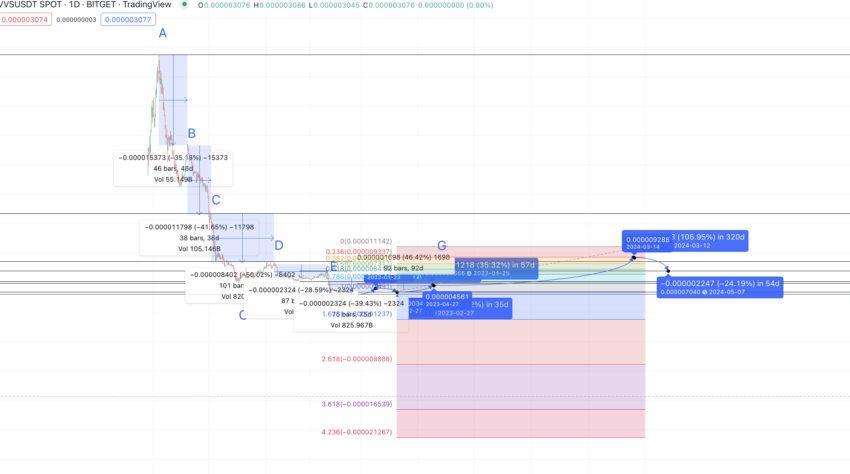
We calculated the distance between the peaks to see how long it took for the next peak to form.
Here is the data for that (data set 3):
A to B = 46 days; B to C = 38 days; C to D = 101 days; D to E = 87 days; E to F = 75 days; F to G = 92 days
So, from G, it was expected to take VVS a maximum of 101 days to form a new high. The bear market pushed the timeline further.
We connected the last low and the last high via the Fib levels. We followed the same path from the last low to F. This projected path put the VVS price prediction 2024 level at $0.000009395.
VVS Finance (VVS) price prediction 2025
Outlook: Moderately bullish
Using data set 1, the maximum high percentage can be 76.60%. Therefore, from the last 2024 low $0.000009395, the next high (assuming that’s in 2025) can surface at $0.000012443.
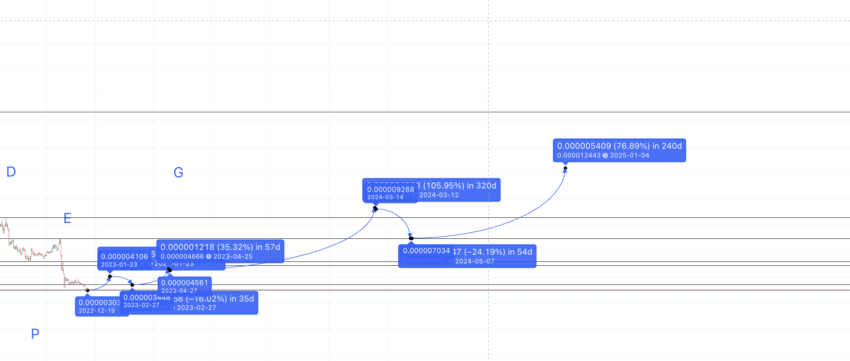
So, the VVS finance price prediction for 2025 places the high at $0.000012443.
Projected ROI from the current level: 236%
VVS Finance (VVS) price prediction 2030
Outlook: Bullish
Now, we can connect the last low, $0.000000704, and the last high, $0.000012443, using the Fib indicators. This calculation indicates we can expect the price of VVS to reach $0.000025 by mid-2027. Let’s assume the growth percentage from 2025 to 2027 is over 100%. This would mean the VVS price prediction for 2030 could be 150% higher than the 2027 level.

Therefore, the maximum price of VVS finance in 2030 can go as high as $0.0000628, breaching its chart high of $0.000043764.
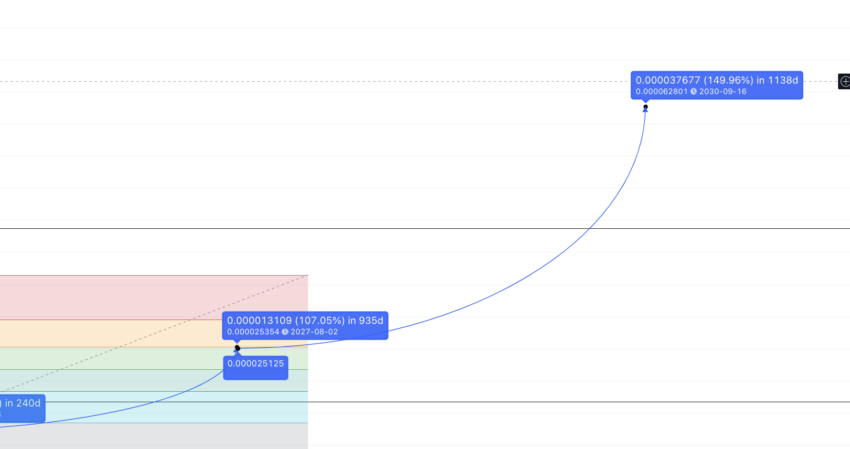
Projected ROI from the current level: 1597%
VVS Finance price prediction: the role of fundamental analysis
To understand the thought and technology behind this DeFi platform, there’s no better place to start than with fundamental analysis.
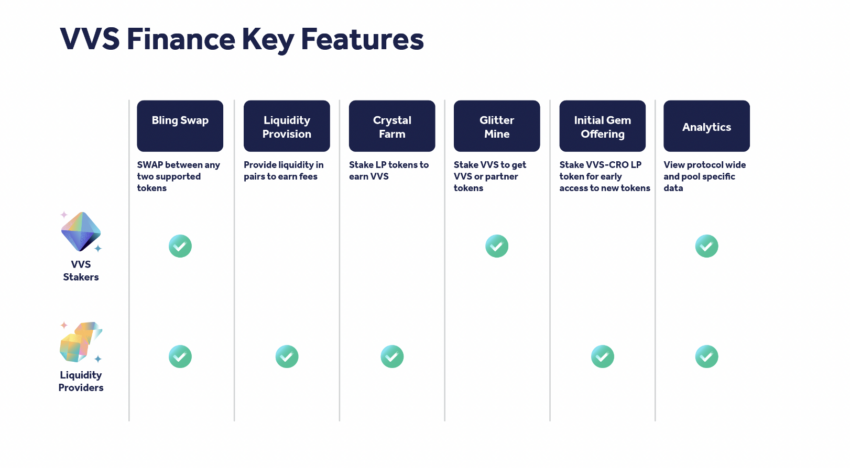
For starters, VVS Finance relies on an AMM (automated market maker) for the initial supply of liquidity needed for DeFi operations. As for features, it currently supports token swapping and staking.
What sets VVS Finance apart from other protocols is its usage of the “Constant Product Formula” for managing the liquidity of pools. Simply put, this aims to keep a token sum intact before and after the swap in any given pool.
Did you know? VVS Finance also allows users to earn VVS tokens and amass partner tokens. Users also get early access to certain projects and benefit from access to enriching data analytics.
Tokenomics of VVS Finance
VVS Finance has a flattening “Emission” tokenomics model. The initial supply stood at 50 trillion; henceforth, half of the previous year’s token standing would be added up. Therefore, scarcity might kick in when the token issuance drops.
Here are the key things to note about the tokenomics of VVS Finance:
- VVS Finance might reach its capped supply mark in approximately ten years from the launch — 2031.
- 23% of the tokens will go to the VVS Finance team, whereas 50% will move to the community.
- No community vesting period is involved (except tokens allocated for future initiatives); therefore, nothing immunizes the price of VVS against rapid sell-offs if and when it happens.
- Team tokens follow a 4-year long vesting schedule.
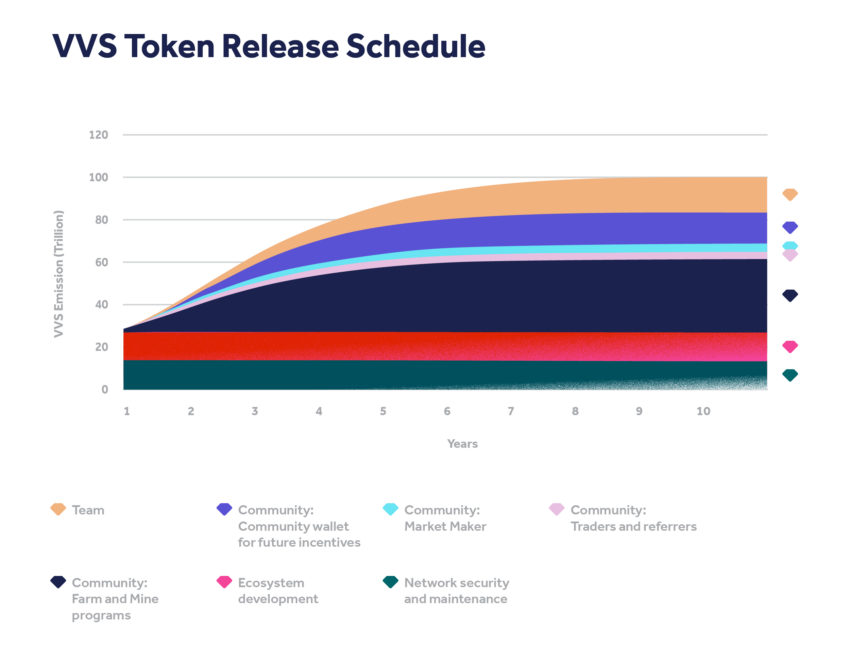
Overall, the tokenomics looks good, barring the lack of a detailed community-specific vesting schedule. Also, once the capped supply is reached, we can expect the VVS Finance price prediction model to pick up the pace.
How accurate is the VVS Finance price prediction model?
Our VVS Finance price prediction model takes fundamentals, on-chain metrics, technical analysis, and tokenomics into consideration. Also, we have successfully identified a trend or pattern, which makes this price prediction piece practical and well-tested. Yet, the future of VVS finance will depend on the growth of DeFi and how quickly the VVS token starts developing new use cases and talking points. Of course, the state of the crypto market is also a factor, with bulls and bears able to hold significant influence over token pricing.
Disclaimer: This analysis pertains to VVS Finance (VVS) and its market trends. Cryptocurrency investments, including VVS, are speculative and highly volatile. Always conduct your own research (DYOR) and consult a financial advisor before making investment decisions.
Frequently asked questions
Is VVS a good investment?
Does VVS finance have a future?
Is VVS related to crypto.com?
Is VVS inflationary?
Disclaimer
In line with the Trust Project guidelines, the educational content on this website is offered in good faith and for general information purposes only. BeInCrypto prioritizes providing high-quality information, taking the time to research and create informative content for readers. While partners may reward the company with commissions for placements in articles, these commissions do not influence the unbiased, honest, and helpful content creation process. Any action taken by the reader based on this information is strictly at their own risk. Please note that our Terms and Conditions, Privacy Policy, and Disclaimers have been updated.


