

Video content is winning the internet. Reels, long-form explainers, streaming games; the list goes on. Yet, while the popularity of video continues to reach new heights, challenges remain, including the high cost of content delivery and subpar streaming quality. Content creators lack the relevant infrastructure to push out content themselves and hence need to rely on middlemen. Theta Network aims to solve that with its decentralized approach to content creation, streaming, and more. This THETA price prediction piece will explore the network’s potential and consider its merits as a short and long-term investment.
- THETA price prediction using fundamental analysis
- THETA price movements using tokenomics
- Theta network price prediction using market cap and market sentiment
- Theta network on-chain metrics and price movements (2022-23 evaluation)
- THETA price prediction using technical analysis
- Theta Network (THETA) price prediction 2023
- Theta Network (THETA) price prediction 2024
- Theta Network (THETA) price prediction 2025
- Theta Network (THETA) price prediction 2030
- Theta Network (THETA) long-term price prediction until 2035
- How accurate is the THETA price prediction?
- Frequently asked questions
Want to get THETA price prediction weekly? Join BeInCrypto Trading Community on Telegram: read THETA price prediction and technical analysis on the coin, ask and get answers to all your questions from PRO traders! Join now
THETA price prediction using fundamental analysis
Theta Network has a simple use case. It aims to bring video streaming to web3, changing the current stead of video content delivery by minimizing dependency on centralized servers. Theta utilizes blockchain and creates a mesh network that works peer-to-peer (P2P).
Here is what the standard architecture looks like:
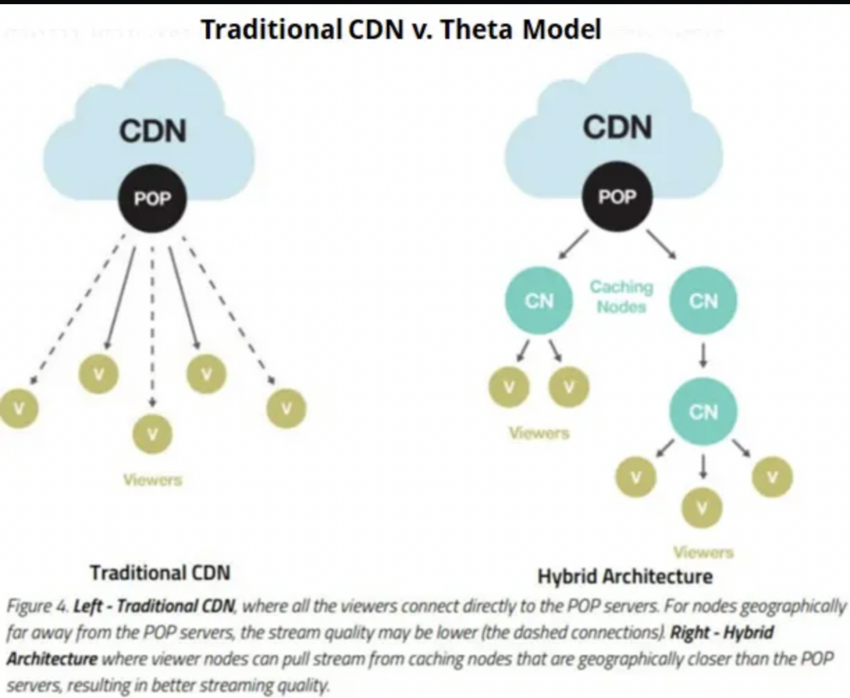
Also, the Theta network comprises a Theta TV — something like YouTube or Twitch. This is supported by a Theta blockchain that relies on Edge nodes to offer a backbone for this ambitious web3 video streaming vision.
Here are some of the other insights that might help you gauge Theta Network’s popularity as a content delivery network:
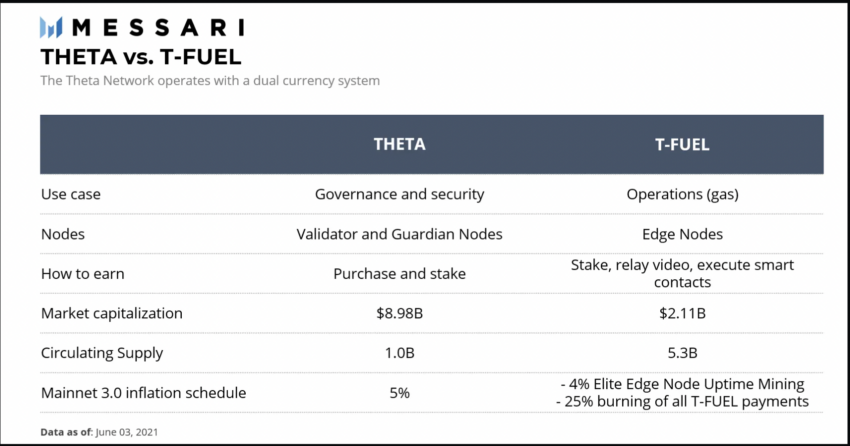
- There are two native tokens involved: TFUEL and THETA (actually now a coin). The latter supports staking and helps secure the network. And with staking support comes rewards. TFUEL acts as the juice that’s needed to run the network.
- Mainnet 4.0 showed up on Dec. 1, 2022, introducing an unlimited subchain functionality and improved scalability.
- THETA started as an ERC-20 token before transitioning to its own mainnet.
With video content taking center stage, the market sentiments surrounding the Theta Network look positive. Once the bull market kicks in 2024, the THETA coin could show some aggressive movements.
THETA price movements using tokenomics
THETA has a supply cap of 1 billion coins.
Did you know? The issuance rate, as per the Mainnet 3.0, is a standard 5%
The best part about THETA is that 100% of the total supply makes the circulating supply and offers 100% liquidity.
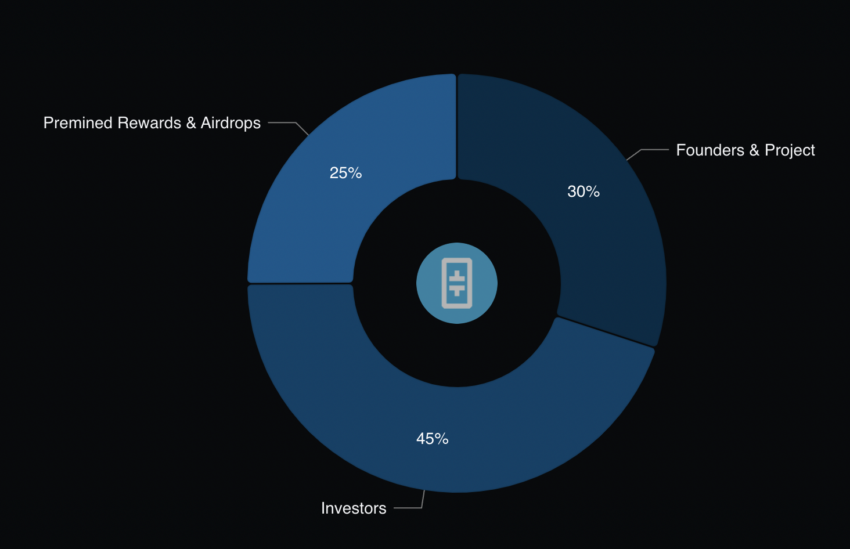
The current coin holdings look transparent, with investors holding most of the supply.
Theta network price prediction using market cap and market sentiment
THETA’s market cap peaked at $14.24 billion in April 2021. The trading volume at that time was $684.90 million. This brings the turn-over ratio (trading volume to market cap) to $0.048. As of Dec. 24, 2022, the trading volume and market cap were $4.09 million and $777.66 million, bringing the turn-over ratio to 0.0052.
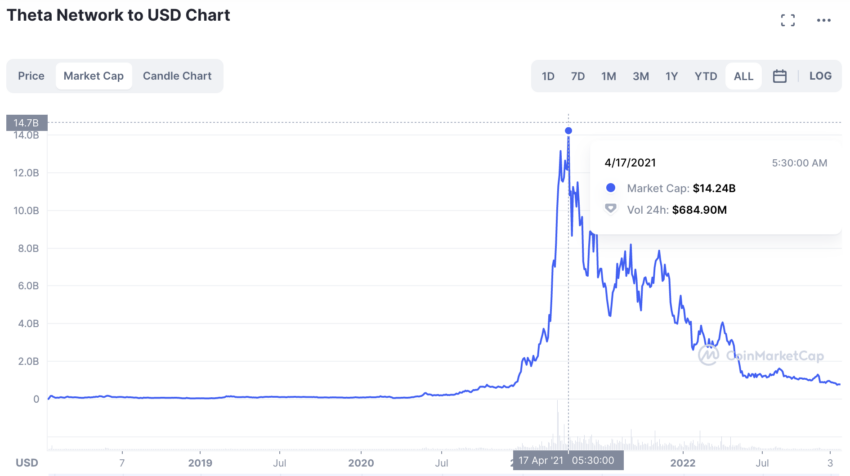
The turnover ratio during the peak was ten times higher than it was in 2022. This means THETA was particularly volatile in 2022, which explains the sideways price movement.
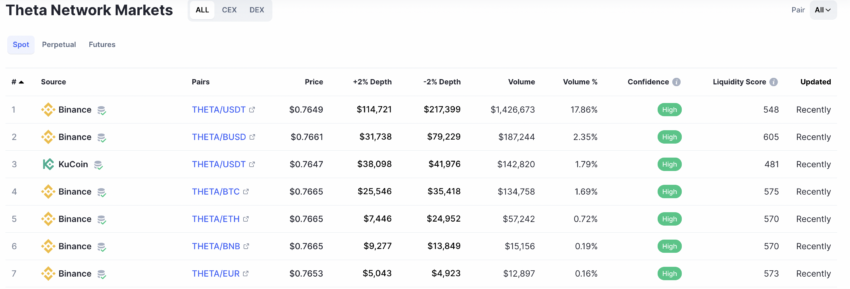
The coin has a relatively robust spot trading market spread as of December 2022, with the THETA-USDT pair holding the most volume. The liquidity across exchanges is also decent. This stands for positive marker sentiments and might offset some of the negative effects surrounding volatility.
Even in 2024, THETA trades seamlessly on leading exchanges like Binance, OKX, KuCoin, and more.
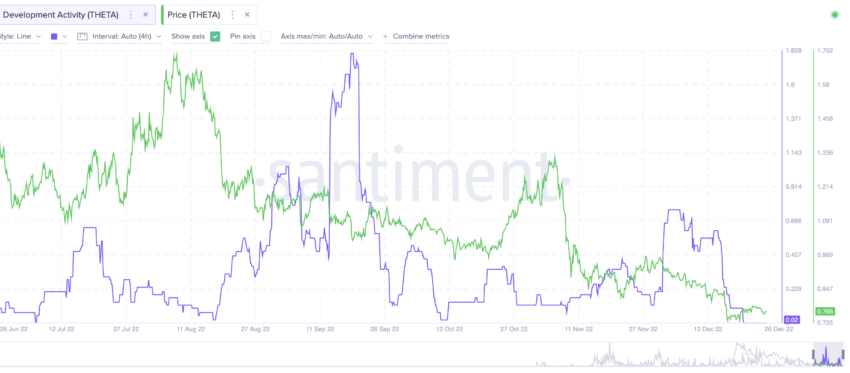
Theta network on-chain metrics and price movements (2022-23 evaluation)
The development activity across the Theta Network peaked in September 2022. However, the prices didn’t respond similarly.
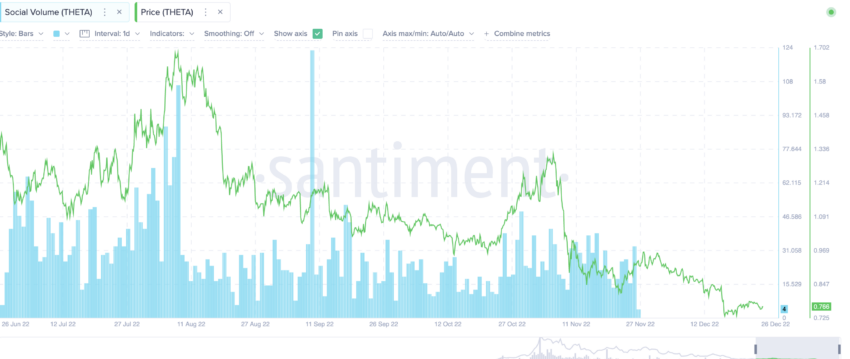
Even the social volume shot up during September 2022, but a steady price decline followed. However, things were different during the social volume rise in early August 2022 when the prices responded positively.
THETA price prediction using technical analysis
Before we delve into the price movements of the THETA coin using detailed technical analysis, here are a few pointers.
- The all-time high price of the THETA coin is $15.90, which it reached on April 16, 2021.
- The minimum price of THETA — $0.0397 — surfaced on March 13, 2020.
- THETA was trading at $0.7634 (as of Dec. 25, 2022), down 95.20% from its all-time high and since then has surged by over 100%.
Here is the weekly price chart for pattern identification. Using this, we can track the short-term and long-term price movements of the THETA coin.
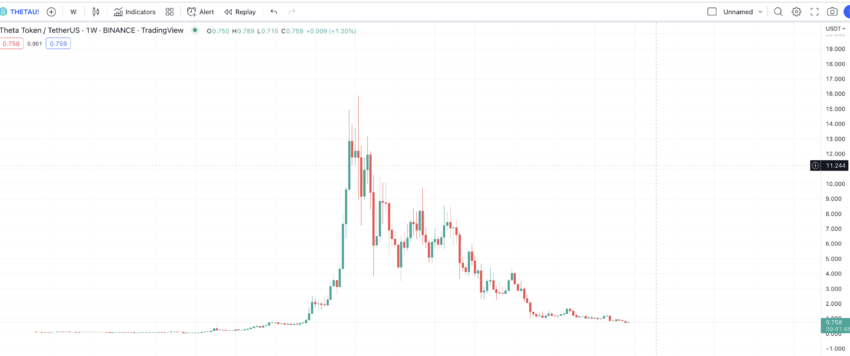
Patterns and price changes
THETA shows two patterns inside a single weekly chart view. If you zoom out, you will see a period of rangebound movement followed by a small high and a peak. This is followed by a swing high pattern of lower highs, which is now followed by another range-bound period.
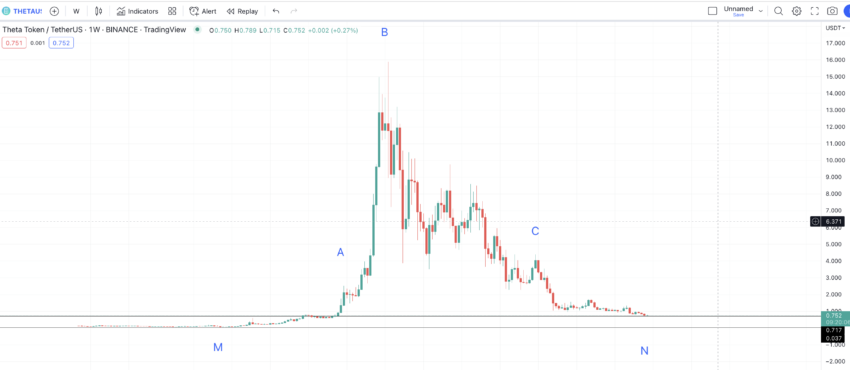
This swing-high pattern also shows five lower highs to establish the continuing downtrend at THETA’s counter. The first step is to locate where the current range-bound move will translate to the next high.
Pattern 1
For that, let us focus on pattern one and mark the points as follows:
The bigger pattern shows that THETA started trading and made a low at M, then peaked at A, made a low at O, and then peaked at B. It then dropped to P, made a high at C, and then bottom at N. We assume that the recent low for THETA is in, and it surfaces at N.
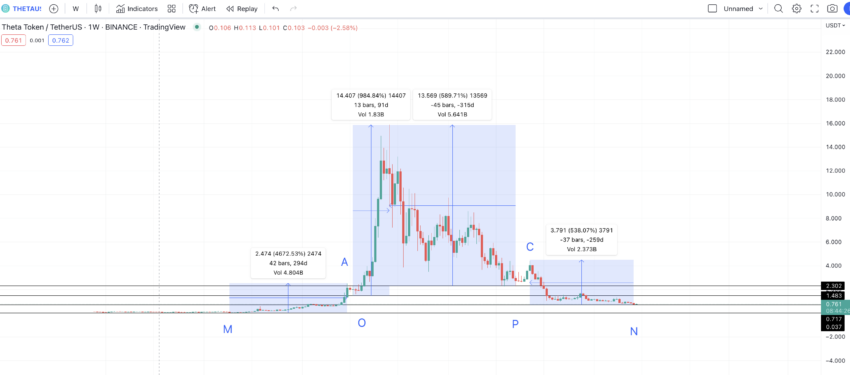
Now we must find the distance and price changes from the lows to the highs.
Data set 1 is as follows: M to A = 294 days and 4672.53% price change; O to B = 91 days and 984.84% price change; P to B = 315 days and 589.71% price change; N to C = 259 days and 538.07% price change.
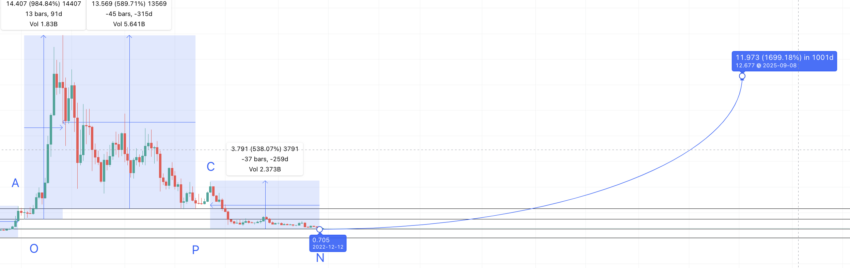
Now the average distance and price change using Table 1 comes to be: 240 days and 1696.28%. Also, note that while the move to the peak took 91 days (O to B) in the bull market, things are expected to be different in the bear market.
According to a Grayscale report, it takes almost 1177 days from the bear cycle bottom to reclaim the all-time high of the previous bull. Therefore, as per THETA’s price analysis, it might take over three years to move from N to the previous peak at B, which is over 2000%. The broader pattern puts the THETA price prediction 2025 high at $12.67. We are assuming that it takes 1000 days to move up 1696.27%.
Pattern 2
We have now established a long-term price projection for THETA. So, we can look at the swing high pattern and see the levels it might form in 2023.
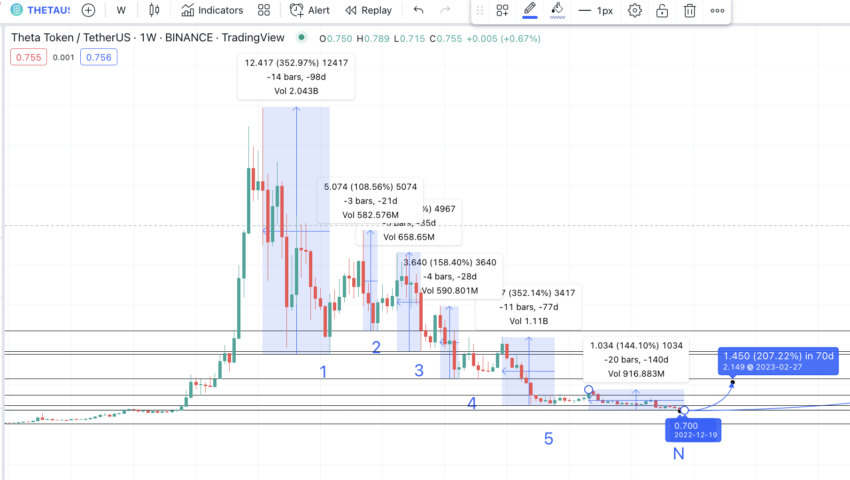
So let us plot all the swing highs from B to the way down and see the average distance and price change percentage between them and their respective lows:
N to P = 140 days and 144.1% price change; 5 to L = 77 days and 352.14% price change; 4 to Z = 28 days and 158.40% price change; 3 to Y = 35 days and 135.42% price change; 2 to X = 21 days and 108.56% price change; 1 to B = 98 days and 352.97% price change.
Now the average low-to-high distance and price change come to be: 67 days and 208.60%
Therefore, if we plot the same path from N, the point might show up at $2.149 and by March 27, 2023. The low in 2023 can be at $0.968, which is a strong support level and coincides with the low (5).
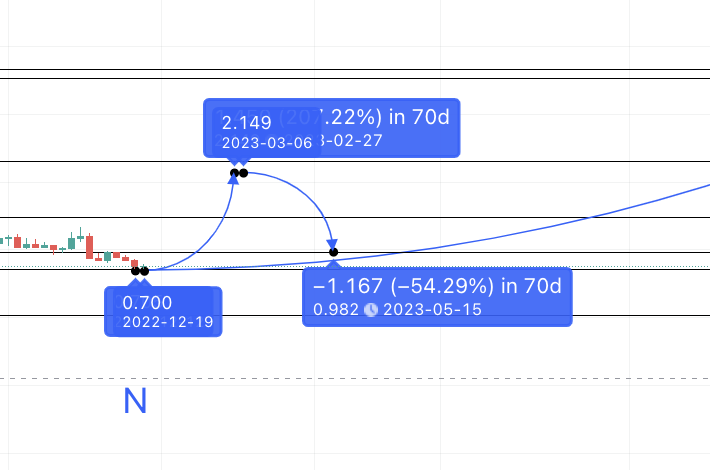
Theta Network (THETA) price prediction 2023
Do note that THETA came close to breaking our original 2023 price prediction level of $2.149. Here is how we analyzed the price movement:
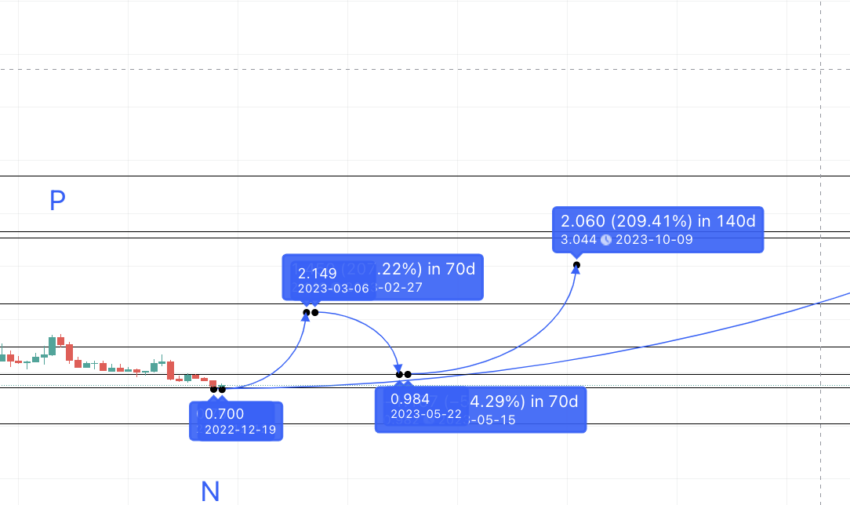
Data from the previous segment puts the 2023 high at $2.149. The low in 2023 might surface at $0.968. We can draw another forecast line from the low of $0.968 and extend the same to 140 days and 208.60%. This indicates that we might get another high in 2023 at $3.00.
Theta Network (THETA) price prediction 2024
Outlook: Bullish
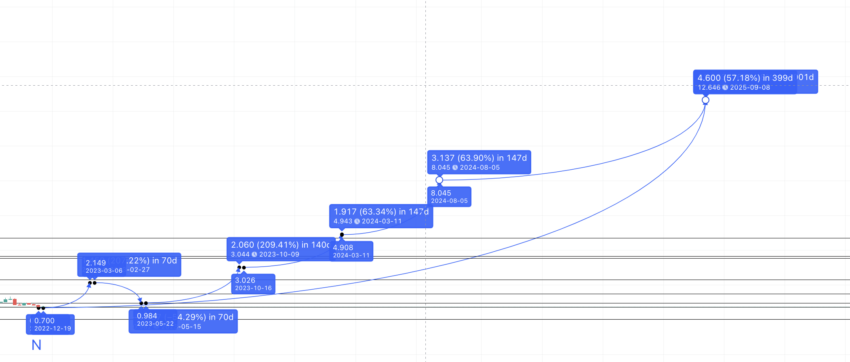
The forecast line from the high of 2023 gives the THETA price prediction for 2024, surfacing at $4.93 (image in the next segment).
However, if the network experiences wider adoption, we can expect another price surge of 63.91% within 97 to 147 days. That would give us the THETA network price prediction level of $8.045. The minimum price of THETA in 2024 can go as low as $4.70, which aligns with a strong support zone.
Projected ROI from the current level: 302%
Theta Network (THETA) price prediction 2025
Outlook: Bullish
Now, to find the price movements of THETA as per the THETA price prediction for 2025, we need to plot the distance and price changes between the highs as part of the previous pattern:
Data set 3 is as follows: P to L = 133 days and 160.97% price change; L to Z = 91 days and 35.78% price change; Z to Y = 63 days and 44.54% price change; Y to X = 49 days and 13.83% price change; X to B = 147 days and 64.43% price change.
The average distance and price difference between the peaks come out to be: 97 days and 63.91%. The number of days can go as high as 147, depending on the existing state of the crypto market.
Remember that we used pattern 1 to project the 2025 level in advance at $12.67. And do note that this level is at a 60% high from the high of 2024, which aligns with our calculations.
Projected ROI from the current level: 533%
Theta Network (THETA) price prediction 2030
Outlook: Bullish
If THETA follows the same path, the high in 2026 might surface at $20.69. The low that year can be at $15.90 — which would then be THETA’s last all-time high.
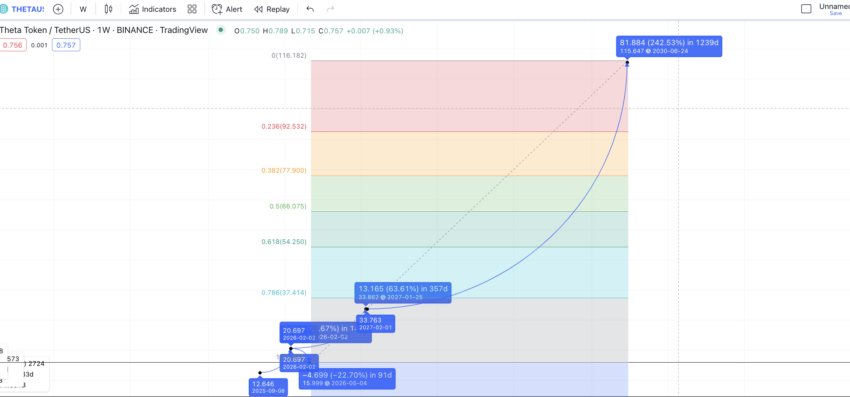
Using data set 3, we can plot the THETA price prediction level for 2027 at a high of 63.91% or at $33.86. We can take the low of 2026 and the high of 2027. Then, we can connect the Fib indicator to project price movements to 2030. The Fib extension levels put the THETA price prediction for 2030 at $115.647.
Projected ROI from the current level: 5682%
Theta Network (THETA) long-term price prediction until 2035
For long-term THETA price predictions, the table below can shed some light.
You can easily convert your THETA to USD
| Year | | Maximum price of THETA | | Minimum price of THETA |
| 2024 | $8.045 | $1.5 |
| 2025 | $12.67 | $7.85 |
| 2026 | $20.69 | $15.90 |
| 2027 | $33.86 | $26.41 |
| 2028 | $50.79 | $39.61 |
| 2029 | $68.45 | $53.39 |
| 2030 | $115.65 | $71.70 |
| 2031 | $173.47 | $107.55 |
| 2032 | $216.84 | $169.13 |
| 2033 | $281.89 | $291.87 |
| 2034 | $422.83 | $329.80 |
| 2035 | $570.83 | $445.24 |
How accurate is the THETA price prediction?
This THETA price prediction model is realistic. We have studied the price analysis of THETA, keeping the short and long-term price action in mind. Plus, we take the fundamental analysis, tokenomics, and on-chain metrics into account, making this a wholesome representation of future price movements. As always, the low and high price levels might vary depending on the state and volatility of the cryptocurrency market.
Frequently asked questions
What will THETA be worth in 2025?
Is THETA a good investment 2024?
Is THETA worth investing in?
Can THETA network reach 100 dollars?
Is THETA good for long term?
Disclaimer
In line with the Trust Project guidelines, the educational content on this website is offered in good faith and for general information purposes only. BeInCrypto prioritizes providing high-quality information, taking the time to research and create informative content for readers. While partners may reward the company with commissions for placements in articles, these commissions do not influence the unbiased, honest, and helpful content creation process. Any action taken by the reader based on this information is strictly at their own risk. Please note that our Terms and Conditions, Privacy Policy, and Disclaimers have been updated.


