

Builders looking to create decentralized applications (DApps) require data. However, locating, indexing, and organizing data on blockchains is a complex process. The Graph protocol aims to change this and make data indexing easy, courtesy of an extensive network of indexers. And GRT — the Graph’s native token — incentivizes these willing participants. But is GRT a good investment? We determine that — and more — in this The Graph price prediction.
As a protocol, The Graph offers a solution to the pressing problem of data indexing. And with this, DApps, even involving DeFi, can be built quickly and effectively. Let’s delve deeper into this GRT price prediction and consider the fundamentals, on-chain, and technical analysis of this project.
Want to get GRT price prediction weekly? Join BeInCrypto Trading Community on Telegram: read GRT price prediction and technical analysis on the coin, ask and get answers to all your questions from PRO traders! Join now
- GRT price prediction using fundamental analysis
- The Graph price prediction and tokenomics
- GRT performance analysis
- GRT market cap and trading volume comparison
- The Graph price prediction using on-chain metrics
- The Graph price prediction using technical analysis
- The Graph (GRT) price prediction in 2023 and 2024
- The Graph (GRT) price prediction 2025
- The Graph (GRT) price prediction 2030
- The Graph (GRT) long-term price prediction until 2035
- Is the GRT price prediction accurate?
- Frequently asked questions
This article may be outdated, we suggest you visit our new The Graph Price Prediction tool.
GRT price prediction using fundamental analysis
The Graph protocol is useful for data querying and indexing. It also allows DApps to access data via open APIs. Once we begin to see an inflow of blockchain DApp developers — regardless of the programming language — the adoption of The Graph may jump significantly.
Here are a few more noteworthy points:
Did you know? GRT is an ERC-20 token built on the Ethereum blockchain.
- Ethereum-specific apps like UniSwap and ENS have already used open APIs relevant to The Graph protocol.
- The blockchain has a trusted and detailed indexer incentivizing system, keeping the participants happy.
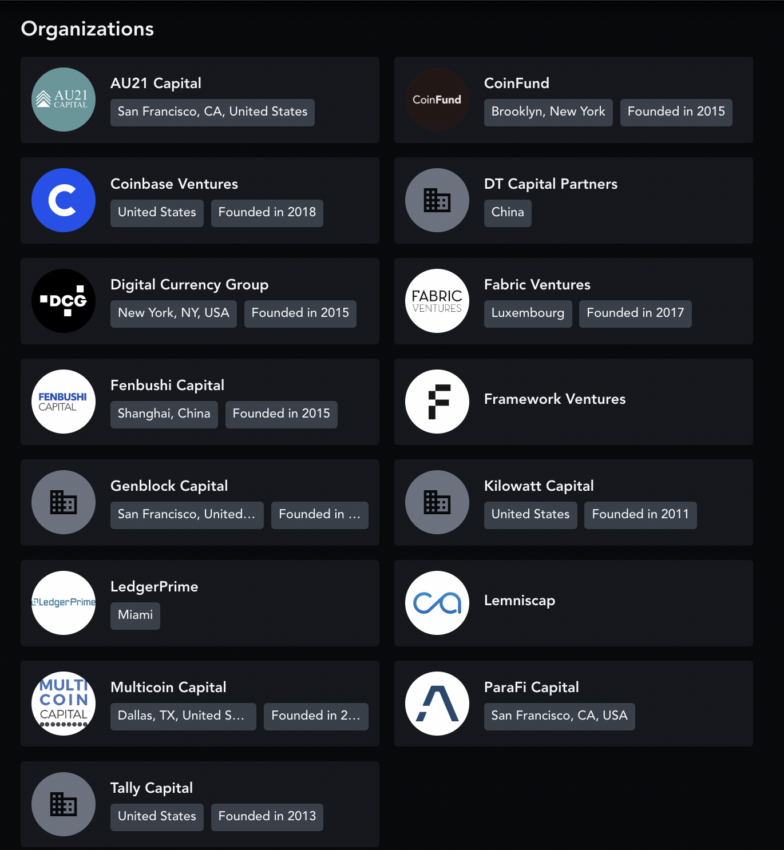
- The Graph has an extensive lineup of investors, including Coinbase Ventures.
- Esteben Ordano — founder of Decentraland — is a project advisor.

- GRT is the work token for The Graph protocol and is meant to be paid as a service or indexing work fee.
- It is a proof-of-stake crypto; hence, it has a higher chance of adoption owing to its environmentally sound stance.
The fundamentals look robust for The Graph as the tech-heavy ecosystem might cater to more developers in the future.
The Graph price prediction and tokenomics
Before we delve deeper into The Graph’s tokenomics, here is what the working token model looks like:
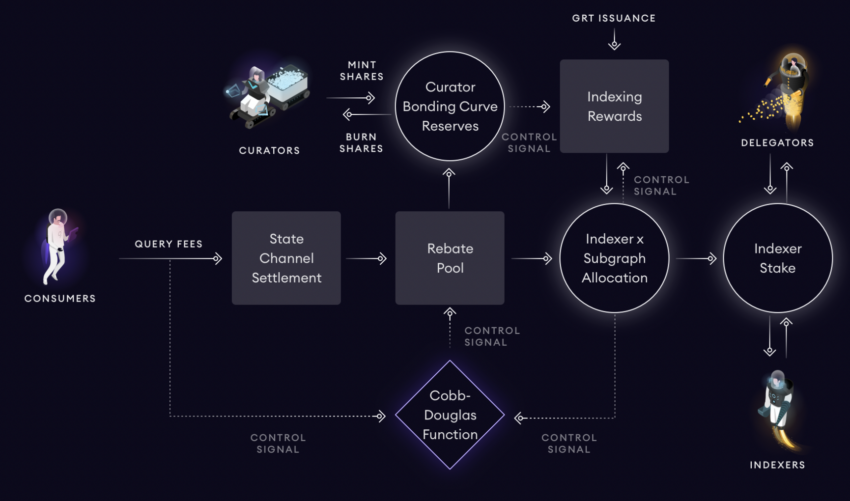
Do note that consumers pay GRT or fees, whereas Curators, Delegators, and Indexers receive the pay.
The overall token supply stands at 10 billion, and the ecosystem experiences a 3% issuance annually for payment to indexers. This issuance is in addition to the 10 billion tokens. However, it’s not all inflation, as GRT also uses token burning to keep the issuance in check.
At present, over 90% of the total supply is in play as the GRT circulating supply. For token burning to become significant, greater adoption of The Graph technology is needed.
GRT performance analysis
The network condition, as of December 2022, reads as follows:
- 200+ indexers;
- 400+ curators;
- 3000+ developers;
- 2,300+ open APIs in play.
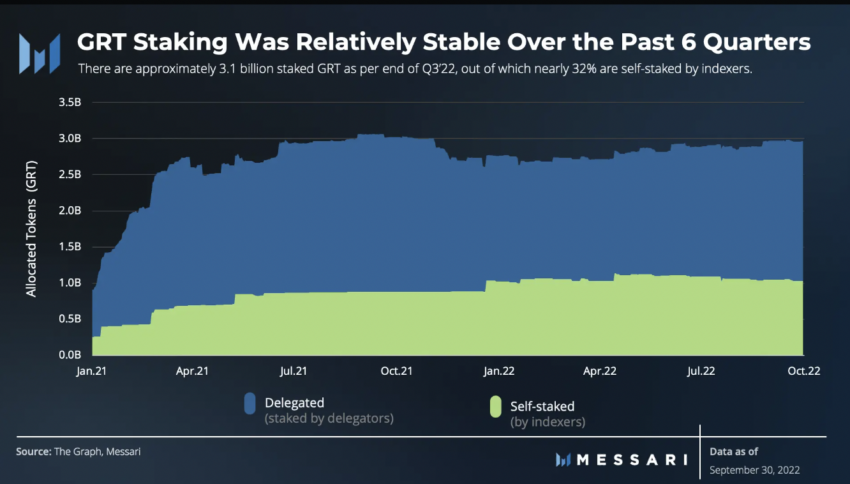
According to Messari’s “State of the Graph” report, the Q3, 2022 performances were pretty sound. Highlights include:
- A 42% increase in QoQ in the GRT revenue, suggesting an increase in the number of queries.
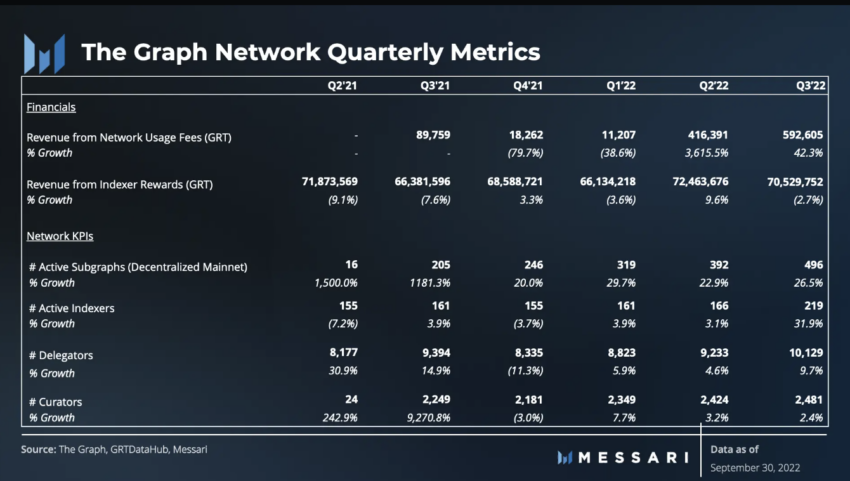
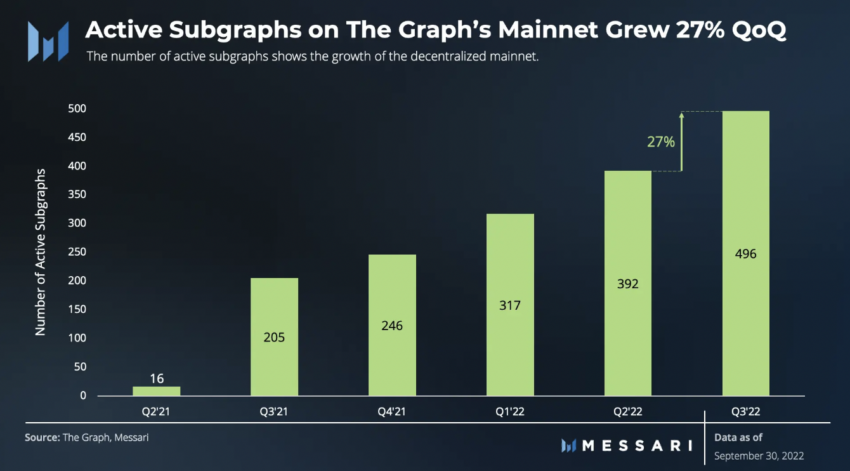
- Every aspect of the ecosystem grew, with indexes showing the largest increase at almost 32%.
- Network usage grew by 27% QoQ. During the same time, the price of GRT tokens peaked at 31%.
- A 32% increase in the number of indexers shows adoption and the willingness to build and stake within The Graph ecosystem.
- Staking stats looked steady QoQ. This means indexers and delegators aren’t leaving the ecosystem despite the current state of the crypto market.
Last reported, 30,000 services migrated to The Graph network in Q3, 2022, showing a surge in adoption.
The network growth looks steady. Therefore, even the most far-reaching price projections might hold for the GRT token if adoption is high.
GRT market cap and trading volume comparison
If we plot the market cap and trading volume of GRT at the highest point, we can compare the ratio with the 2022 levels. This will allow us to find the volatility.
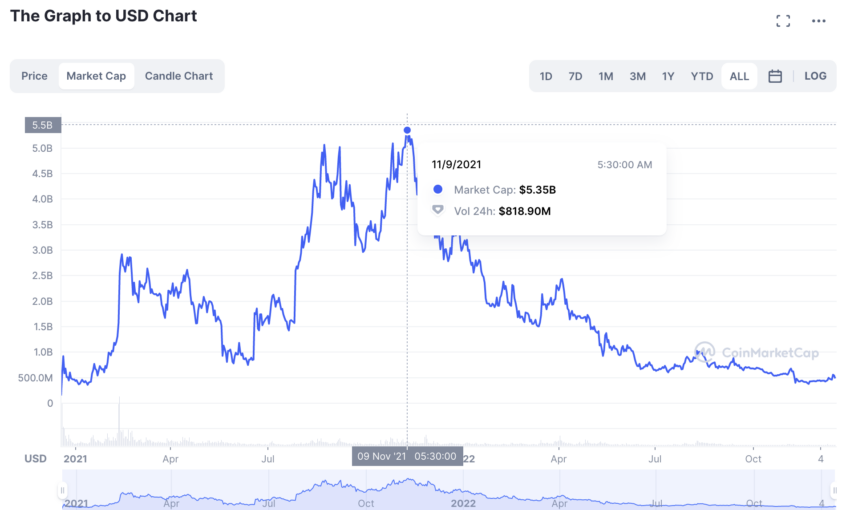
At the peak:
Market cap: $5.35 billion
Trading volume: $818.90 million
Turn-over ratio: 0.15
As of Dec. 17, 2022:
Market cap: $486.55
Trading volume: $22.96 million
Turn-over ratio: 0.047
Hence, the volatility at the GRT counter is much higher in 2022 than seen previously.
The Graph price prediction using on-chain metrics
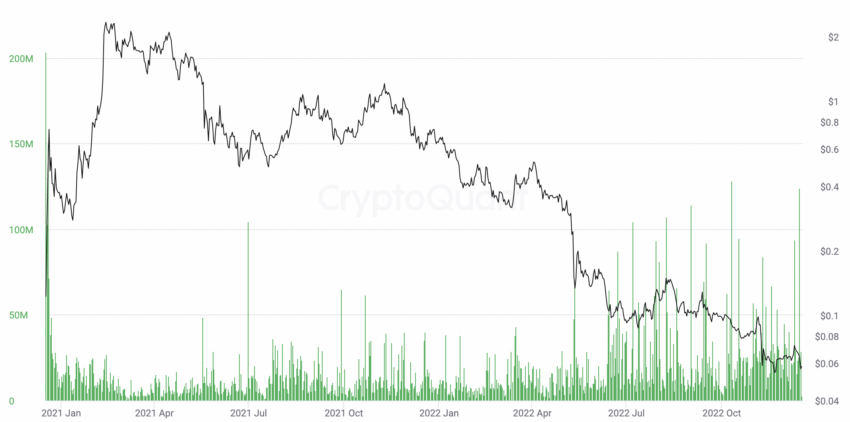
Exchange inflows for GRT were high in July and mid-October 2022. In November, though, it also peaked slightly and has steadily increased. The price action responded negatively.
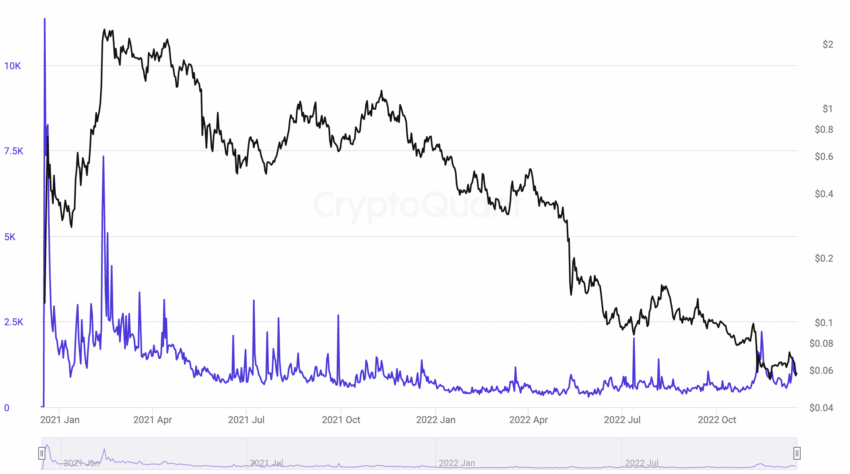
Active addresses have been relatively low in 2022, showing a lack of holding interest. There was a peak on Nov. 11, 2022, and the prices responded positively. Therefore, to track the price action of GRT, it is advisable to keep an eye on the number of active addresses.
The Graph price prediction using technical analysis
Before we proceed with technical analysis, here’s what we know about The Graph (GRT):
- The highest price of GRT is $2.88, which it reached on Feb. 12, 2021.
- GRT is currently trading at a 98% discount to its all-time high price.
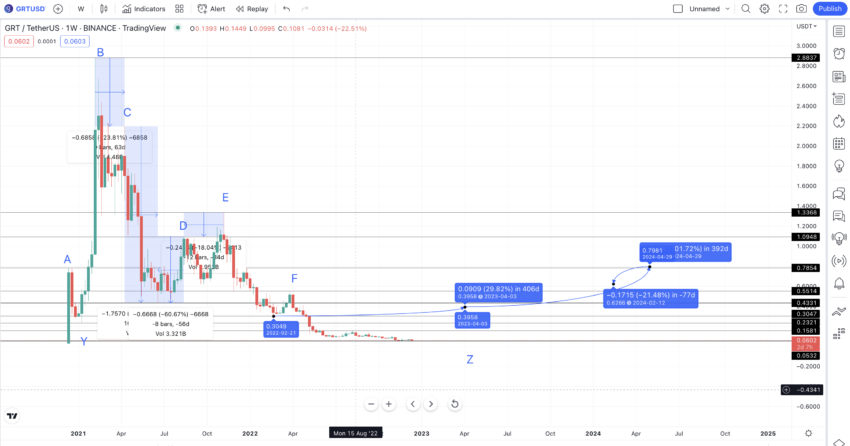
Here is a weekly chart with the important points to help us locate a pattern on GRT’s price chart:
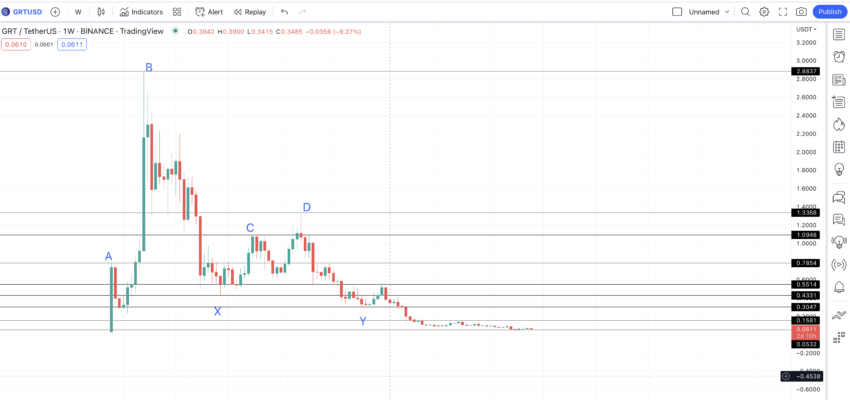
The chart has the key low and high levels marked with corresponding values. These would act as support and resistance lines.
Pattern identification
The weekly chart shows a discernible pattern. A low to high followed by a lower high. Then GRT forms a bottom before making another high, a higher high, and then a lower high.
Let A, B, and C be the points of the first pattern, whereas D, E, and F be the points of the second. Also, Y is also the low of the first pattern, and X is the low of the second pattern. We are yet to find the low of the third pattern. So, we shall be making a few assumptions.
Now, we shall find the distance between the first two lows, Y and X, to see if we can determine the next low on the weekly chart of GRT.
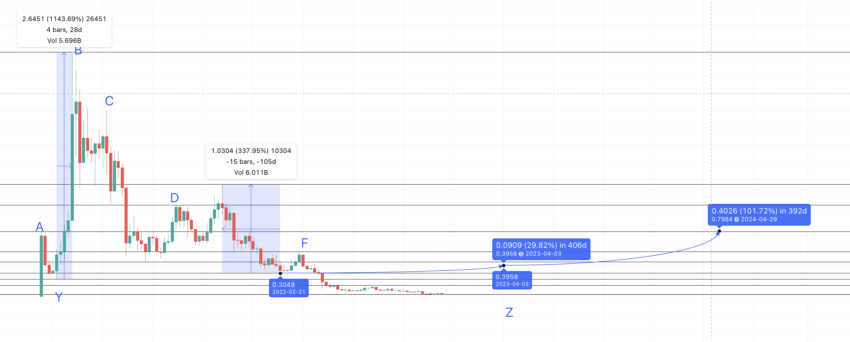
The distance between the two lows is 406 days, and the growth is 29.95 or even 30%, to be exact. (Once we form the next pattern, this will help us calculate the low)
The low could show up at $0.3958.
Finding the other points of the pattern
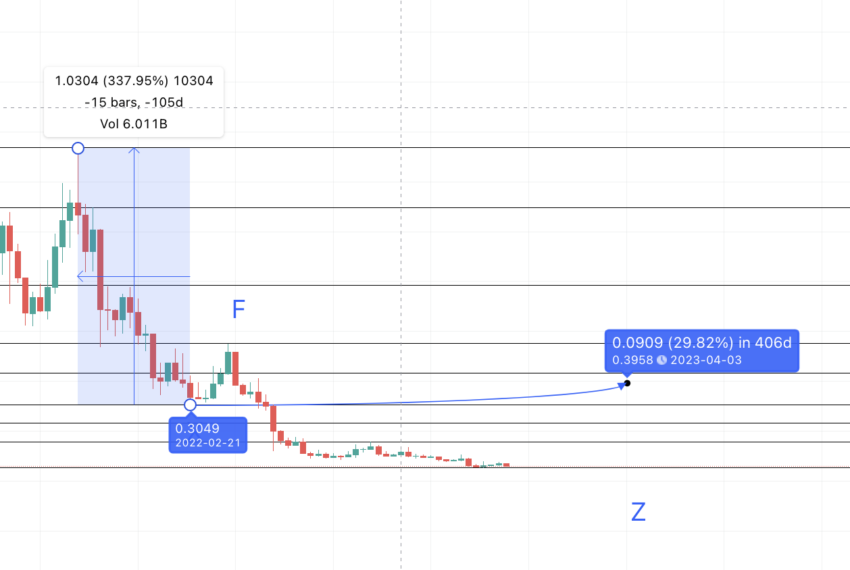
We have the low of the next pattern. Let us plot and name it Z. Now we go back to the chart and find the distance between the low and the peak of a respective pattern.
Here is the data for the same (data set 1)
Y to B = 28 days and an 1143% growth; X to E = 105 days and a 338% growth
Here is what we can infer from the table:
The percentage growth from the low decreases by a factor of 3.38
The distance from the low to the peak increases by a factor of 3.75
So, where could the high be at? Considering the current bearish state of the crypto market, it should be on the right side of the low.
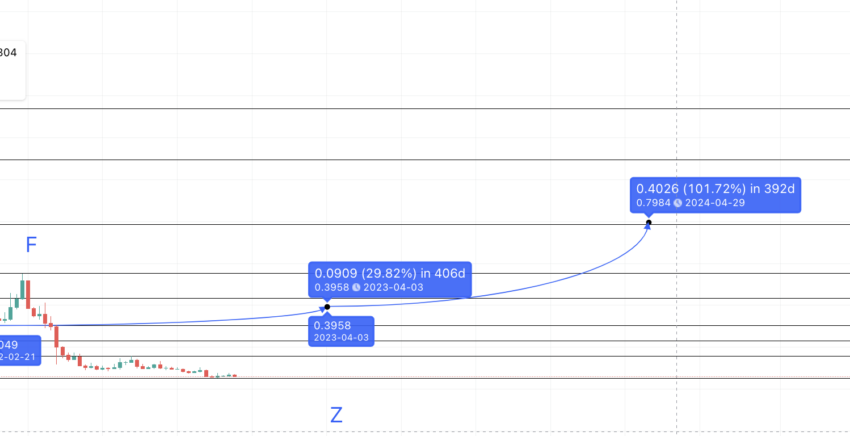
So the next peak from Z should be in (105 x 3.75) days and at (338/3.38)%.
394 days and at 100% from Z. The high surfaces at $0.79854.
Here is what the plotted path looks like:
The Graph (GRT) price prediction in 2023 and 2024
Even though GRT didn’t move as high as we expected, the price action did gain speed towards the end of 2023. Here is what we predicted and analyzed. Read through as we have also explored the possible 2024 levels.
Do note we accidentally located the high for 2024 as the peak goes into the next year. To find the high in 2023, we must locate the distance between the peak and the next lower high.
For that, here is the relevant data set: (data set 2)
B to C = 63 days and a dip of 23.81%; E to D = 84 days and an 18.04%
Calculation
The average comes out to be 74 days a 21% dip.
Outlook: Bullish
Now, if we retrace the path from the 2024 high of $0.79854 backward, we get the lower high at $0.6266. If market conditions improve and The Graph protocol sees more mainnet activity, the high may emerge by 2023.
Predicted ROI from the current level: 180% (for 2024)
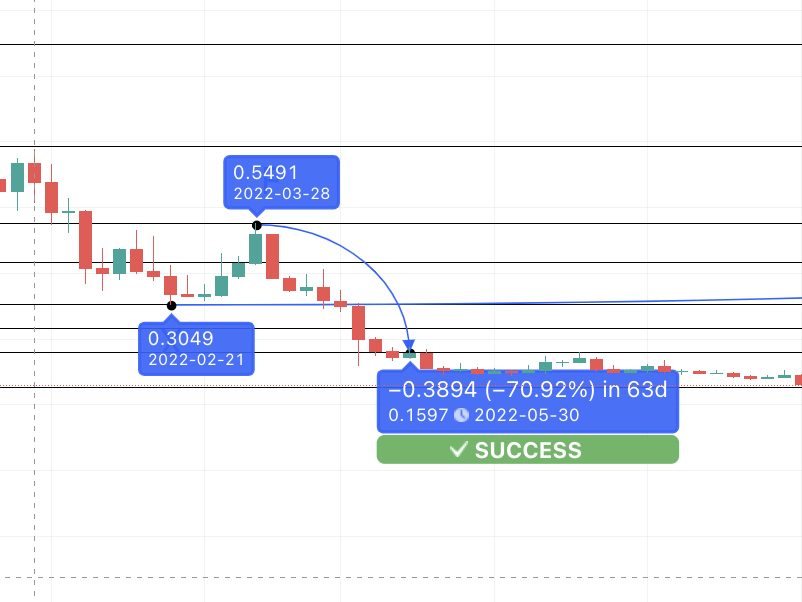
But $0.3958, despite being the low of the third pattern, might not be the minimum price of GRT in 2023. To find this, we have located one bottom (O) after the first pattern. So, if we can find the distance between C and O and then O to D, we can locate the next low after F.
Data set 3 is therefore as follows: C to O = 70 days and a dip of 80.08%; D to O = 56 days and a dip of 60.67%
The average is 63 days, a dip of 70.375%.
So, if we take the reference point as F, the low would be 70.375% lower or at $0.1597.
Do note we plotted the same path, with the pattern emerging as a success. This shows that our price prediction holds despite the bear market. Also, as per the rounded bottom, we can see the $0.1597 as the low in 2023. The high remains steady at $0.6266.
GRT short-term price prediction
The short-term GRT price chart hints at a descending channel pattern. Any move above the upper bullish trendline can lead to a small rally at GRT’s counter. However, the moving averages (50, 100, and 200) are still separated and not hinting at an immediate rally.
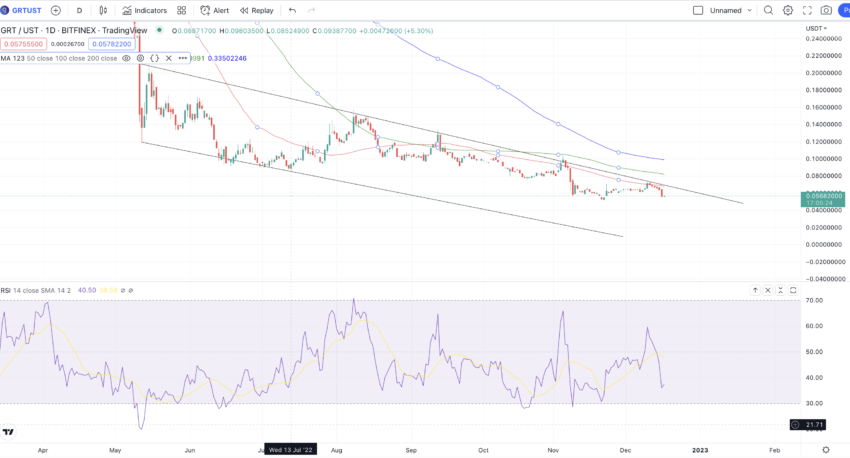
Even the momentum indicator or RSI is in the bearish zone. It must cross above 47 for the price to show some strength.
GRT might require a sentimental drive to push the prices high in the short term.
The Graph (GRT) price prediction 2025
We already have the 2024 peak at $0.79854. So, we can use this to plot the next high in 2025. To calculate this, we must measure the distance between the two peaks: B and E. The distance comes out at 273 days.
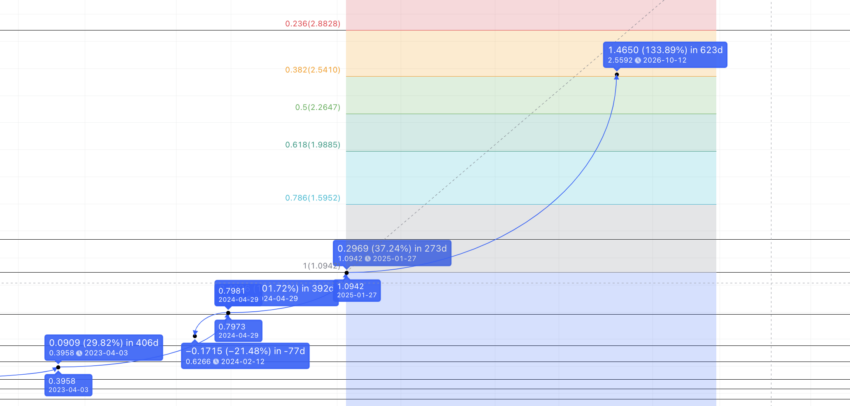
Therefore, the next high from $0.79854 could be 273 days from April. 29, 2024. The next resistance line is at $1.0948. In 273 days, GRT should breach this level. The low from here could go drop to $0.5514 — which is the lower high in the second pattern.
Predicted ROI from the current level: 277%
The Graph (GRT) price prediction 2030
If all goes well for GRT on the weekly price chart, it might reach $1.0948 or even breach it. If we pair a Fibonacci indicator with the same, we can trace the GRT price long-term.
Let’s assume the same growth pattern continues for The Graph, and GRT traces the same path forward. If so, the Graph price prediction for 2026 puts the price of GRT at $2.5592.
The same price and growth trajectory puts the GRT price prediction 2030 level at over $5 — $5.328, to be exact. If we trace the same path, the price of GRT can cross its all-time high of 2.88 in mid-2028 with linear growth.
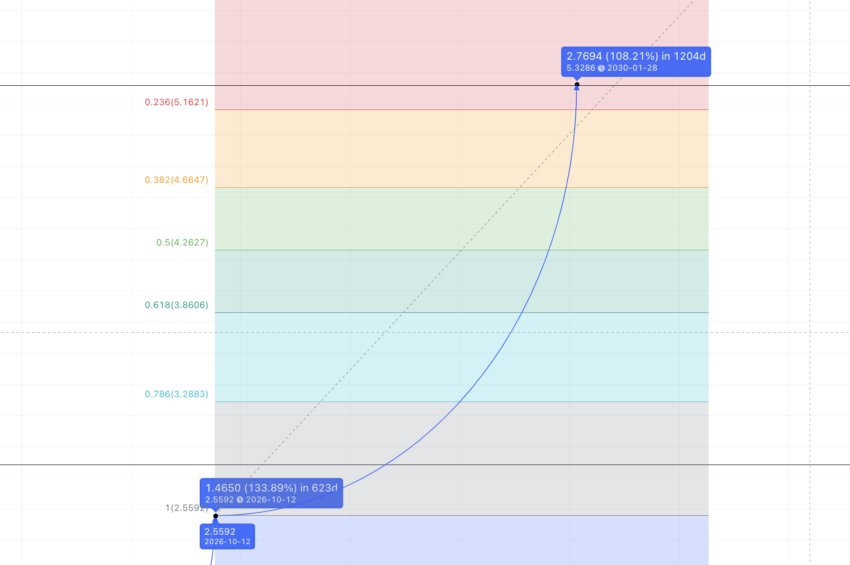
The low for 2030 can surface anywhere around the $4.26 mark — coinciding with the 50% point on the Fib indicator.
Predicted ROI from the current level: 1737%
The Graph (GRT) long-term price prediction until 2035
Long-term thinkers may benefit from the below data, which traces a future price point until 2035.
You can easily convert your GRT to USD
| Year | | Maximum price of GRT | | Minimum price of GRT |
| 2024 | $0.79854 | $0.2 |
| 2025 | $1.0948 | $0.5514 |
| 2026 | $2.5592 | $1.279 |
| 2027 | $2.72 | $1.68 |
| 2028 | $2.89 | $2.08 |
| 2029 | $3.61 | $2.24 |
| 2030 | $5.328 | $4.26 |
| 2031 | $6.92 | $4.98 |
| 2032 | $8.99 | $6.47 |
| 2033 | $11.68 | $8.40 |
| 2034 | $12.85 | $9.25 |
| 2035 | $15.42 | $9.56 |
The price points, per the data above, are not linear. Instead, they take future bear and bull cycles into consideration. Therefore, in any given year, it is advisable to take the average price of GRT into account for tracing the projections correctly.
Is the GRT price prediction accurate?
The GRT price prediction for both long-term and short-term focuses on chart patterns, technical, and on-chain analysis and therefore looks practical. We also used The Graph price prediction 2023 postulates to successfully retrace the path to a 2022 low, validating this model further. Therefore, keeping every aspect in mind, the future price points for GRT look achievable according to the given GRT price prediction. Ecosystem growth and adoption will also come into play in the long term.
Frequently asked questions
What will the Graph be worth in 2025?
Is the Graph crypto a good investment?
What will the Graph be worth in 2030?
Can the Graph reach $10?
How high can the Graph reach?
Trusted
Disclaimer
In line with the Trust Project guidelines, the educational content on this website is offered in good faith and for general information purposes only. BeInCrypto prioritizes providing high-quality information, taking the time to research and create informative content for readers. While partners may reward the company with commissions for placements in articles, these commissions do not influence the unbiased, honest, and helpful content creation process. Any action taken by the reader based on this information is strictly at their own risk. Please note that our Terms and Conditions, Privacy Policy, and Disclaimers have been updated.