
What if we told you about a blockchain network that can run endless sidechains in an effort to scale Ethereum, all with zero gas fees? Meet the SKALE Network — a modular blockchain slowly increasing in popularity. This SKALE price prediction will consider the merits of investing in this innovative project and its native SKL token. But why SKALE?
SKALE differs from other scalability solutions blockchains. It increases Ethereum’s elasticity by letting developers move to any SKALE sidechain they create — in exchange for SKL tokens. This explains the utility of the native token. Now we know a bit more about this layer-1/layer-2 modular chain, let us delve into the SKALE price prediction.
NOTE: This article contains out of date figures and information. It will be updated with fresh analysis for 2025 and beyond in the New Year. In the meantime, please see our Skale price prediction tool for the most recent, data-informed projections.
- SKALE price prediction and fundamental analysis
- SKALE tokenomics, market cap, and trading volume
- SKALE Network and the on-chain activity (2022-23 insights)
- SKALE price prediction using technical analysis
- SKALE (SKL) price prediction 2023
- SKALE (SKL) price prediction 2024
- SKALE (SKL) price prediction 2025
- SKALE (SKL) price prediction 2030
- SKALE (SKL’s) long-term price prediction until 2035
- Is the SKALE price prediction accurate?
- Frequently asked questions
Want to get SKL price prediction weekly? Join BeInCrypto Trading Community on Telegram: read SKL price prediction and technical analysis on the coin, ask and get answers to all your questions from PRO traders! Join now
SKALE price prediction and fundamental analysis
While the SKALE ecosystem is primarily a scaling solution, a few fundamental aspects are important to consider. These include the following:
- It is an EVM-compatible network of sidechains.
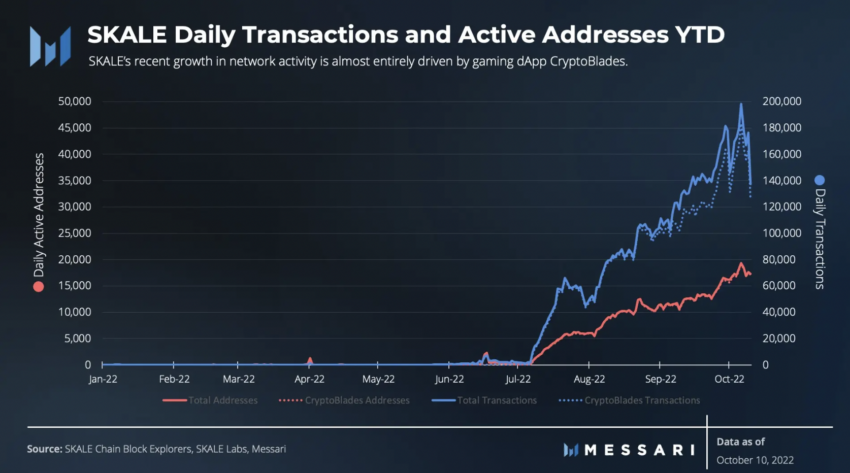
- As of October 2022, most of the network activity was contributed by CryptoBlades — a gaming DApp sidechain.
- SKALE doesn’t inherit all of Ethereum’s security features like other scaling solutions. Instead, there is a separate validator set with bespoke consensus mechanisms. This feature makes SKALE exclusive.
- Stan Kladko and Jack O’Holleran are the brains behind the SKALE Network.
- The network architecture uses a facilitator called SKALE manager that connects the sidechains to the Ethereum network, depending on the DApp.
- The SKL token is useful for handling subscription fees for building chains, keeping the network safe, and even handling on-chain network governance.
- SKALE supports token staking for collateralizing and providing security to the network via the PoS consensus.
Here is what the network architecture looks like:
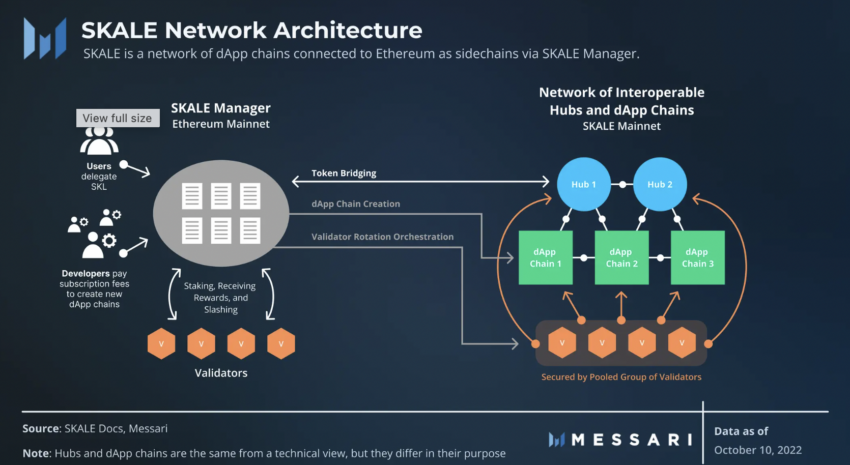
Did you know? SKALE is a boon for builders. Anyone who wants to stay connected to Ethereum and still wants to launch a DApp-specific sidechain at a low cost can use SKALE. This feature increases SKALE’s utility.
SKALE tokenomics, market cap, and trading volume
SKALE has a fixed supply of 7 billion SKL tokens. As of Dec. 23, 2022, the circulating supply was 58% of the total supply. However, the distribution of tokens piques our interest. 33% of the total supply is meant for validator rewards and is inflationary. This means more SKL tokens get unlocked with more network activity.
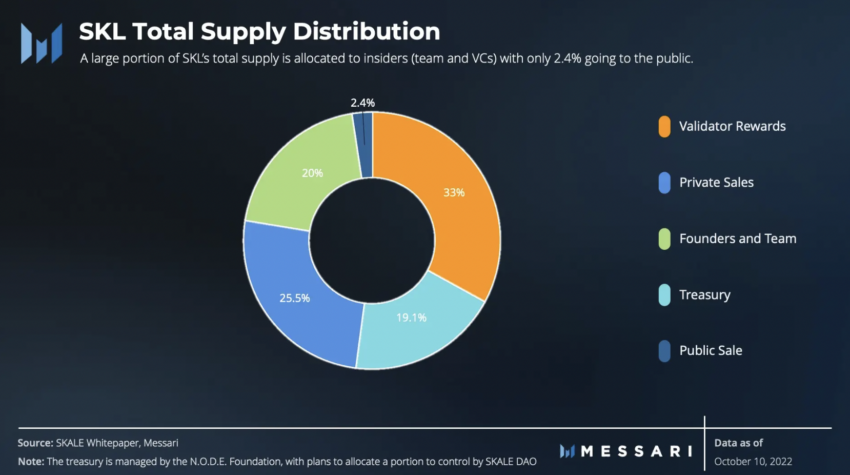
20% of the supply is with the founders, whereas only 2.4% is with the public or retail investors. While this might not be the optimal form of token distribution, 57% of the supply seems liquid. This might be positive for the price action.
Another aspect to consider is the drop in SKALE’s market cap from its peak. SKALE’s market cap peaked on April 2, 2022, reaching $1.05 billion. Trading volume at the peak was $162.65 million. As of December 2022, the market cap dropped to $90.07 million, and the trading volume flattened to $4.26 million.
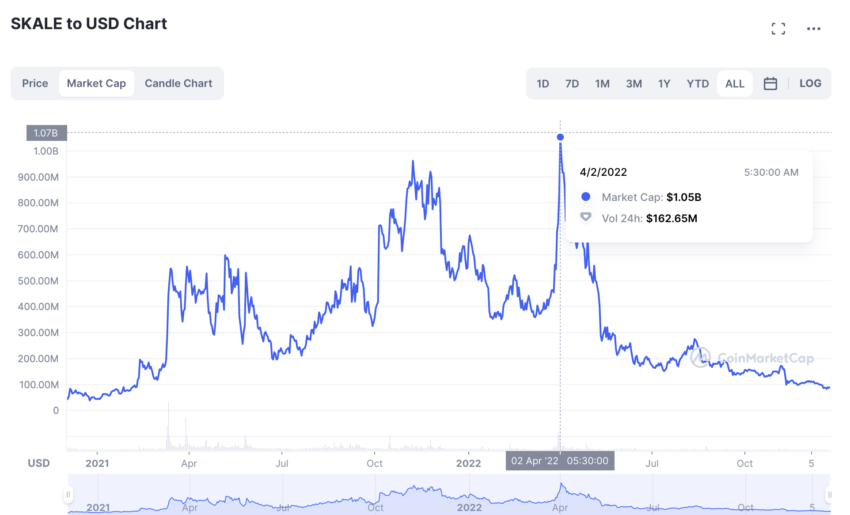
If we take the turnover ratio of the trading volume and market cap during the peak — and at December 2022 levels — the peak level volatility stands at 0.15. Volatility in December 2022 stood at 0.047.
SKALE tokenomics isn’t the best part of its price prediction journey. Total supply unlocking will happen by 2119, so there won’t be scarcity anytime soon.
SKALE Network and the on-chain activity (2022-23 insights)
Active address build-up and transaction counts indicate a surge in on-chain activity during the latter part of July 2022. This coincided with the launch of the SKALE version 2, which brought interoperability to the DApp chains and different hubs.
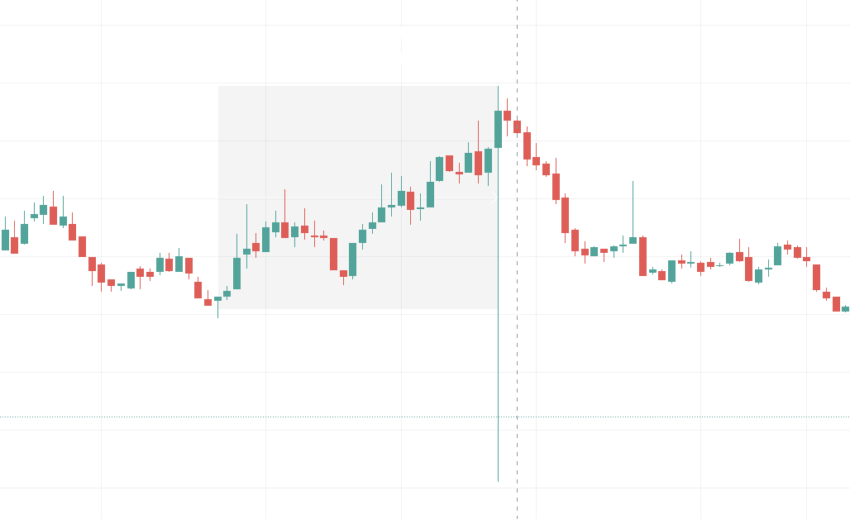
Here is how the SKL token rallied in this bearish crypto market following the active address development.
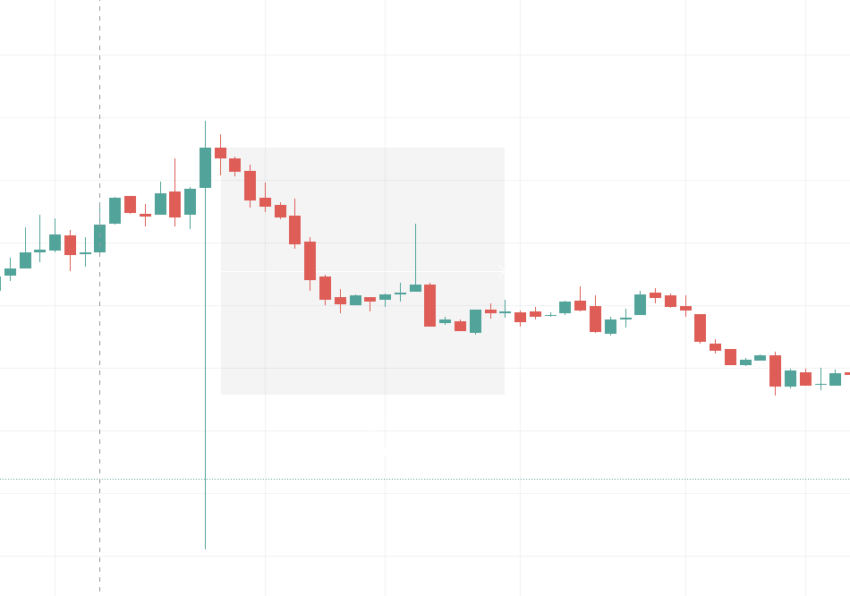
However, most of the transactions were on the CryptoBlade sidechain. Here is what the transaction count looks like if we take CryptoBlades out of the equation.

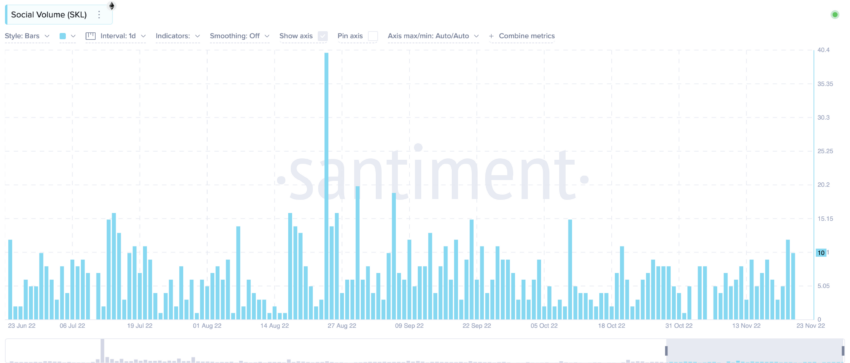
Also, the social volume was steady in 2022, barring a sudden rise in August. However, prices started dropping from mid-August onwards. This shows the social chatter around SKL was negative.
SKALE price prediction using technical analysis
Now that SKALE fundamentals, social chatter, and on-chain metrics are out of the way, it’s time to focus on the technical analysis part. Before we analyze the relevant charts, here are the important details:
- The maximum price of an SKL token was $1.22, which showed up on March 12, 2021.
- The minimum price of an SKL token was $0.02051, which showed up on Dec. 19, 2022.
Here is the standard weekly chart of SKALE. Now let us locate the pattern:
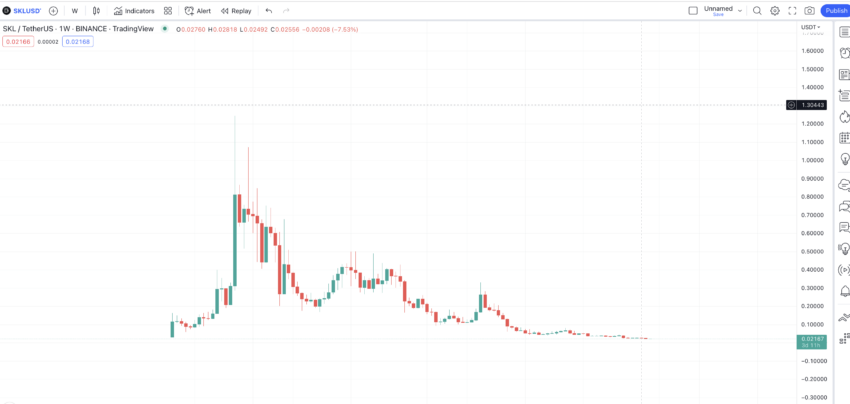
Finding the pattern
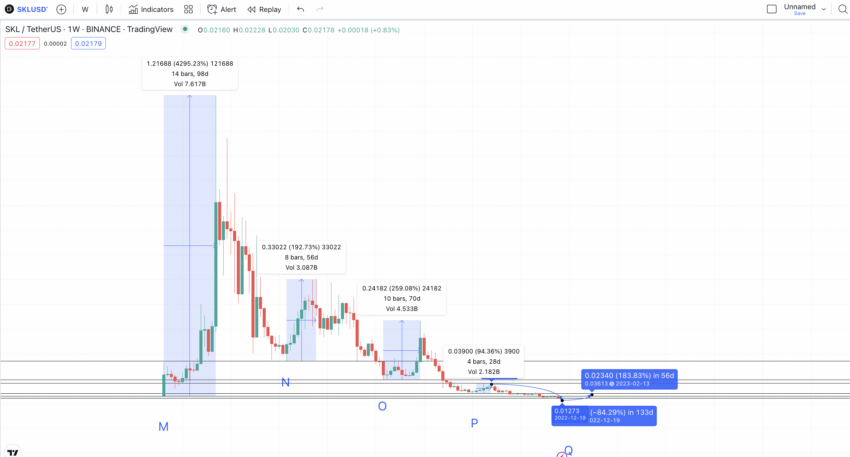
The weekly chart reveals a clear pattern. Assuming that the first point is low, SKL peaks from there. It drops to make a rounded bottom, makes a lower high, another rounded bottom, and another lower high. As you can see, the rounded bottom formation continues before a small lower high is made.
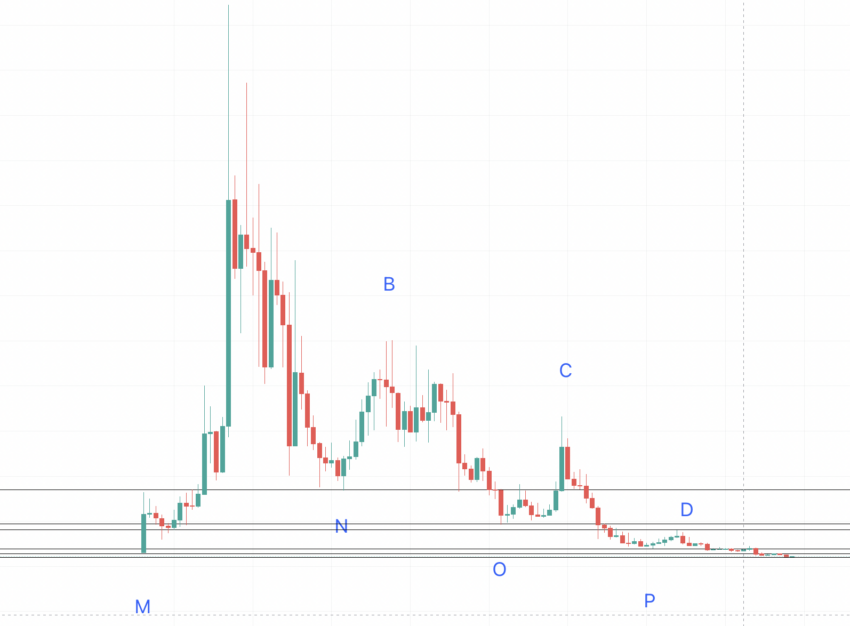
Now let us make the lows and highs and revisit the chart.
Our first task is to see whether the bottom for SKL’s recent swing high has arrived. For that, we must calculate the distance between the highs and lows.
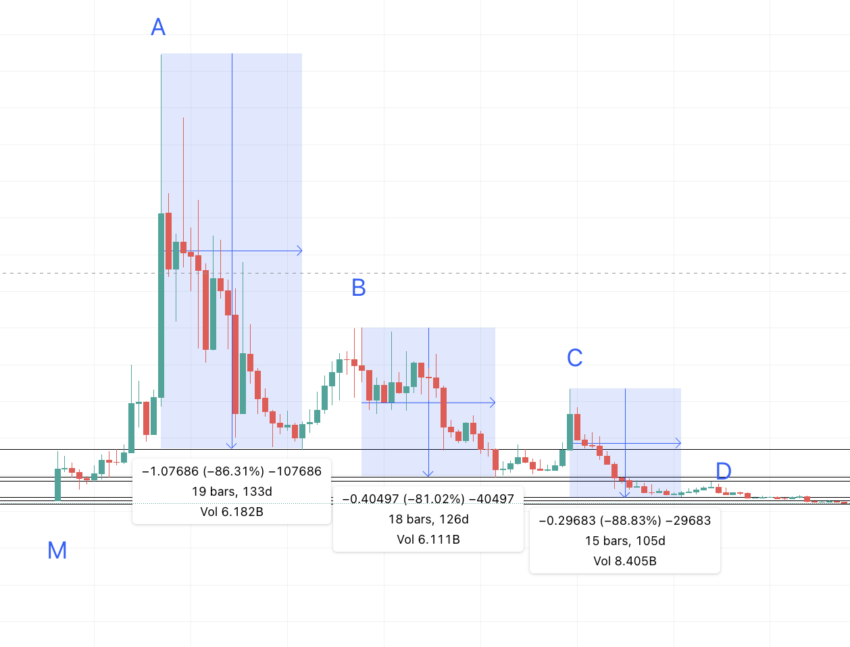
A to N = 133 days and -86.38% price change; B to O = 126 days and -81.02% price change; C to P = 105 days and -88.83% price change.
The average comes as 121 days and -85.38%.
Hence, from the high of D, the low has to be somewhere within 121 days and at a level lower by -85.38%. We can draw the forecast line and see where it lands.
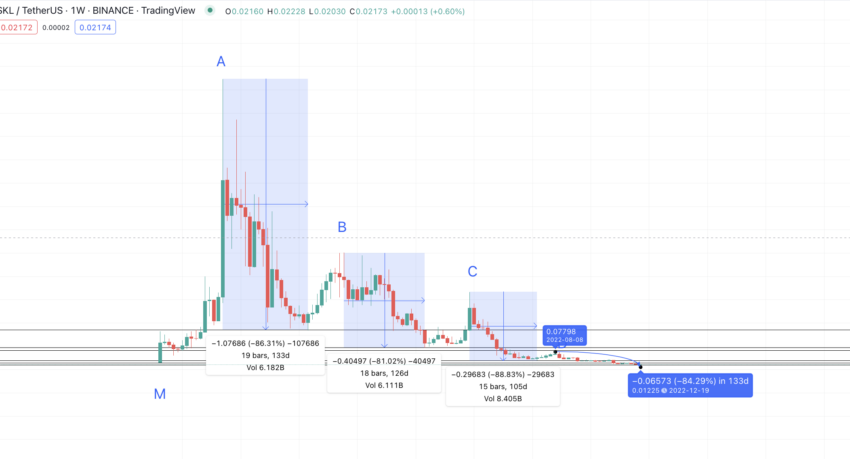
According to the forecast line, SKL should have dropped to $0.01225 by this time in December 2022. That explains the low of $0.02051 we reached in mid-December. Also, the current bear market suggests SKL might correct further from here, and $0.01225 might not be out of reach. So, the short-term SKALE price prediction doesn’t look particularly strong.
SKALE (SKL) price prediction 2023
Our SKL price prediction level of $0.08489 came to the fore in January 2024 instead of 2023 end. This is common in the crypto space. Here is how we analyzed events:
Now, we have an attainable SKL low in sight; we can use this to find the next high for 2023.
Let us locate the distance and price change percentage from the lows to the highs.
Data set 2 is as follows: M to A = 98 days and 4295% price change; N to B = 56 days and 192.73% price change; O to C = 70 days and 259.08% price change; P to D = 28 days and 94.36% price change.
We can ignore the first column’s price change percentage (M to A). The exorbitant rise can be attributed to the shilling and sentiment drivers.
So, if we take the average of the other three columns, the next target high comes in 51 days (maximum of 98 days) and at a distance of 182.05%.
Therefore, if we draw a forecast line from Q, the next high might surface close to $0.03613. That looks like a practical high for 2023.
The low in 2023 can be at $0.03009 — a level that coincides with the M from the start of the pattern. Once that low is marked as R, a higher low pattern will be established at SKL’s counter. That might signal the start of a true uptrend from 2024 onwards.
Now we have the low in 2023 at $0.03009; we can refer to the low-to-high figure to locate the same for 2024. Keeping the 182.05% as the limit, we can push the forecast line to $0.08489, which also surfaces in 2023. Hence, the SKALE price prediction for 2023 puts the high at $0.08489.
SKALE (SKL) price prediction 2024
Outlook: Bullish
If we mark both the 2023 high F, we notice another trend surfacing. If you consider D as the middle point, you can see SKALE following the same A-B-C-D pattern on the other side, only flipped. Therefore, the D-F pattern looks similar to the D-C-B on the left. Now, we can simply take the distance and the price difference between the available set of points to find the same for the next.
Here is the table for the same:
D to C = 133 days and 314.21%; C to B = 196 days and 50.69%, B to A = 189 days and 150.56%; D to F = 392 days and 11.53%
If we take the average between the highs, we get the percentage gain as 131.74% and the number of days as 228. However, the maximum distance can be 392, the highest number in the average sequence.
On tracing the path from F, we get the next point at $0.198, which we can assume to be the SKALE price prediction high for 2024.
Projected ROI from the current level: 110%
SKALE (SKL) price prediction 2025
Outlook: Bullish
Another extrapolation from the 2024 high puts the SKALE price prediction for 2025 at $0.458. The low in 2025 can surface in 121 days and at a deficit of -85.38% from the 2025 high. That comes to be $0.067. But then SKALE has very strong support at $0.267, which might stop the price of the SKL token from dipping further.
Here is the high-to-high projection and the path till 2025:
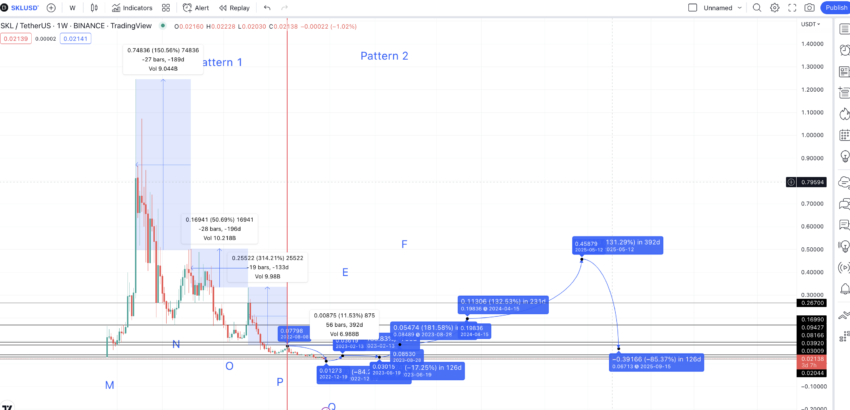
Therefore, the maximum price of an SKL token in 2025 can be $0.458, and the minimum price might surface at $0.267. The average price of SKL can fall anywhere in between, depending on the cryptocurrency market.
Projected ROI from the current level: 385%
SKALE (SKL) price prediction 2030
Outlook: Bullish
Even after reaching $0.458 in 2025, SKALE might still not surpass the second-highest point on Pattern 1, B. Also, by now, the SKALE average price for any year would be on a higher high pattern, confirming an uptrend. Therefore, we can go about using the higher high percentage gain of 131.74% to find the next high.
Also, with SKALE having several competitors, it’s realistic to use the maximum distance of 392 days to plot the next high. So the next high becomes the SKALE price projection for 2026 and surfaces at $1.064.
We can locate the next set of possible points with the Fib indicator using the low of 2025 ($0.267) and the high of 2026 ($1.064).
If we use the same slope and the Fib extension levels, the SKALE price prediction for 2030 might surface at $5.20. The low can show up at $3.87, coinciding with the 78.6% Fib level.

Projected ROI from the current level: 5417%
SKALE (SKL’s) long-term price prediction until 2035
Now that we have the SKALE Network price prediction model till 2030, we can continue to trace the path until 2035. The following table does just that.
You can easily convert your SKL to USD
| Year | | Maximum price of SKL | | The minimum price of SKL |
| 2024 | $0.198 | $0.081 |
| 2025 | $0.458 | $0.267 |
| 2026 | $1.064 | $0.659 |
| 2027 | $1.43 | $0.715 |
| 2028 | $2.15 | $1.33 |
| 2029 | $3.23 | $2.00 |
| 2030 | $5.20 | $3.87 |
| 2031 | $6.50 | $4.03 |
| 2032 | $9.75 | $7.60 |
| 2033 | $12.18 | $7.55 |
| 2034 | $17.05 | $10.57 |
| 2035 | $21.31 | $16.62 |
The average price of SKALE should ideally fall between the minimum and maximum, as shown in the table above. However, there might be years when the prediction fails due to the nature of the crypto market. We shall continue to revisit this SKALE network price prediction piece and make the necessary changes in that case.
Is the SKALE price prediction accurate?
This SKALE price prediction is realistic by design. While technical analysis is at the core of this price prediction, we also consider the SKALE network’s fundamental aspects, the SKL tokens’ trading volume across different time frames, tokenomics, and on-chain and social metrics. Overall, this SKALE price prediction model is a holistic representation of the potential future of the SKALE network and its native token. As always, we’ve kept the broader state of the cryptocurrency market and its relative cycles in mind.
Frequently asked questions
Does SKALE network have a future?
What does the SKALE network do?
How high can SKALE go?
Does Skale have a limited supply?
What is Skale used for?
Disclaimer
In line with the Trust Project guidelines, the educational content on this website is offered in good faith and for general information purposes only. BeInCrypto prioritizes providing high-quality information, taking the time to research and create informative content for readers. While partners may reward the company with commissions for placements in articles, these commissions do not influence the unbiased, honest, and helpful content creation process. Any action taken by the reader based on this information is strictly at their own risk. Please note that our Terms and Conditions, Privacy Policy, and Disclaimers have been updated.


