
Decentralized cloud-specific storage is growing in popularity. The ability to rent out, lend, and deploy storage space without worrying about privacy is a desirable web3 use case. Blockchains like Sia are furthering this concept with aggressive launches and timely innovations. So, how is the Sia blockchain native altcoin, Siacoin, doing? While there are many aspects to the Sia blockchain, this is a Siacoin price prediction, so the chain’s native coin is the focal point of this piece.
- Siacoin price prediction using fundamental analysis
- Siacoin tokenomics and market presence
- Siacoin price movement compared to the competition
- Siacoin trading markets
- Siacoin price charts
- The price of Siacoin and its social presence
- Siacoin price prediction and technical analysis
- SC short-term price analysis
- Siacoin weekly charts
- Siacoin price prediction 2023
- Siacoin Price Prediction 2024
- Siacoin Price Prediction 2025
- Siacoin Price Prediction 2030
- Siacoin long-term price prediction (up to 2035)
- How accurate is the Siacoin price prediction?
- Frequently asked questions
Want to get SC price prediction weekly? Join BeInCrypto Trading Community on Telegram: read SC price prediction and technical analysis on the coin, ask and get answers to all your questions from PRO traders! Join now
Siacoin price prediction using fundamental analysis

The Sia blockchain is a peer-to-peer cloud storage marketplace where people can lease out unused storage. Transactions and rent/lease agreements are executed using smart contracts.
Over time, Sia aims to become the new internet storage layer. The altchain seeks to compete with existing storage solutions from Google and Amazon, focusing on competitive rates and greater privacy. Siacoin — the native token — offers support as a medium of exchange within the Sia blockchain.
While popular exchanges were late to list Siacoin, the blockchain has been around since 2014.
Did you know? Siacoin is the brainchild of David Vorick and Luke Champine and received funding from billionaire investor Jim Pallotta.
At present, the two bodies manage Sia’s operation in different ways. First is the non-profit. Sia Foundation aims to improve the ecosystem and offer users free resources and open-source access. Skynet is Sia’s profit-driven arm and works towards building atop the Sia blockchain. Some existing projects include the streaming application SiaStream and the flagship content provider, Skynet Network.
Here is a quick roadmap outlining the development timeline of the Sia Network and its various components. The journey began in June 2015 with the launch of the Sia Network, followed by the introduction of Skynet in February 2020. October 2020 saw Skynet supporting mutable data, aiming to empower content creators with the ability to update content for Twitter and Reddit.
The Sia Foundation was established in February 2021. By April 2021, an identity system focusing on a new system called MySky was introduced, and the year 2022 brought additions to the Sia ecosystem, including Sia satellite, S5, and more. In 2023, the inclusion of large-scale renting solutions and operations was facilitated through “Renterd.” The project is expected to lead with powerful hosting services, the launch of desktop apps, and further expansions.
In 2024, the project is expected to lead with powerful hosting services, the launch of desktop apps, and more.
Sia blockchain has a well-planned roadmap with a focus on incremental developments. This could be positive for Siacoin’s mid to long-term price.
Siacoin tokenomics and market presence
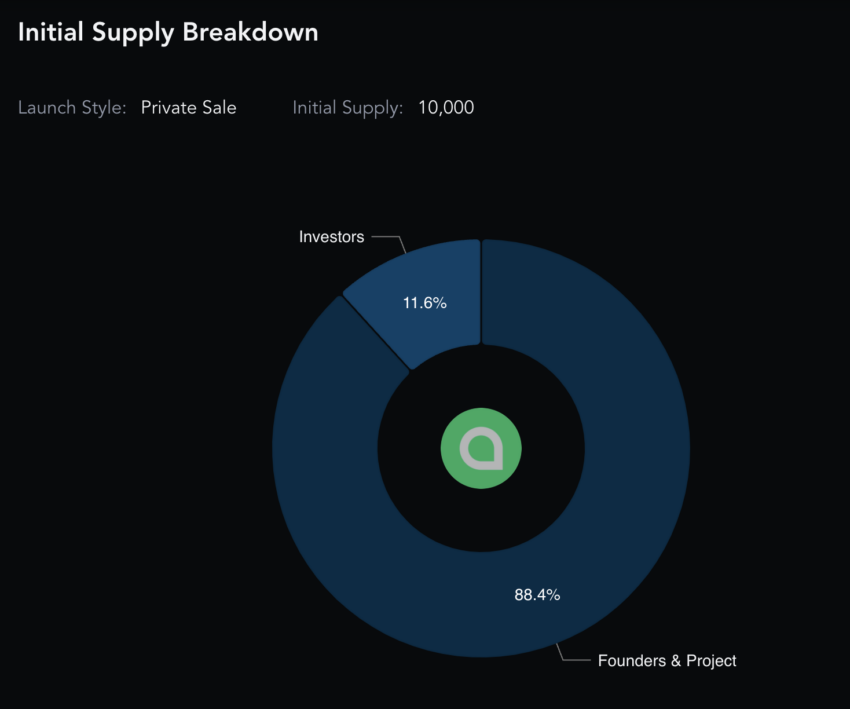
Siacoin has a circulating supply of 56.4 billion tokens as of February 2024. However, note that Sia offers a dual-token structure: Siacoin (SC) and Siafunds. The latter is a tokenized version of revenue sharing only offered to qualified investors.
Siacoin — the native utility and payments coin — follows a Bitcoin-like mining approach. However, there is no upper supply cap, making it strictly inflationary. Simply put, you can mine as many Siacoin tokens as you want using ASIC devices and GPUs. Yet, the core team says that it only holds 1% of the total (current) supply to ensure the focus remains on decentralization.
No Siacoin (SC) moved to the investors during Sia’s fundraising round. Instead, unlisted Sia Funds were used.
Here is what the initial supply breakdown looked like:
Looking next at the supply schedule, Siacoin (SC) flows into the market solely via mining rewards. Despite the inflationary tokenomics, the emission rate is disinflationary for now, thanks to the periodic token-burning schedule.
Here is what the liquid supply looks like:
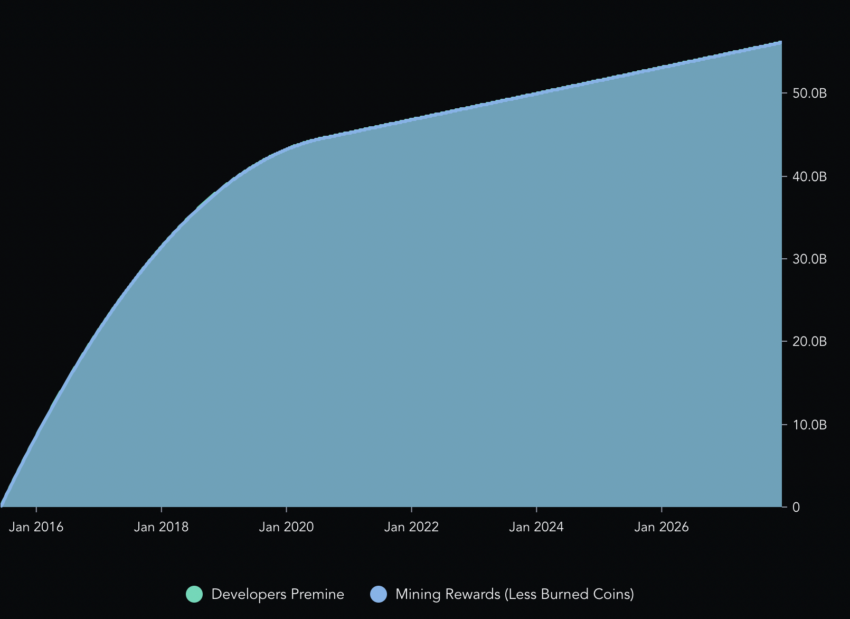
ICO-specific token offerings and inflationary tokenomics do not look exceedingly positive. However, as scarcity kicks in, Siacoin’s proof-of-burn mechanism could make it more desirable in the future.
Siacoin price movement compared to the competition
Decentralized storage is a new use case. Therefore, to predict the price of Siacoin, it is important to take a look at its competition.
For now, we will focus on the price movements of Filecoin (FIL) and Storj (STORJ).
Filecoin is a P2P storage network with a focus on renting out unused space. FIL is its native coin and helps with incentives and rewards.
Regarding price history, the performance of FIL over the past year has been decent. It is currently trading at $5.28, up 8.7% over the past year.
Storj is designed to offer object storage facilities over the cloud. Its native ERC-20 coin, STORJ, acts as the incentivizing tool. Over the past year, STORJ, the native token, has surged by over 66%.
Even Siacoin (SC) has moved up by 132% over the past year. This shows Decentralized Storage could be the theme to look out for in the months or years to come.
The price of Siacoin is moving at par with similar projects. Hence, we can track crypto assets pertaining to the decentralized storage space to prepare a Siacoin price prediction. As of now, the price trends look bearish, especially in the short term.
“The cost savings of decentralized storage vs AWS is staggering.”
Tom Dunleavy, CIO at MV Capital: X
Siacoin trading markets
Siacoin trading pairs are listed on some of the top global exchanges.
Here is data from 2022 showing the popularity of top SC pairs.
The SC/USDT pair is the most popular Siacoin market. The verified market presence for most Siacoin trading pairs is either 50% or 100%. This shows that actual traders are flipping SC and riding the price movements.
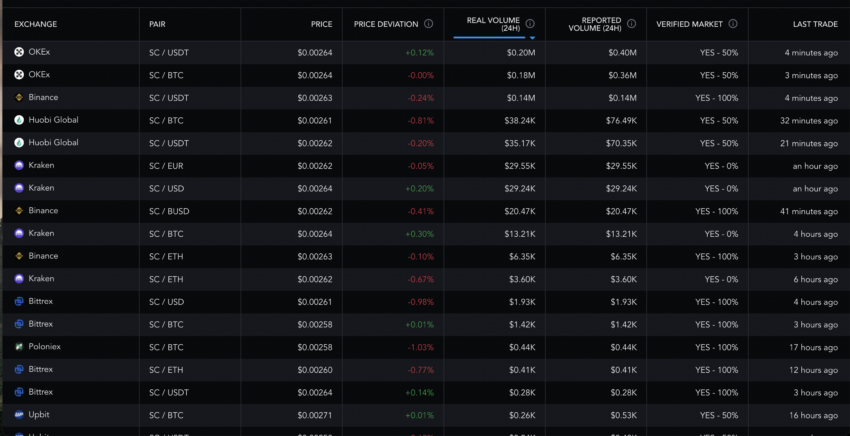
The trading frequency is good enough, especially on popular exchanges. However, there isn’t much DEX liquidity, which might be a cause for concern if you are a DEX trader.

Spot trading markets as of 2024 are more than sufficient for Siacoin. The buyer confidence, trading volume, trading frequency, and liquidity are in the favorable zone. This is a good sign for Siacoin’s price.
Siacoin price charts
Here, we will consider crucial Siacoin charts from 2022, especially where the focus is on market volatility and the Sharpe ratio. This will help determine ROI against risk. These charts will offer insights into why SC moved so aggressively in 2023.
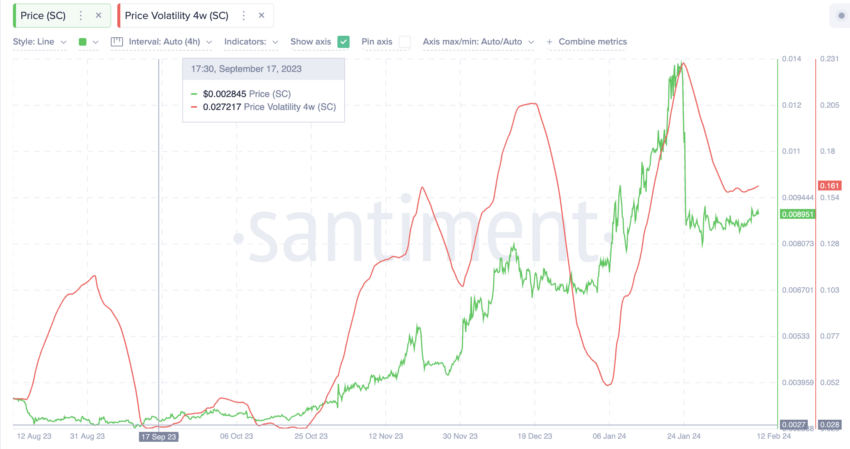
Siacoin volatility
The SC volatility chart shows that every time Siacoin’s volatility crosses 1.10, there is a significant price drop. Therefore the overall volatility of the crypto space will also play a major role in determining Siacoin price.
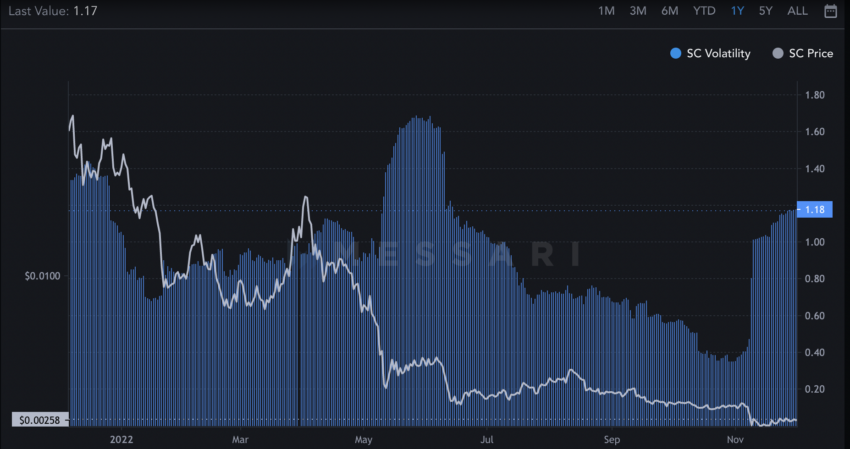
Volatility in the past year was the highest in May. This aligns with the significant bearish trends the crypto market has experienced.
The more recent volatility chart shows how SC surged post hitting a volatility bottom in September 2023, another reason why the prices surged.
Siacoin Sharpe Ratio
A Sharpe ratio above one is desirable for a crypto asset to remain in the profitable zone. Siacoin experienced the same in March when the Sharpe ratio was at 3.75. The price of SC at that point was $0.0109. However, large drops indicate that holders either sold or the risk exposure increased over time. Presently, the Sharpe ratio is -2.2, indicating a bearish short-term future.
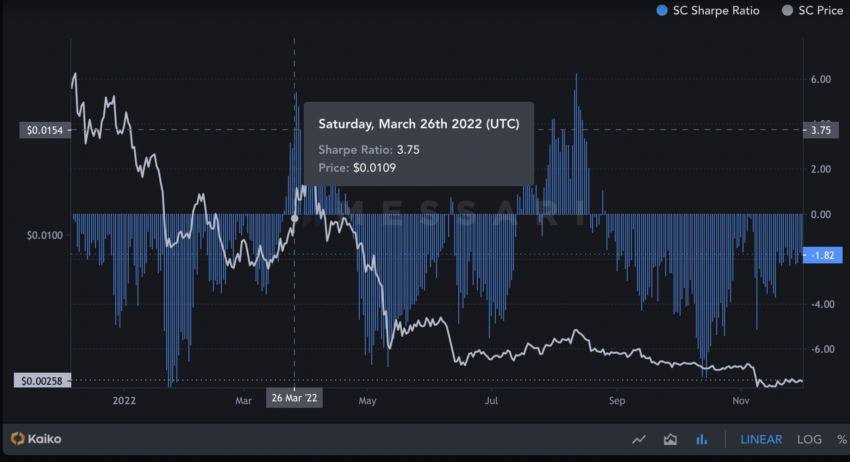
Do note that the Sharpe ratio follows a pattern. It starts low, moves to its lowest, and then improves.
A typical low-to-high move takes roughly four months to complete. So, at Siacoin’s counter, we can expect the next price surge to be around January 2023. We will cross-check it while working through SC’s technical analysis.
We predicted price surges in 2023, and SC obliged.
The price of Siacoin and its social presence
Siacoin’s social presence waned in 2022. Twitter followers had declined gradually in 2022, trailing the price dip.
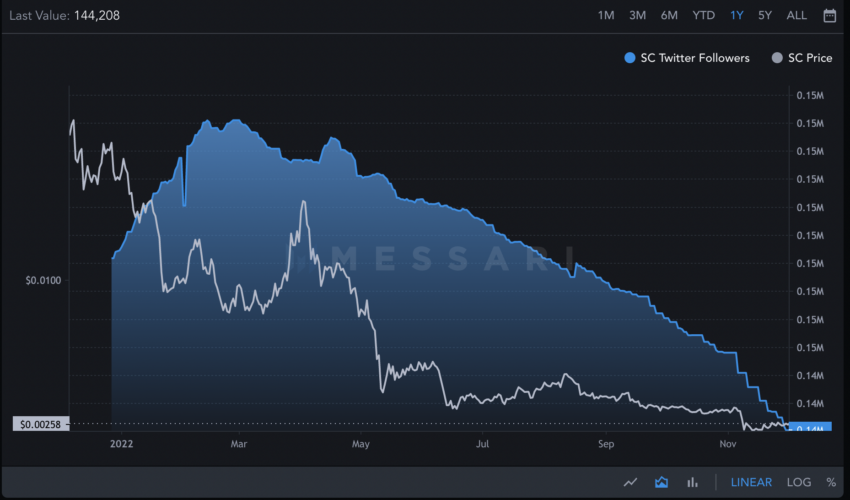
However, it has been increasing throughout 2023, another reason for the rise of the meteoric price.

Siacoin price prediction and technical analysis
Before we target the broader patterns, let us quickly analyze the short-term SC price prediction levels,
SC short-term price analysis
We might see a quick correction at SC’s counter, courtesy of it trying to break the lower trendline of the ascending triangle pattern. Even the Relative Strength Index (RSI) indicator is showing a drop in momentum, courtesy of the lower-low formation and a bearish divergence.

Therefore, in 2024, we can expect SC to hit a lot of $0.0066, provided the price dips further.
Let us now shift attention to the weekly patterns.
Siacoin weekly charts
Now we have considered the fundamentals, let’s shift our attention to the price charts. Here is a zoomed-out, bird’s eye view of Siacoin’s price chart, as per the weekly timeframe on the Kraken exchange.
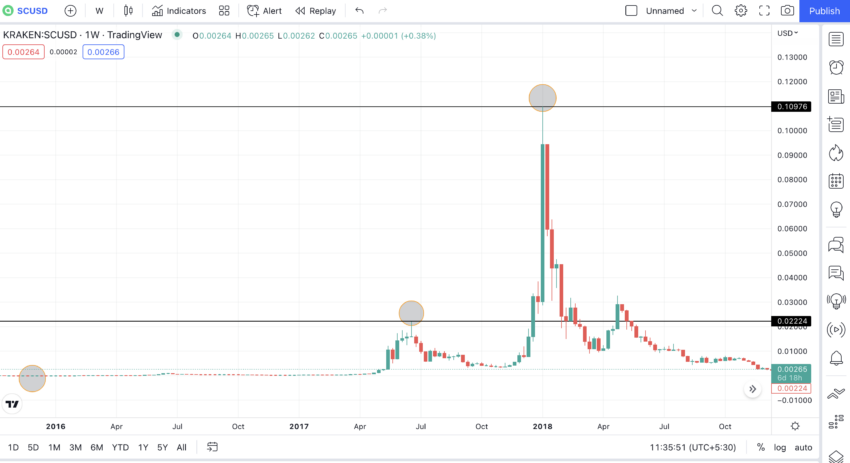
Here are the insights that we can infer from the chart:
- Siacoin made a low of $0.00001131 on Dec. 1, 2015.
- Siacoin made an all-time high of $0.1117 on Jan. 6, 2018.
- The weekly pattern is clear. A lower high leads to a higher high before a foldback (mirror) pattern with a higher and lower high.
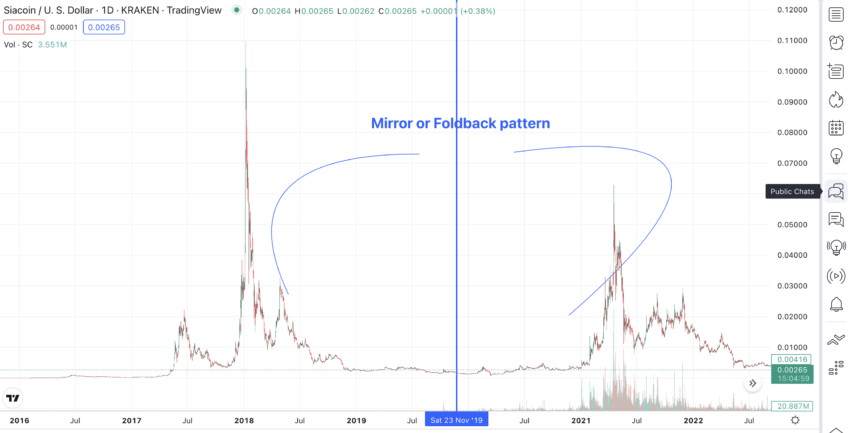
If the mirror pattern continues, the next move would be a lower high, followed by a higher high. Hence, the outlook is bullish.
Price changes (weekly pattern)
Outlook: Moderately bullish
Here is a zoomed-out first pattern with the following prices:
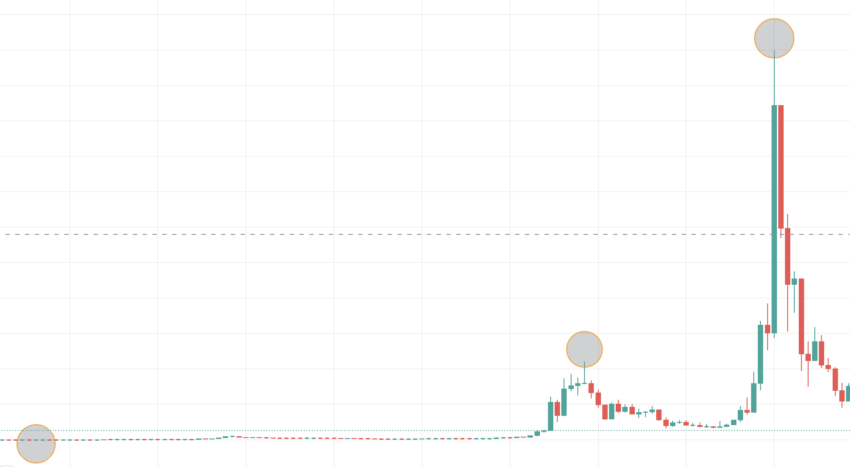
The price of Siacoin initially was $0.00001131 on December 1, 2015, and then it increased to $0.02224 by June 19, 2017. The Siacoin price further escalated to $0.1117 by January 6, 2018. The time it took for the cost to move from the first point to the second point was 566 days, and from the second point to the third point, it took 201 days. The percentage change in price from the first point to the second point was 19650%, although this dramatic increase can be attributed to the market stabilizing initially. The price experienced a 402% change from the second to the third point.
Here is a zoomed-out second pattern with the following prices:
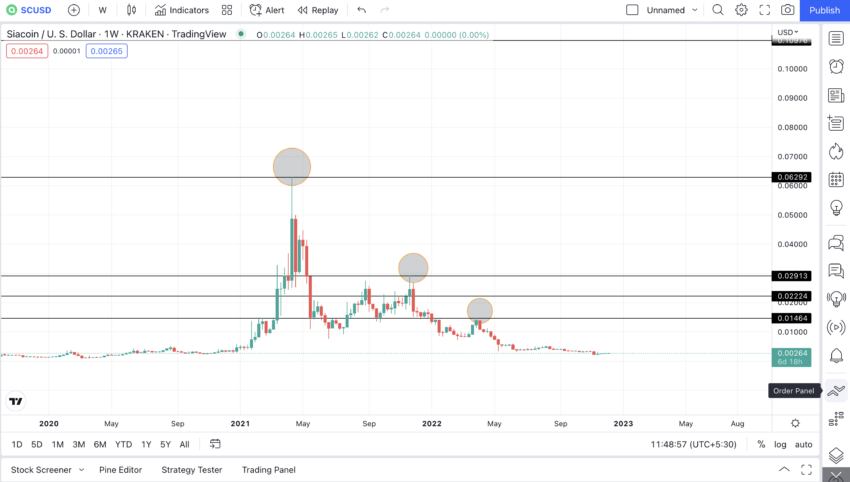
Note that as it is a foldback pattern, we will take the prices in reverse, with the lowest point being Point 1.
The price of Siacoin at the first point is $0.01464 on March 28, 2022. The price of Siacoin at the second point is $0.02913 on Nov. 22, 2021. The price of Siacoin at the third point is $0.06292 on April 12, 2021.
Calculations
The duration from the first to the second point was 126 days; from the second to the third, it extended to 224 days. The price change percentage from the first to the second point was 99%; from the second to the third, it increased to 116%. The average duration for these changes was calculated at 175 days, with the average percentage change reaching 108%.
Highlighting specific patterns, a move over 200 days from 2017 to 2018 resulted in a significant 400% price change for Siacoin. In a subsequent pattern, a nearly 200-day period (specifically 175 days) from 2021 to 2022 led to a price movement of over 100%, equating to a 116% change. This comparison indicates that, over the same timeframe, the intensity of Siacoin’s price movements diminished by a factor of four.
We can, therefore, assume that the percentage of highs reduces by 25% each year. Therefore, for the next cycle, the highest high will be at a 75% peak compared to the lowest high.
High-to-high charting
Outlook: Neutral
Now, let’s take the percentage change and time difference between the highest point of the two cycles. This will help us understand where the prices will be in 2023.
Point 3 of the first 1st pattern is $0.1117 on Jan. 6, 2018. Point 3 of the second pattern is $0.06292 on April 12, 2021. The time between these points was 1192 days, with a percentage change of -44%.
So the next high could be at a 55% low compared to the second pattern’s high. This is considering that the intensity between each high reduces by 25% annually.
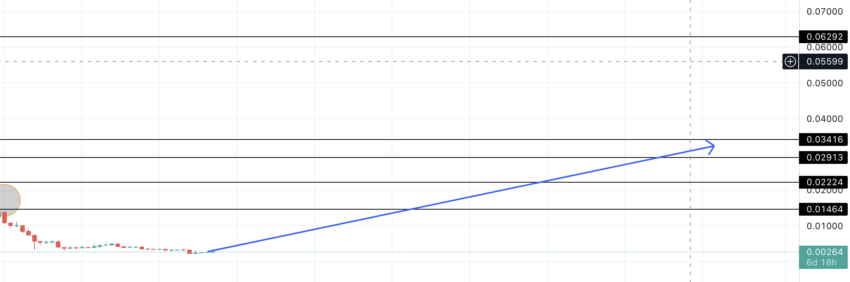
We expect the high to be at $0.034606 in three-plus years from April 2021. Hence, the price of Siacoin could reach $0.034606 around July 17, 2024.
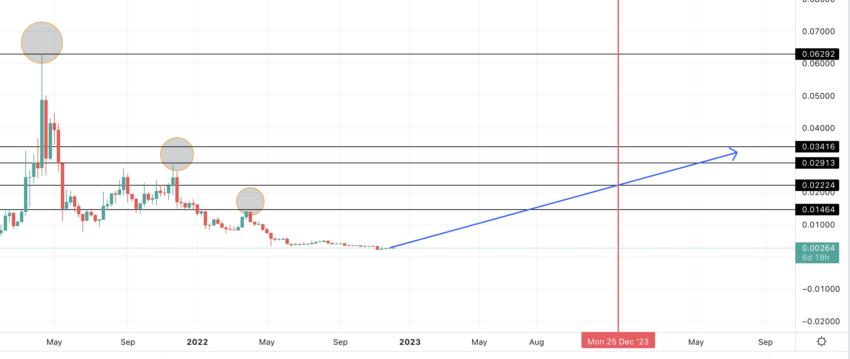
Here is the chart that traces the path till 2024.
Siacoin price prediction 2023
In 2023, SC recorded a high of $0.013. Here is what’s the maximum and minimum levels we predicted in 2023 for SC.
Now, if we follow the path linearly, the highest price of Siacoin in 2023 can go as high as $0.0224. Do note that this level corresponds to the 2nd high made during the 1st pattern.
This development validates our foldback pattern hypothesis, as even the third cycle is expected to mirror the first and second.
Here is the vertical line that shows the extrapolated price level:
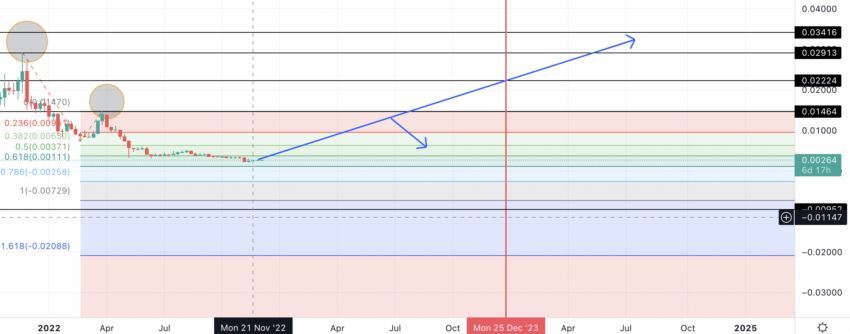
As the linear path shows, prices should move up from here. We believe that Siacoin will not touch the lows of 2022 in 2023. Per Fib levels, the lows in 2023 might now go below $0.00371, which coincides with the 50% Fib level. As per the drawn path, the lows can be reached in August 2023.
Here is the path that traces the low:
However, to reach the high of $0.0224, Siacon’s weekly moving averages would require breaching. The green line, or the 50 weekly moving average, will need to cross above the yellow and red lines to start the next swing cycle.
Also, the moving averages act as immediate resistance lines for Siacoin.
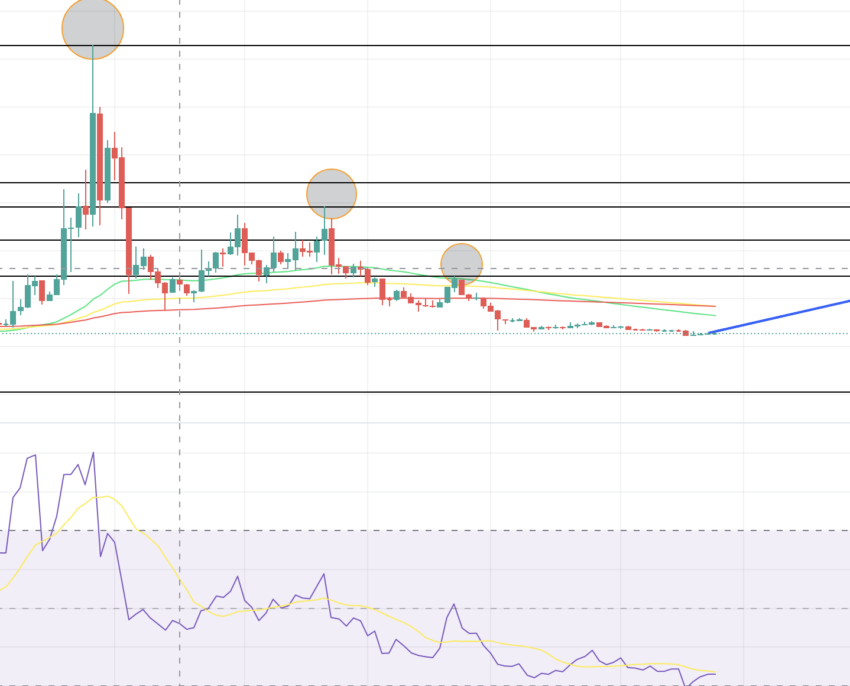
The extrapolated line’s slope could change depending on when the moving averages give the correct indications.
In the short term, the RSI (relative strength index) looks weak and should move above 50 to signal an up move.
Siacoin Price Prediction 2024
Per the Fib levels drawn, a more generous price prediction level for Siacoin (SC) going into 2024 could be $0.03416. However, reaching this level might take SC until the end of 2024. As for the low, our short-term analysis of SC hints at a $0.0066 level for this Decentralized storage project.
Project ROI from 2023 base level: 325%
Siacoin Price Prediction 2025
Outlook: Bullish
If we extend the extrapolated path further, we see that Siacoin can reach $0.05815 by the end of 2025. Once this level is breached, the Siacoin price prediction 2026 model becomes even more interesting. The immediate target would next be to breach $0.06292, defeating the broader lower-high formation. Siacoin could then be pushed towards newer highs.
Here is what the extrapolated path looks like:
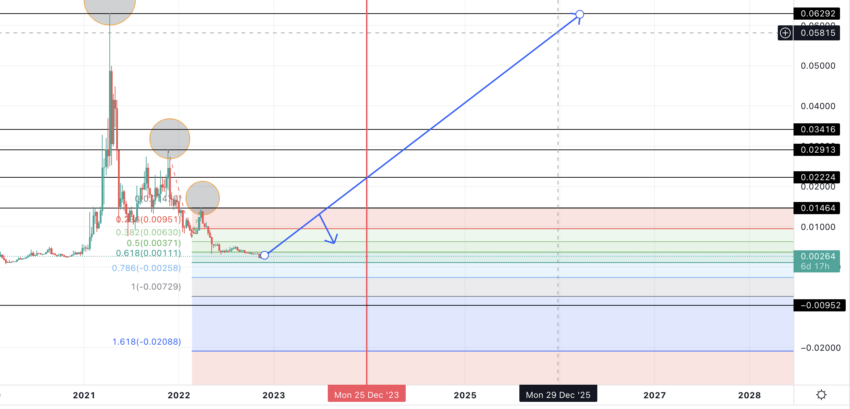
Project ROI from 2025 base level: 560%
Siacoin Price Prediction 2030
Outlook: Bullish
Linear extrapolation for 2025 paints a bullish picture per the Siacoin price prediction 2028 model. By 2028, Siacon should breach its all-time high of $0.1117 or come close and move up to $0.128 in 2029. By 2030, Siacoin may reach 13 cents if the projects compete with Filecoin and Storj.
As for the lows, the previous resistance zones would begin to act as support levels.
Project ROI from 2030 base level: 1169%
Siacoin long-term price prediction (up to 2035)
Outlook: Moderately bullish
You can easily convert your SC to USD
For a long-term SC price prediction model, this table gives maximum and minimum price predictions starting from 2023:
| Year | | Maximum price of Siacoin (SC) | | Minimum price of Siacoin (SC) |
| 2024 | $0.034616 | $0.0066 |
| 2025 | $0.05815 | $0.02913 |
| 2026 | $0.07563 | $0.03703 |
| 2027 | $0.09227 | $0.04703 |
| 2028 | $0.1097 | $0.05972 |
| 2029 | $0.1243 | $0.05815 |
| 2030 | $0.1370 | $0.07585 |
| 2031 | $0.1509 | $0.09632 |
| 2032 | $0.1811 | $0.1223 |
| 2033 | $0.2301 | $0.1553 |
| 2034 | $0.2761 | $0.1973 |
| 2035 | $0.3313 | $0.2505 |
Every SC price prediction point considers linear growth. The calculations might not hold if a significant sentimental driver emerges. Also, we should monitor immediate competitors like FIL and STORJ. This will support the analysis of the average price of SC in any given year.
How accurate is the Siacoin price prediction?
The Siacoin price prediction is fairly accurate as it considers mathematical pattern formation and extrapolation. The growth of decentralized storage as a service or use-case must evolve if Saicoin is to stay true to our price predictions.
Frequently asked questions
Does Siacoin have a future?
Is Siacoin a good investment?
How high will Siacoin go in 2025?
What was the highest price of Siacoin?
What is Siacoin used for?
What makes Siacoin unique?
Disclaimer
In line with the Trust Project guidelines, the educational content on this website is offered in good faith and for general information purposes only. BeInCrypto prioritizes providing high-quality information, taking the time to research and create informative content for readers. While partners may reward the company with commissions for placements in articles, these commissions do not influence the unbiased, honest, and helpful content creation process. Any action taken by the reader based on this information is strictly at their own risk. Please note that our Terms and Conditions, Privacy Policy, and Disclaimers have been updated.