While “digital money” is a term thrown around often, Nano is one of the few crypto projects that embodies this concept. This Nano price prediction piece aims to shine some light on the project’s likely future. In doing so, we consider whether Nano’s native token, XNO, could be a good investment option. Using price charts, on-chain metrics, and fundamental analysis, this Nano price prediction piece considers whether this innovative project has staying power. Let’s take a look.
- Nano fundamentals: why a price forecast is even necessary?
- Nano tokenomics and future price forecast
- Nano charts and on-chain metrics
- Nano price prediction using technical analysis
- Nano (XNO) price prediction 2024
- Nano (XNO) price prediction 2025
- Nano (XNO) price prediction 2030
- Nano (XNO’s) long-term price prediction until 2035
- Is the Nano (XNO) price prediction accurate?
- Frequently asked questions
Nano fundamentals: why a price forecast is even necessary?
Nano is a relatively lightweight project with exceptional utility. It doesn’t complicate its presence. Instead, it aims to remain a means to initiate instant, feeless payments with a focus on security. Therefore, it isn’t incorrect to consider Nano as a “medium of exchange,” something Bitcoin is — or at least is trying — to be.
Nano’s core transactive nature is not what makes it unique. Instead, this Colin LeMahieu-founded crypto project is based on the DAG architecture rather than a standard blockchain.
Did you know?DAG, or Directed Acyclic Graph, is a technology that can span in any possible direction, unlike a blockchain that follows chronology. It’s as if each transaction is linked to multiple blockchains. Hence, Nano promises speed, capable of reaching 1,000 TPS when necessary.
Overall, Nano looks desirable as it already feels different, courtesy of an innovative DLT or Distributed Ledger Technology. And if something is exclusive in crypto, the price forecast often reflects optimism around this fact.
Nano tokenomics and future price forecast
The good news is that Nano has a supply cap. The limit is almost 133.25 million XNO tokens. Additionally, all of those tokens are unlocked, making XNO liquid, courtesy of Nano’s 100% circulating supply.
There are a number of advantages that come with 100% token unlocking:
- Nano’s supply is well-distributed, making it one of the more decentralized projects.
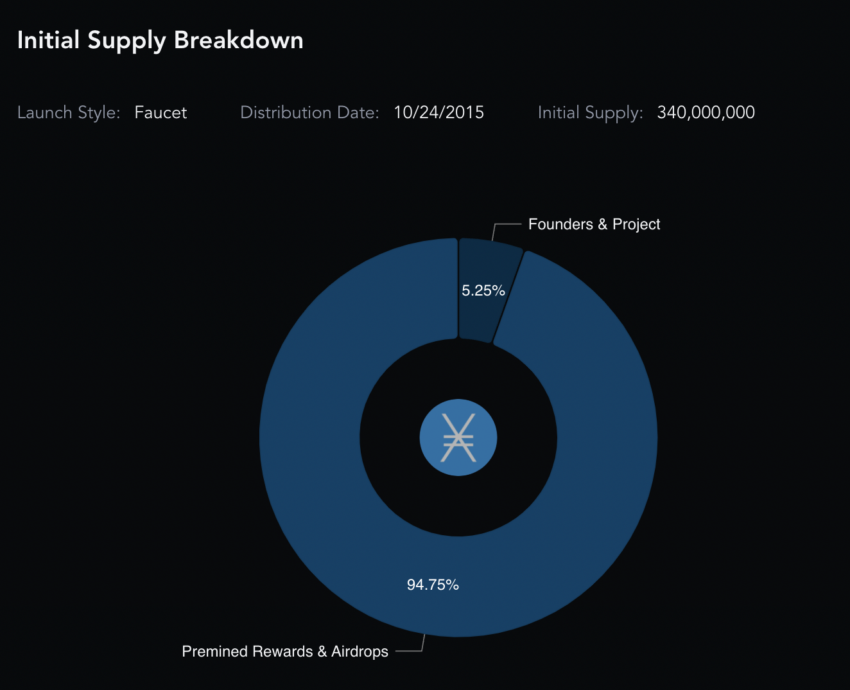
- Also, the initial supply was meant to be 340 million, but only 39% was released as the max cap, and the remaining 61% was burned. This means that the token model isn’t meant to incentivize the founders but to create scarcity — which might portray XNO as a store of value.
- The supply distribution was equally transparent, with rewards and airdrops to users forming 94.75% of the supply and only 5.25% making the project-specific funds.
Nano has a relatively transparent token model with fixed supply tokenomics, furthering the scope of XNO tokens to reach maximum prices. However, wider adoption is still necessary.
Nano charts and on-chain metrics
When looking at Nano (XNO) from an investment perspective, it is important to look at the Sharpe ratio. This ratio, identified in December 2022, measures Nano’s relative returns over time in relation to its risk. In simple terms, anything above one is good.
Nano’s all-time Sharpe ratio chart, as of December 2022, is as follows:
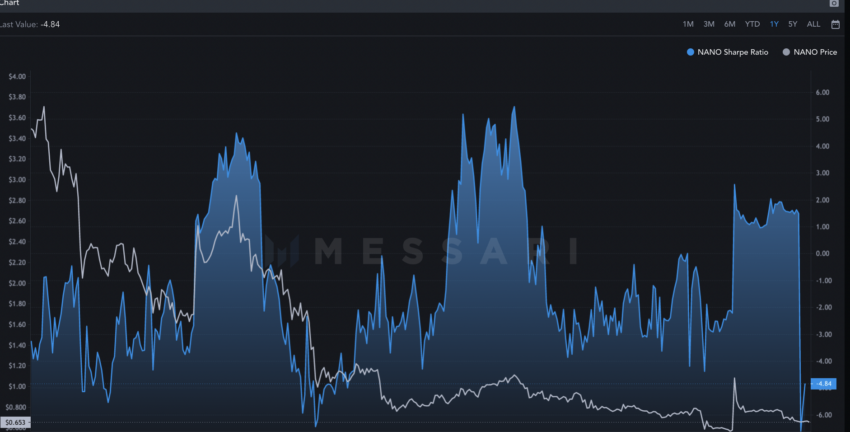
Do note that prices peaked every time the ratio did the same, moving into higher positive territory. The ratio was high even a few days back but has now dropped under 0, hinting at a near-term correction.
The maximum prices attained by XNO tokens were during periods with high Sharpe ratios.
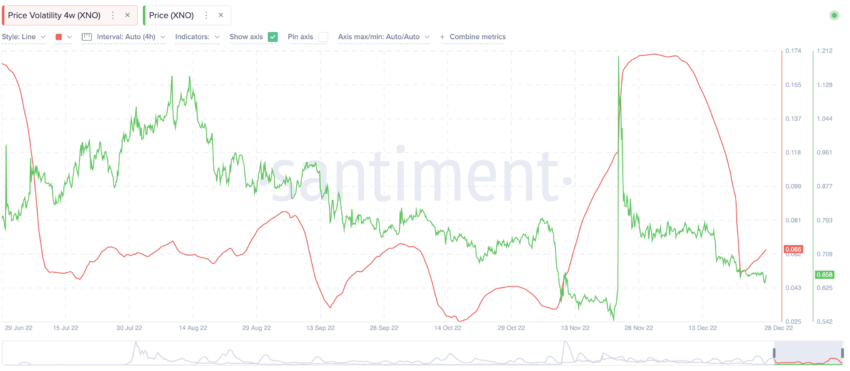
Also, Nano’s price volatility seems to have surged in December 2022. Do note that as the volatility peaked, the prices dropped. Even the Sharpe ratio dipped during the same time. The trading volume dipped to single digits (in millions) between November and December when the Sharpe ratio dropped and volatility peaked.
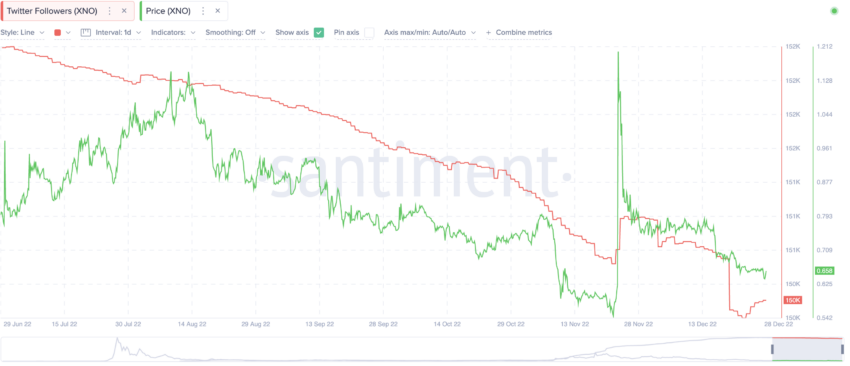
Finally, Nano’s Twitter followers have dropped significantly since June 2022. The prices responded similarly.
Nano price prediction using technical analysis
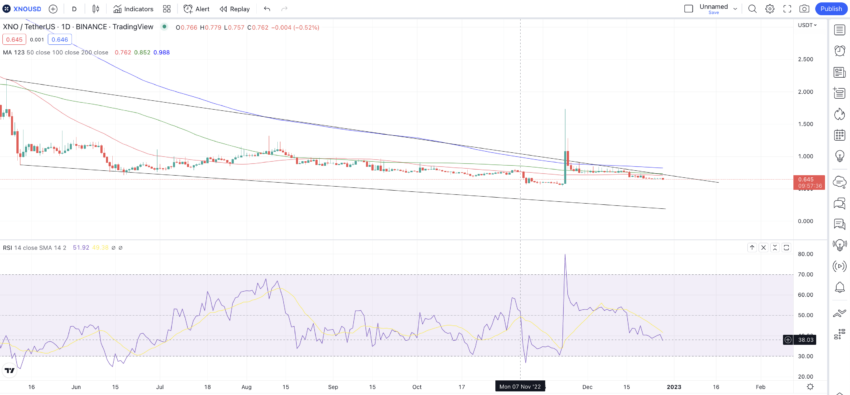
We can now move to technical analysis to try to locate a discernible pattern using Nano’s price chart:
But before we do, here are the important insights that might make sense and help prepare a better price forecast model for XNO, per the levels it was forming in late 2022.
- XNO’s all-time high price is $37.62, which surfaced on Jan. 2, 2018.
- Currently, XNO is down 98.29% from its all-time high price.
- XNO, per the daily chart identified in 2022, is trading inside a falling wedge pattern. This could turn bullish if the yellow line (50-day moving average) crosses above the 100-day moving average line (green one).
- The RSI is the neutral to oversold territory, hinting at some near-term range-bound movement for XNO.
Now, if we zoom out on the daily chart, there is a noticeable pattern:
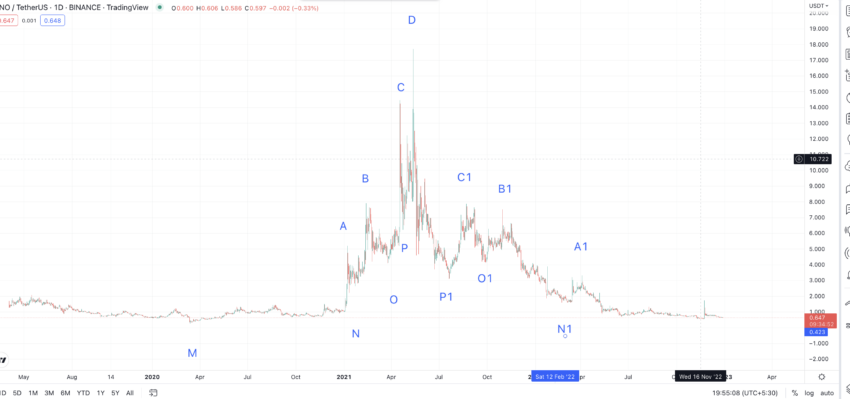
There is a range-bound zone at the beginning and at the end of the pattern. Plus, the highs and lows in between more or less look symmetrical. It is safe to assume that XNO follows a foldback pattern, where the first part is made of higher highs, and the second part is made of lower highs.
And if the principle of foldback is followed, the next pattern will repeat the first part — the higher highs.
Price changes
Our first task is to find the M1 or the low that would act as the first point of the new pattern. To find the low, we can locate all the highs to lows from D to M and D to N1.
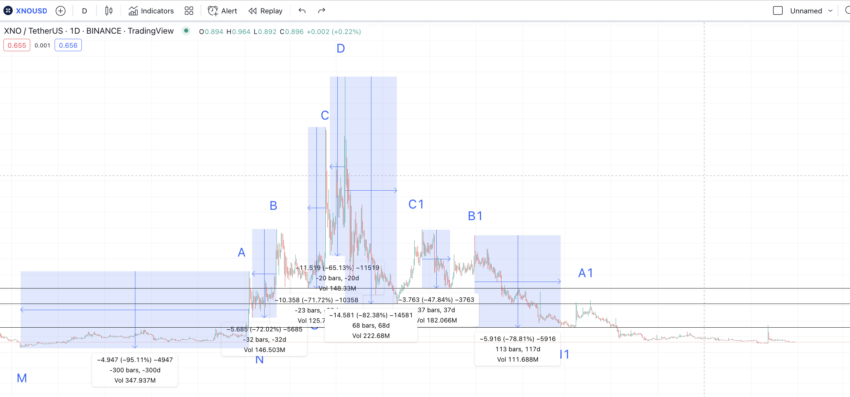
High to low (D to M) data set 1 is:
D to P = 20 days and -65.13% price change; C to O = 23 days and -71.72% price change; B to N = 32 days and -72.02% price change; A to M = 300 days and 95.11% price change.
High to low (D to N1) data set 2 is:
A to P 1 = 68 days and -82.38% price change; C1 to O1 = 37 days and -47.84% price change; B1 to N1 = 117 days and -78.81% price change.
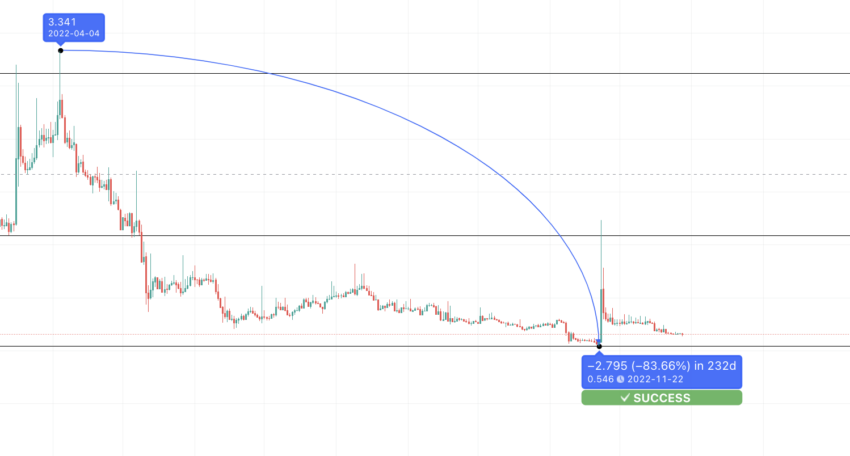
Keeping both directions in mind, the average high-to-low percentage change comes to 73.28%. So the new low from A1, M1, should at least be $73.28. As per the table, the distance can vary between 20 and 300 days. (Timelines can change in a bear market depending on the sentiments of the crypto market.)
The path drawn shows that XNO’s price touched the average low quite a few times after A1. The successful touch shows that our Nano price prediction is on the right path. Instead, the price of XNO dropped lower to $0.546.
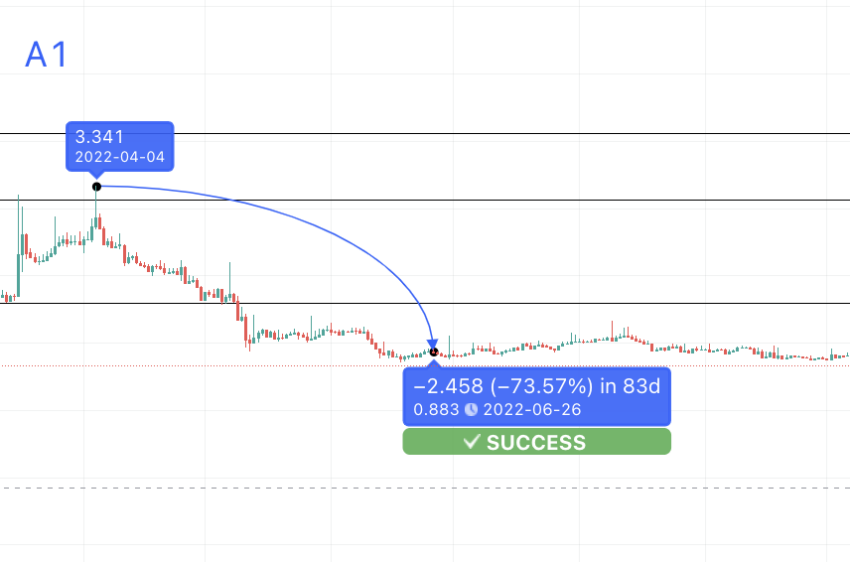
This is the 2022 low. Now that we have the low M1, we can draw a path from M to D and M1 to D to build a data-informed Nano forecast model.
Price change (low to high)
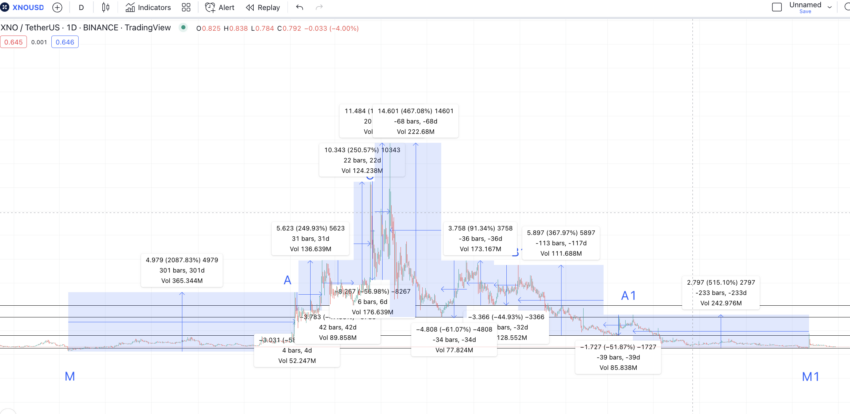
So we start from M and move our way up:
Path 1: (data set 3)
M to A = 300 days and 2087.83% price change; A to N = 4 days and 58.09% price change; N to B = 32 days and 249.93% price change; B to O = 42 days and -47.93% price change; O to C = 23 days and 250.57% price change; C to P = 6 days and -56.98% price change; P to D = 20 days and 183.96% price change.
Path 2: (data set 4)
M1 to A1 = 233 days and 515.10% price change; A1 to N1 = 39 days and -51.87% price change; N1 to B1 = 117 days and 367.97% price change; B1 to O1 = 32 days and -44.93% price change; O1 to C1 = 37 days and 91.34% price change; C1 to P1 = 34 days and -61.14% price change; P1 to D1 = 68 days and 467.08% price change
Now we have all the data points. We can calculate the average of all the low-to-highs (values in positive) to find the next high after M1.
The average percentage growth comes to be 526.62%, and the average distance is 104 days. However, we are in the bear market. Therefore, from the positive values, the 91.34% growth looks the most realistic at this point.
So let us plot a high of 91.34% in 104 days from M1. We get the high at $1.1 and somewhere in March 2023. Consider this as A2.
Nano (XNO) price prediction 2024
Outlook: Bullish
Our XNO price prediction for 2023 was successful. Here is what it mentioned and how it sets the tone for 2024.
Now we have the first point of the new pattern: A2, at $1.1. Using the data from data set 3 and data set 4, the average percentage drop from A2 to N2 comes out at 54.98%. The distance can vary and surface anywhere within 39 days (refer to A1 to N1 distance in data set 4).
We now must draw the next line from A2 to N2. The level shows at $0.505. However, there is a very strong support level at $0.737, which can be the minimum price of XNO.
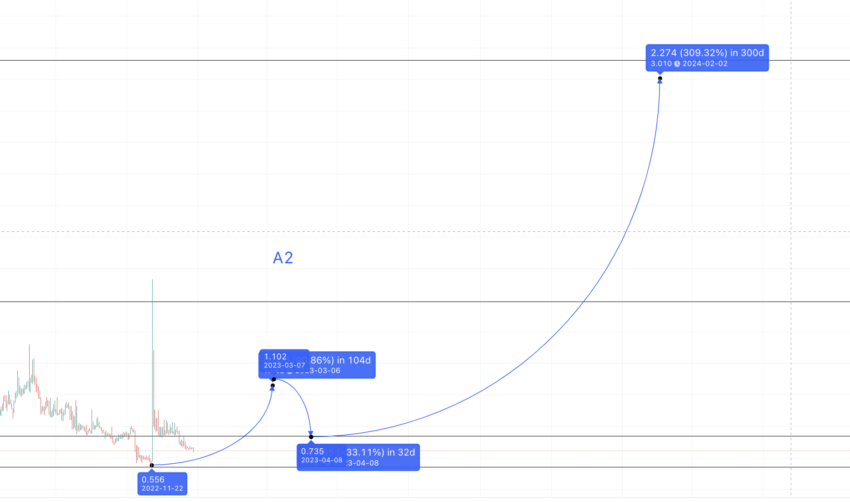
This is not where our 2023 price prediction ends. Nano can tread the path from N2 to B2 in 2023. The figures from data set 3 and data set 4 put the distance and percentage change between N2 and B2 in 75 days at 308.95%.
The new high, B2, surfaces at $3.005. While we expect this level to surface in 2023, an extended bear market may push this into 2024. The highest distance curve can be 300 days, which you can trace from data set 1 and data set 3. This puts the Nano price prediction for 2024 at $3.010, or B2.
Projected ROI from the current level: 150%
Nano (XNO) price prediction 2025
Outlook: Bullish
The new low for 2024 can use the data from table 3 and table 4, where the points B to O and B1 to O1 are traced. The average of those values comes out to be: 37 days and at a low of 46.43%.
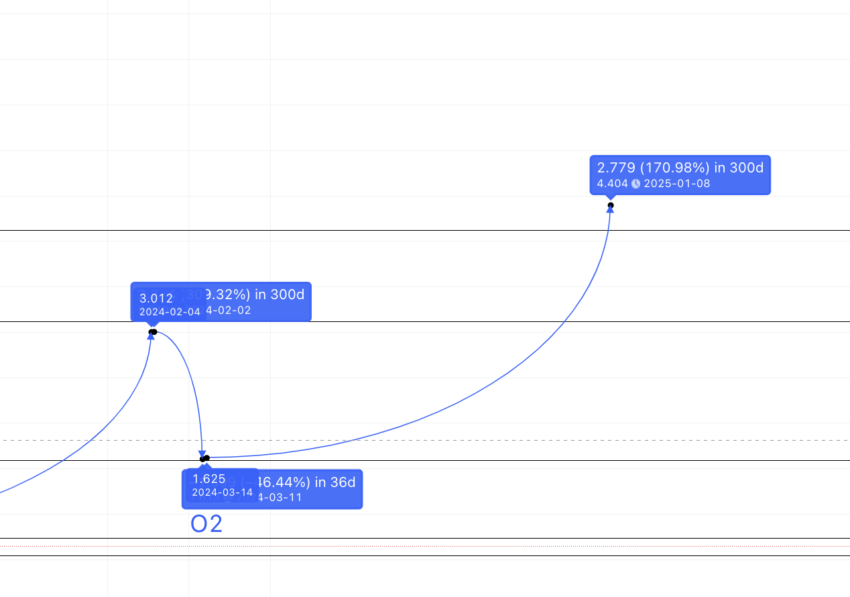
The low in 2024 can therefore surface at $1.613. The next high — O2 to C2 — might surface anywhere between 91.34% and 250.57%, using figures from data sets 3 and 4. Considering the aftereffects of the bear market, a more realistic high would be in 300 days (max from the tables above) and at a high of 170.95% (the average of 91.34% and 250.57%).
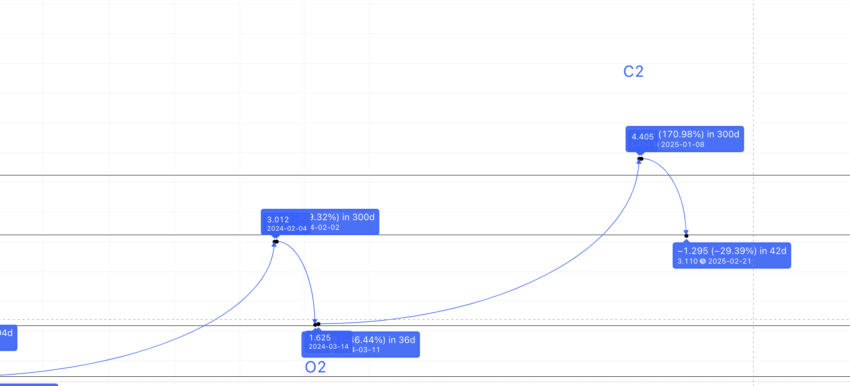
Tracing the path gives the Nano price prediction for 2025 high as $4.40 (C2). That year, the low could surface at 59.06% from C2. This level is somewhere close to the $1.80 mark. However, Nano has very strong support at $3.12 and is in an uptrend. That might be the low-level Nano price prediction for 2025.
Projected ROI from the current level: 267%
Nano (XNO) price prediction 2030
Outlook: Bullish
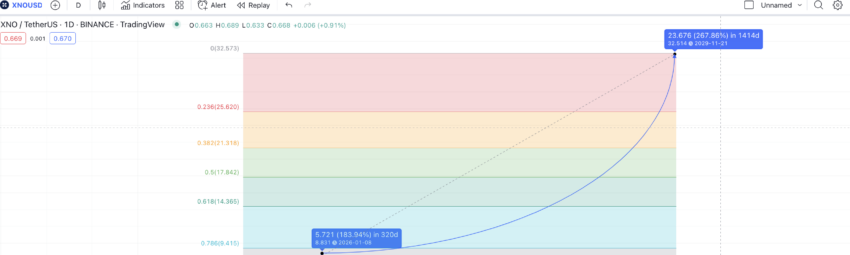
Now that we have the data till 2025 and point P2, we can use the same to trace the path to the new peak or the new D (D1). Using the data sets above, the average P to D price hike is 325.52%. A more realistic price hike would be 183.96% — the lower number making the average.
The hike can show up in the next 300 days, using the data from the tables above. This puts the early 2026 high at $8.831.
Now, we have a high for 2026 and the minimum price of XNO in 2025. We can connect the points using the Fib levels, which would help us trace the highs till 2030. Therefore, if Nano breaches the $4 mark by 2025, the Fib extension levels put the Nano price prediction for 2030 at a high of $32.51.
For that to hold, the Nano price prediction for 2028 should put the price of XNO at $17.84.
Projected ROI from the current level: 2609%
Nano (XNO’s) long-term price prediction until 2035
Outlook: Very bullish
Do note that the Nano price prediction for 2029 and 2030 depends on the maximum prices of Nano tokens from 2023 to 2028. Yet, if you want to extend this price forecast using technical analysis, here is a table that covers the maximum and minimum price of XNO till 2035.
You can easily convert your XNO to USD
| Year | | Maximum price of XNO | | Minimum price of XNO |
| 2024 | $3.010 | $1 |
| 2025 | $4.40 | $3.12 |
| 2026 | $8.831 | $5.47 |
| 2027 | $11.92 | $9.29 |
| 2028 | $17.84 | $13.91 |
| 2029 | $23.19 | $18.08 |
| 2030 | $32.51 | $25.35 |
| 2031 | $48.76 | $38.03 |
| 2032 | $65.83 | $51.34 |
| 2033 | $88.87 | $69.31 |
| 2034 | $97.76 | $76.25 |
| 2035 | $122.20 | $95.31 |
The years with maximum growth are expected to have the Nano price prediction lows higher than last year’s highs.
Is the Nano (XNO) price prediction accurate?
This Nano price prediction model is unique in its own way. While it hinges heavily on data-backed technical analysis, it also considers the Nano ecosystem’s likely growth rate. Plus, the focus similarly shifts to tokenomics, on-chain metrics, and other trading-specific insights — helping prepare an accurate and realistic price forecast model. Hence, you can consider the expected maximum and minimum prices mentioned throughout the piece to be fairly reliable. Of course, the crypto market is volatile by nature — but note we have also factored likely bear and bull cycles into this analysis.
Frequently asked questions
Does Nano have a future?
Is Nano crypto a good investment?
Can Nano coins reach 1000?
Is Nano better than Bitcoin?
Who is behind Nano crypto?
What makes Nano unique?
Disclaimer
In line with the Trust Project guidelines, the educational content on this website is offered in good faith and for general information purposes only. BeInCrypto prioritizes providing high-quality information, taking the time to research and create informative content for readers. While partners may reward the company with commissions for placements in articles, these commissions do not influence the unbiased, honest, and helpful content creation process. Any action taken by the reader based on this information is strictly at their own risk. Please note that our Terms and Conditions, Privacy Policy, and Disclaimers have been updated.