

Investors often face uncertainty when it comes to changes in the market. Polygon, previously known as MATIC, has now transitioned to the POL network, leading to questions about its future price. Many are wondering if the previous predictions are still relevant. In this POL price prediction, we’ll explore how the move to POL could impact price expectations for 2025, 2026, and beyond.
KEY TAKEAWAYS
➤ The transition from MATIC to POL represents a new phase for the network, with long-term price predictions showing potential growth up to $203.53 by 2035, driven by layer-2 adoption and interoperability.
➤ Partnerships with major brands like Nike, NuBank, and SHOWTIME, along with NFT migrations such as y00ts, solidify Polygon’s position as a key player in the DeFi and NFT spaces.
➤ Predicted highs for 2025 ($5.38) and 2030 ($46.39) reflect consistent upward momentum, underpinned by real-world use cases and innovations like zkEVM and hybrid proof-of-stake consensus.
- Polygon (POL’s) price prediction 2024-2035
- POL price prediction long-term: Calculations and patterns
- Polygon (POL) price prediction 2025
- Polygon (POL) price prediction 2026
- Polygon (POL) price prediction 2027
- Polygon (POL) price prediction 2028
- Polygon (POL) price prediction 2029
- Polygon (POL) price prediction 2030
- POL fundamentals
- Is the POL price prediction model accurate?
- Frequently asked questions
Polygon (POL’s) price prediction 2024-2035
If you wish to hold POL, previously MATIC, through 2035, here is a table that captures the minimum and maximum prices for the given duration. You will soon read the logic behind each price move.
| Year | Maximum price of POL | Minimum price of POL |
| 2025 | $5.38 | $1.75 |
| 2026 | $8.07 | $5 |
| 2027 | $10.08 | $6.25 |
| 2028 | $15.13 | $9.38 |
| 2029 | $26.48 | $16.41 |
| 2030 | $46.39 | $36.18 |
| 2031 | $57.98 | $45.22 |
| 2032 | $86.98 | $67.84 |
| 2033 | $104.37 | $81.40 |
| 2034 | $135.68 | $105.83 |
| 2035 | $203.53 | $126.18 |
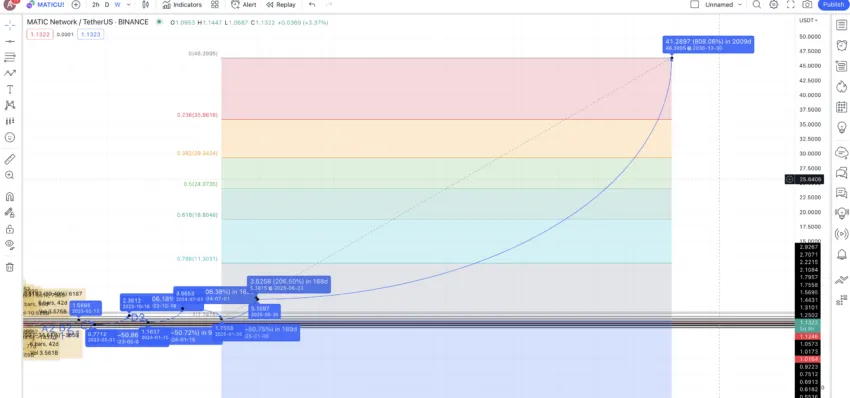
POL price prediction long-term: Calculations and patterns
Pattern identification
Update: Despite the new price levels in 2025, the broader patterns still hold as they rely on historical data and patterns.
The weekly chart reveals a clear yet interesting pattern. Each leg of the pattern comes with a high, a peak, and then a bottom. Post-hitting the bottom, there comes another set of higher highs (two to be exact) and then the peak, two lower lows, and a bottom.
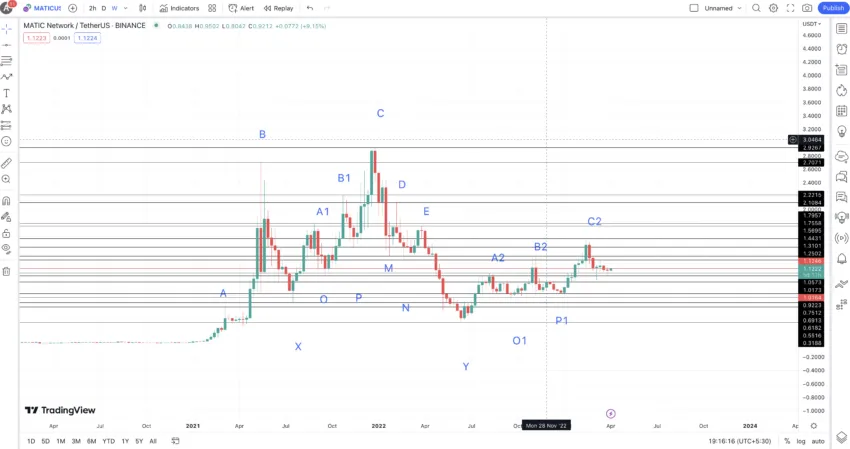
After hitting that bottom, another set of higher highs is forming (this time three). Per our assumptions, the next high could be the peak of this pattern, after which a bottom might follow a few lower lows (three or more).
Price changes
We shall now locate the price percentages and distance between the points corresponding to three separate paths: A to X, X to Y, and Y to C2.
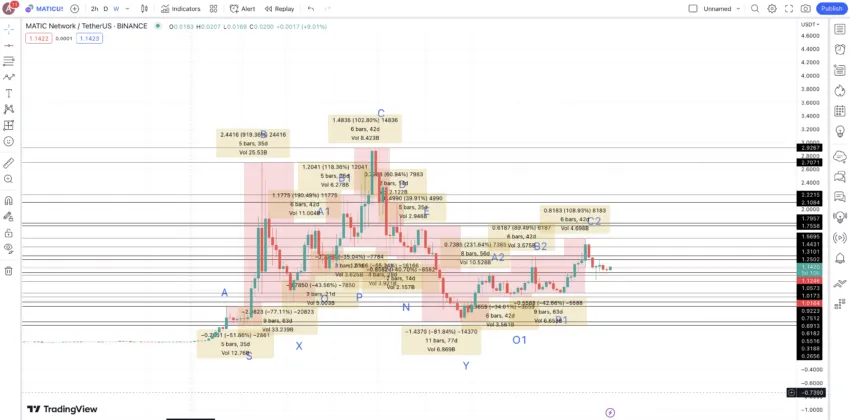
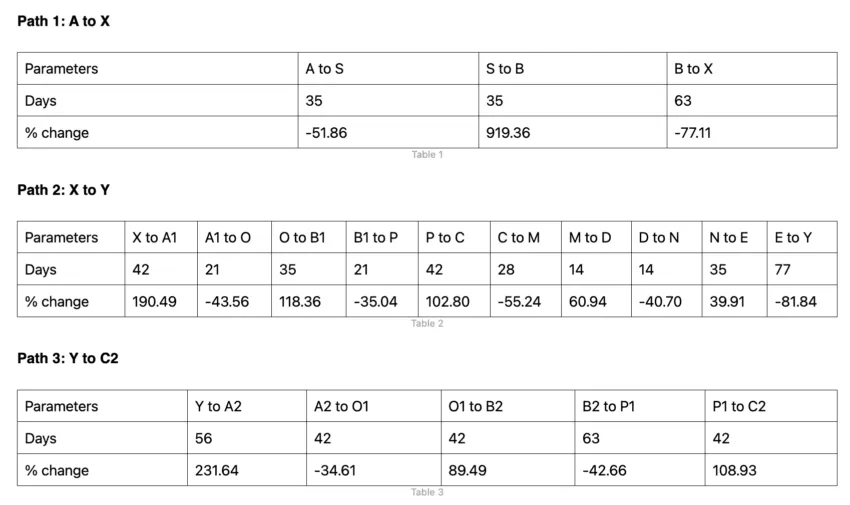
We can use the non-negative and negative column values to track the next low-to-high and high-to-low moves.
Calculations
We will now use the gathered data sets to project the Polygon (POL) price through to 2035. Our analysis includes two key trends. Firstly, we observe a low-to-high average price increase of 206.49%.
The time frame for this growth can range from 14 to 56 days. Secondly, we note a high-to-low average price decline of 50.73%. This downward trend can occur within a period ranging from 14 to 77 days. These insights form the basis of our long-term projection for Polygon’s price up to 2035.
Polygon (POL) price prediction 2025
| Outlook | Max expected price | Projected ROI |
| Bullish | $5.38 | 1354.05% |
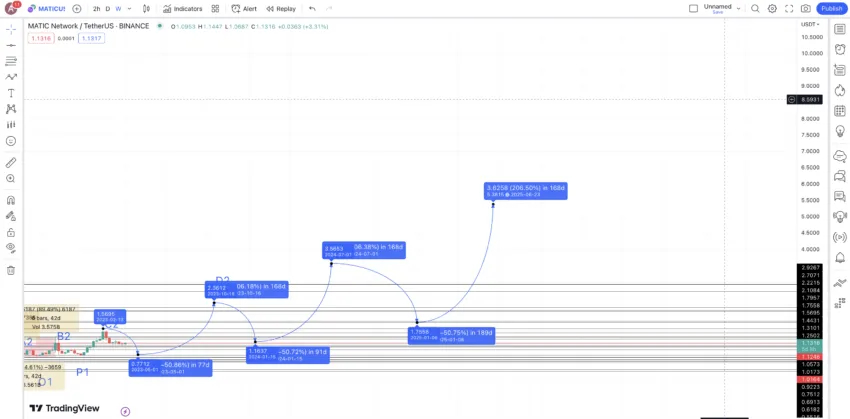
The price of Polygon (POL) might make some quick lows and highs post hitting the 2024 high. However, we can expect the low in 2025 to surface at a 50.73% dip by early 2025. This puts the 2025 low at $1.75.
The high from this low could again show up at the peak of 206.49%, putting the same at $5.38 by mid-2025.
Projected ROI from the current level: 1354%
Polygon (POL) price prediction 2026
| Outlook | Max expected price | Projected ROI |
| Bullish | $8.07 | 2081% |
By 2026, we expect the market momentum built in 2024 and 2025 to carry forward. If Polygon (POL) can sustain the bullish momentum driven by increased layer-2 adoption and major network improvements, it’s likely to see further price appreciation.
The steady upward trajectory from $5.38 in 2025 to $8.07 in 2026 represents around a 50% increase, which is in line with historical growth seen in strong market phases.
The 2025 high would act as a support level, with the minimum price stabilizing around $5.00.
Polygon (POL) price prediction 2027
| Outlook | Max expected price | Projected ROI |
| Moderately bullish | $10.08 | 2624% |
2027 could potentially see a period of market consolidation. While the overall trend remains bullish, it’s reasonable to expect a slight dip or stagnation in price growth after a strong bull market in the previous years.
The max price of $10.08 represents a relatively modest 25% increase from 2026, suggesting that the market may experience some hesitation or a slowdown in buying momentum.
However, the minimum price of $6.25 indicates a strong support zone, preventing a sharp drop.
Polygon (POL) price prediction 2028
| Outlook | Max expected price | Projected ROI |
| Bullish | $15.13 | 3988% |
2028 could see Polygon regaining its bullish pace after a period of mild consolidation. The maximum price of $15.13 suggests a more aggressive recovery, following a 50% rise from 2027.
This resurgence could be due to technological upgrades, mass adoption in both DeFi and NFTs and the increased use of layer-2 scaling solutions as Ethereum continues to face congestion.
The minimum price of $9.38 signals that the market may see corrections but won’t fall back to levels lower than in previous years, supported by ongoing developments in the ecosystem.
Polygon (POL) price prediction 2029
| Outlook | Max expected price | Projected ROI |
| Very bullish | $26.48 | 7058.11% |
By 2029, the price of Polygon (POL) is expected to skyrocket, with the maximum price reaching $26.48. This massive jump can be attributed to several key factors, including greater institutional interest, a maturing cryptocurrency market, and perhaps even a renewed global bull run leading up to 2030.
Polygon (POL) price prediction 2030
| Outlook | Max expected price | Projected ROI |
| Very bullish | $46.39 | 11543.24% |
By now, we should know how the POL price growth might show in 2025. Now, using 2025 low and 2025 high, we can extrapolate the path to 2030. And following the same growth trajectory places 2030 high at $46.39. This translates into a growth of 808.06% from the 2025 highs.
Do note that this is more of an approximated price prediction, and there might be several minimum and maximum price levels between 2025 and 2030. Considering POL’s price history, such aggressive growth might be possible.
POL fundamentals
Polygon ecosystem isn’t just an Ethereum-specific scaling solution anymore. Instead, it has a pretty widespread DeFi, NFT, and web3 presence — something we will touch upon later in this discussion.
Coming to the fundamentals, Polygon supports DApps and even allows web3 builders to set up specialized infrastructure with access to chains driven by ZK and Optimistic rollup technologies. Also, it allows Ethereum to experience multi-chain interoperability, combining the Plasma Framework and a novel hPoS or hybrid proof-of-stake consensus mechanism.
As an investor primarily interested in the POL tokens, here are the aspects to take note of:
The Polygon ecosystem continuously brings new developments into the mix to speed up building in web3. The zkEVM chain is the most recent feather in its cap.
Lately, Polygon has seen a surge in the number of real-world and blockchain-specific partnerships. Some of the most significant ones include Nike’s foray into the web3 space via Polygon, SHOWTIME’s Polygon association, and a partnership with NuBank — a financial organization backed by Warren Buffet.
And that’s just the tip of the iceberg regarding the giant strides Polygon has made in the crypto arena. Also, y00ts — one of Solana’s most prominent NFT collections — has finally migrated to the Polygon ecosystem — taking the credibility of the MATIC network to a new level.
Is the POL price prediction model accurate?
This POL price prediction model considers every aspect of Polygon’s journey as one of the more popular scaling solutions for the Ethereum blockchain. The Polygon network looks quite fundamentally robust. Also, the latest associations and partnerships make the Matic Network look even more desirable. To top it all off, we even discuss the short-term and long-term MATIC price analysis to make this price prediction model more accurate, relatable, and attainable.
Disclaimer: This article is for informational purposes only and does not constitute financial advice. The price predictions for Polygon (POL) are speculative and based on historical trends, technical analysis, and ecosystem developments.
Frequently asked questions
Can MATIC or POL reach $10?
What will POL be worth in 2025?
Is POL worth buying?
How much will POL cost in 2030?
What is the future of POL?
Disclaimer
In line with the Trust Project guidelines, the educational content on this website is offered in good faith and for general information purposes only. BeInCrypto prioritizes providing high-quality information, taking the time to research and create informative content for readers. While partners may reward the company with commissions for placements in articles, these commissions do not influence the unbiased, honest, and helpful content creation process. Any action taken by the reader based on this information is strictly at their own risk. Please note that our Terms and Conditions, Privacy Policy, and Disclaimers have been updated.