
In this Loopring price prediction, we will discuss the current state of this Ethereum-based protocol and the price potential of its native token, LRC. We will explore the technical analysis whilst throwing light on the fundamentals, tokenomics, and on-chain metrics.
NOTE: This article contains out of date figures and information. It will be updated with fresh analysis for 2025 and beyond in the New Year. In the meantime, please see our Loopring Price Prediction tool for the most recent, data-informed projections.
- Loopring price forecast and the role of fundamental analysis
- Loopring tokenomics and its future price action
- Loopring price prediction and other key metrics
- LRC price prediction and technical analysis
- Loopring (LRC) price prediction 2023
- Loopring (LRC) price prediction 2024
- Loopring (LRC) price prediction 2025
- Loopring (LRC) price prediction 2030
- Loopring (LRC’s) long-term price prediction (up to 2035)
- Is the Loopring price prediction model accurate?
- Frequently asked questions
Want to get LRC price prediction weekly? Join BeInCrypto Trading Community on Telegram: read LRC price prediction and technical analysis on the coin, ask and get answers to all your questions from PRO traders! Join now
Loopring price forecast and the role of fundamental analysis
Here are some of the functional traits that made Loopring initially popular:
- It is an Ethereum-specific protocol meant for building decentralized exchanges. And with DEXs and liquidity staking expected to grow more popular in 2023, Loopring might be able to make a comeback.
- Looprings, the ecosystem, plans to improve DEXs by eliminating the possible liquidity and efficiency-specific drawbacks.
- The protocol houses an innovative technology, Ring Matching, which helps participants execute trades simultaneously. Hence the name Loopring.
- Smart contracts are integral to this ecosystem. They work alongside the popular zkRollup technology for better privacy and security.
- LRC, the native token, is meant for paying trading fees and accessing platform-specific features
“loopring or zksync filled up to the gas limit would give us ~4000 TPS.”
Vitalik Buterin, Co-Founder of Ethereum: X
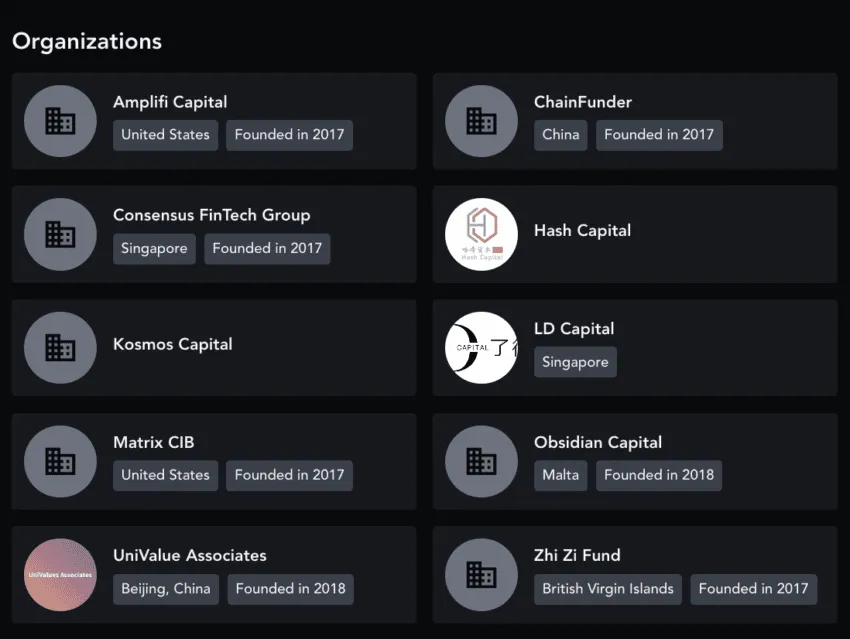
Both Amplifi Capital and Kosmos Capital have invested in the project.
The innovative technology that allows users to create DEXs, supported by zkSNARKS, has the potential to grow rapidly in popularity in the near future. This makes us optimistic about the future price forecast of Loopring.
Loopring tokenomics and its future price action
LRC is an ERC-20 token useful for pool staking. Also, people who consider building DEXs using Loopring as the platform can even consider staking LRC for safety and reputation. And yes, slashing penalties ensures that the exchange owners maintain their reputations.
Despite the price dip — all through 2022 — the token economics model of Loopring looks strong. Firstly, there is a supply cap of almost 1.37 billion. At present, 96.88% of the same comprises the circulating supply.
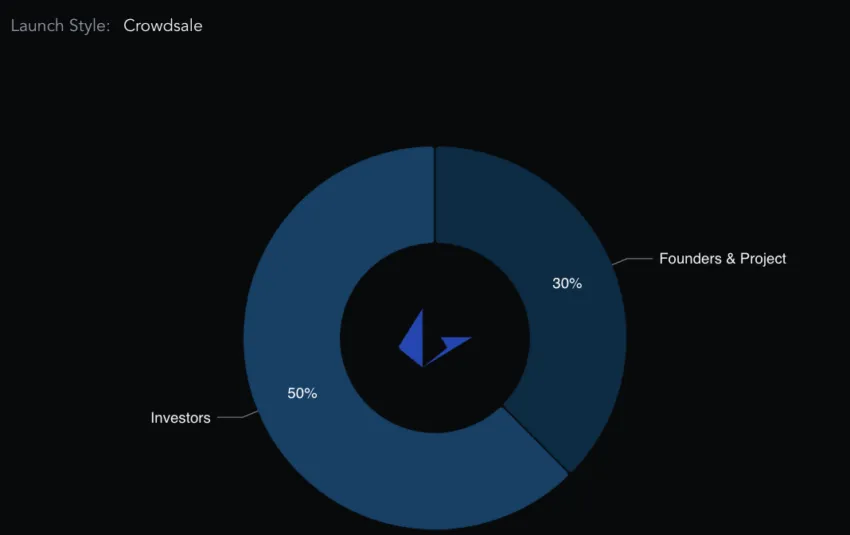
The initial supply schedule shows that 50% of the total supply went to the investors as part of the crowd sale. 30% went to the project, including the founders, with a 2-year vesting period. Another interesting this is the decreasing issuance courtesy of the programmatic burn mechanisms. This makes the circulating supply of LRC deflationary.
Moreover, users have the incentive to earn rewards by locking up their LRC tokens via smart contracts. They can go for short and even long-term contracts spanning 9 to 36 months.
Did you know? LRC, the native token of the Loopring ecoystem, plays a major role in impacting the protocols economic model and thew governance setup.
The tokenomics model looks compact and in line with investor sentiments. Plus, the decreasing issuance and locking incentives are also expected to help.
Loopring price prediction and other key metrics
Still planning to invest in LRC. Here is what the supply-held metric looks like regarding top addresses.
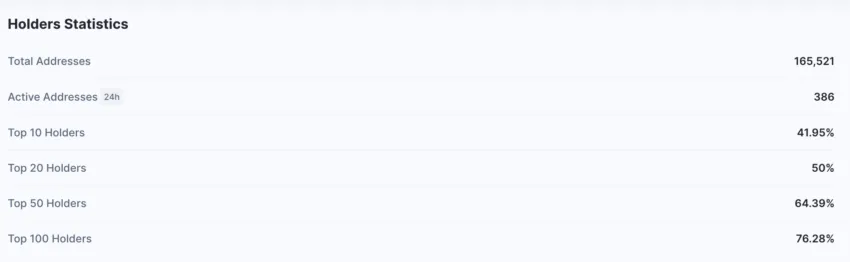
As of late December 2022, the LRC supply held by top addresses seems to be dipping. If you look at the holder statistics, the top 100 holders currently manage 76.28% of LRC’s circulating supply.
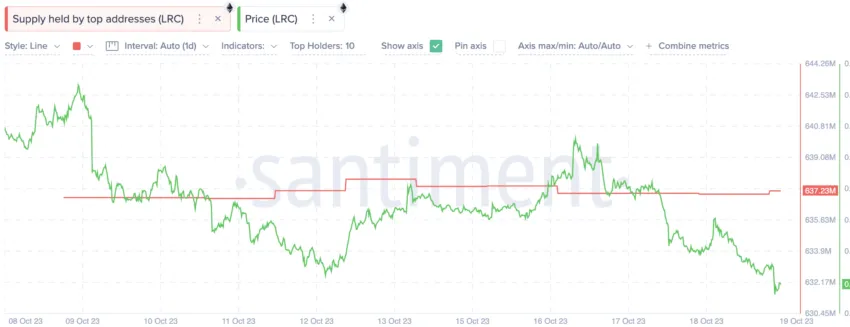
But there is another trend surfacing, as of December 2023. At present, most of the LRC enthusiasts are the HODLers, and not a lot of trading is going on. Plus, LRC whales control under 50% of the total supply.
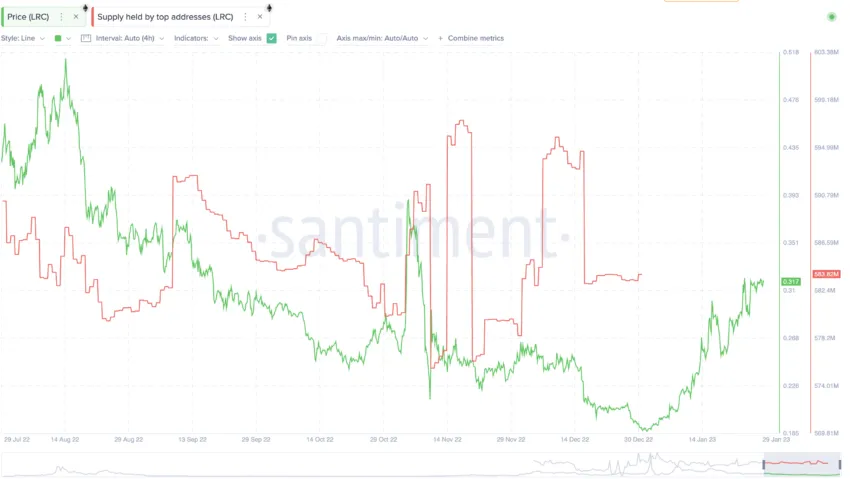
The chart suggests that every time top addresses start dumping LRC, there is a visible drop in prices. Do note that the chart above is from early 2023. The more recent chart shows that the top address supply has been virtually static — meaning that despite the lows, people aren’t dumping.
Therefore, you might need to keep an eye on the exchange inflows and massive LRC movements across addresses to gauge the corresponding Loopring price action.
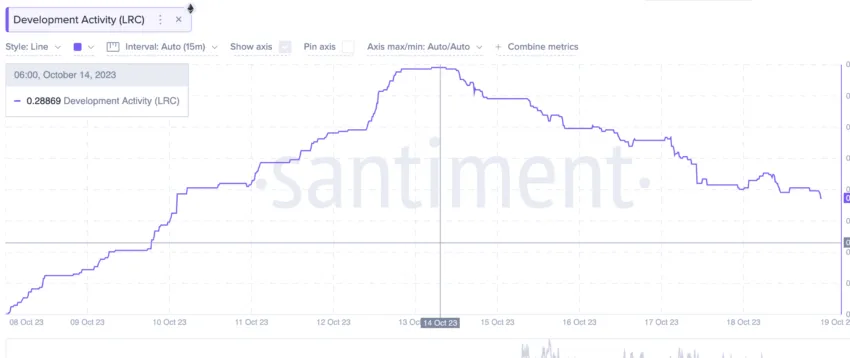
The development activity associated with Loopring seems to have dipped over the past few months. This explains why the prices haven’t been able to keep up consistently, despite the rally. LRC is still up 17.55% month-on-month as of December 20, 2023.
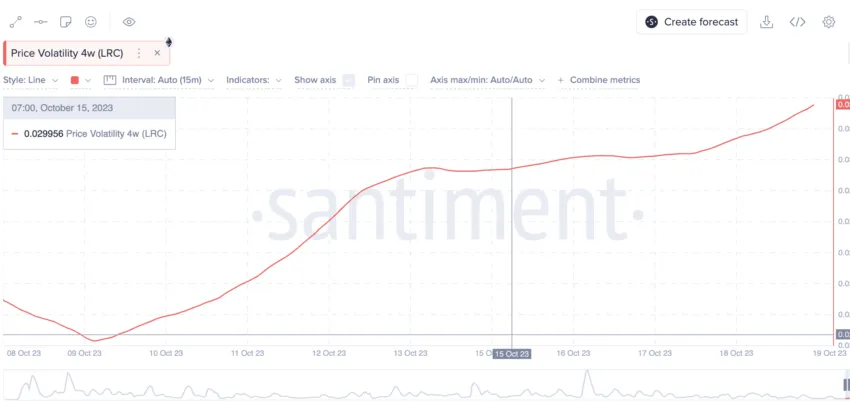
Coming to the price volatility, LRC has been experiencing quite a bit over the past month or so. The chart suggests that the price volatility is at its peak — hinting at a short-term consolidation at the counter.
Other price-related metrics
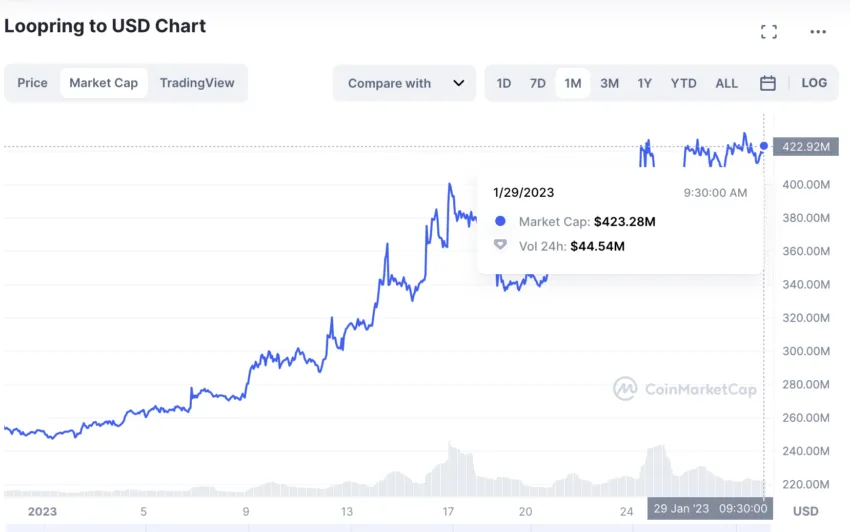
The increase in price volatility might be due to the drop in the overall trading volume, which, as of December 2023, is $25.17 million — lower than the $114.28 million registered on January 2023. Fewer trading acts often signify an increase in volatility. The chart above shows that the market cap seems to be steadily increasing.

However, the latest price chart shows that the LRC price is slowly trying to get back on its feet, making higher highs.
LRC price prediction and technical analysis
Our early 2023 analysis
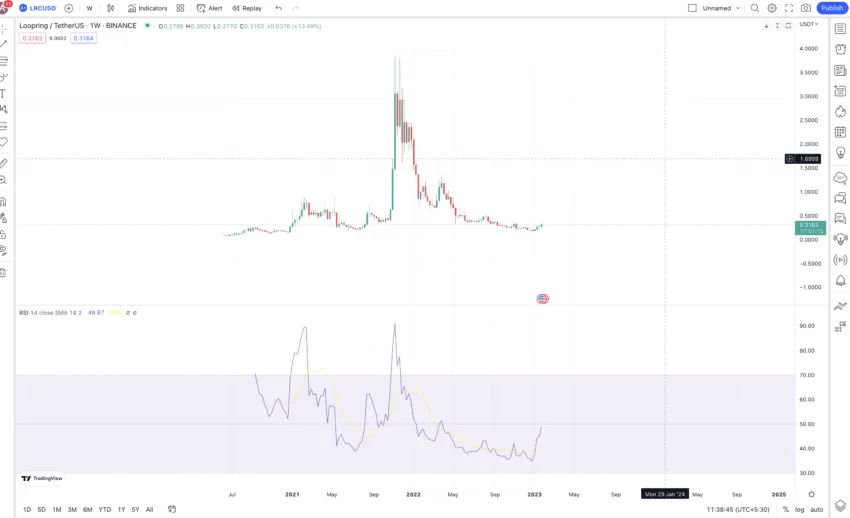
It’s time to shift our attention to technical analysis. Here is a quick weekly trading chart and the momentum indicator to help you ascertain the broader trend.
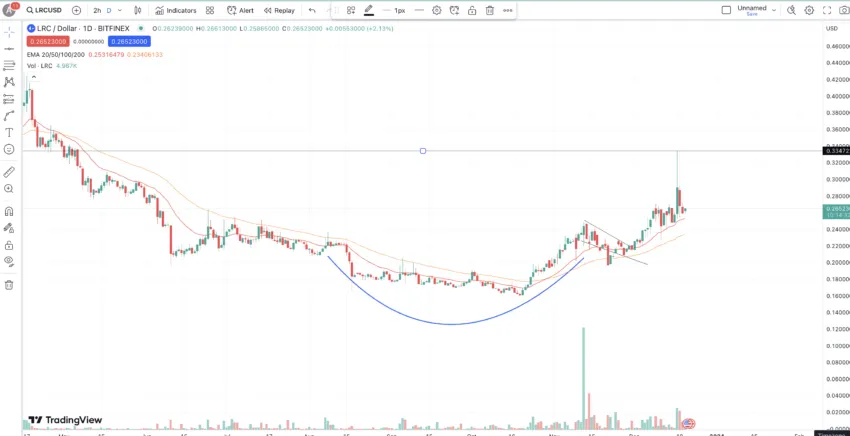
Our December 2023 analysis
As of December 2023, LRC seems to have broken out of a Cup-and-Handle pattern. However, for the prices to go higher, especially towards the 2024 price prediction levels, LRC first needs to breach the important resistance level of $0.334. A drop under the 20-EMA and 50-EMA support lines can invalidate the bullish trend.
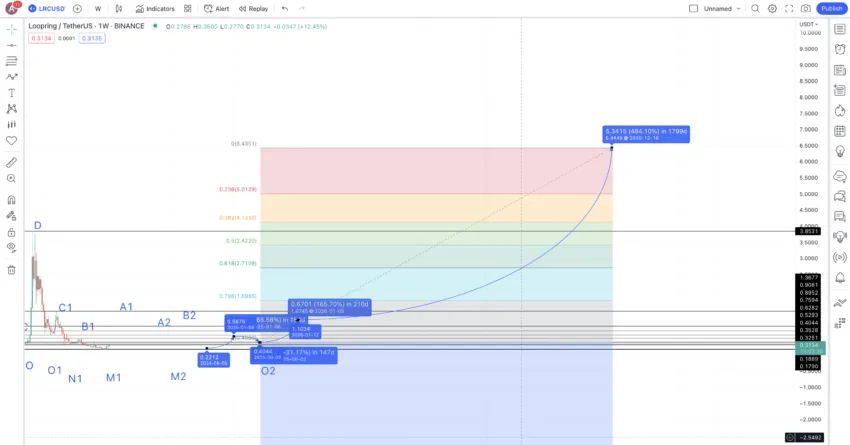
Now let us use the weekly chart and look at the broader patterns.
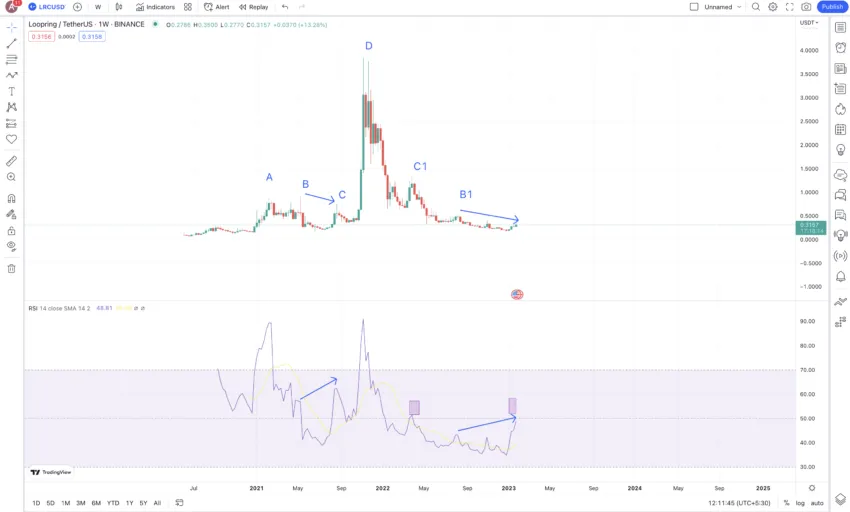
Pattern identification
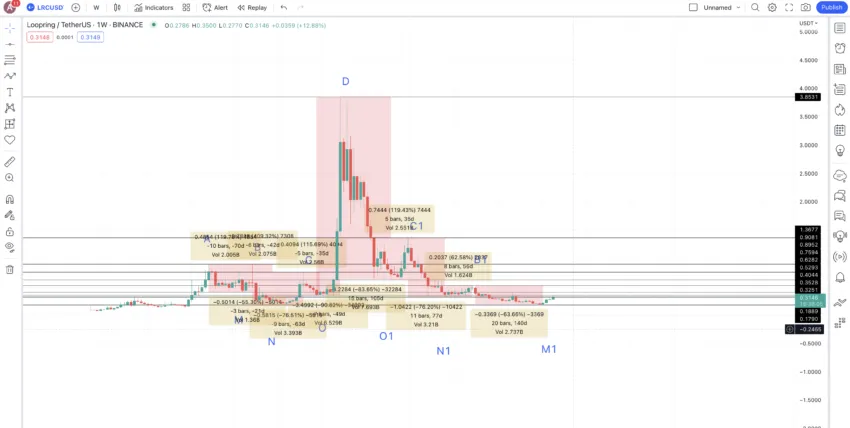
On the left: LRC started trading, only to make a series of highs (no defined order) before peaking at $3.83 — its all-time high. Meanwhile, on the right, LRC started dipping from its peak, tracing the path similar to the left side of the chart but as a mirror image.
As crypto price moves take cues from historical data, the highs on the chart’s left side should be symmetrical with the ones on the right. Here are all the levels marked on the chart:
There are a few important details to notice from the chart above:
- LRC peaked after reaching C. The bullish RSI divergence while the price was between B and C is visible. Therefore, a similar bullish divergence is being formed post-B1.
- Even though the bullish divergence from B1 is visible, it is less steep than during the B to C movement. Hence, we can expect a significant price rise but not something as drastic as C to D.
- If the current RSI level (marked by a block) can move above the previous RSI level (coinciding with level C and marked by a block), we can expect a more sizable upmove at LRC’s counter. Currently, the RSI is at 49, and 52 will hopefully be the level to beat for a massive price rise.
Now let us even mark the lows and take the price changes for two paths: D to A and D to M1. We can use these to locate the next set of highs and lows for LRC.
Price changes
Our task is to find the next high or A1 from B1. Therefore, we need to locate the price changes from D to A and then from D to M1 to locate the next high and the next lows.
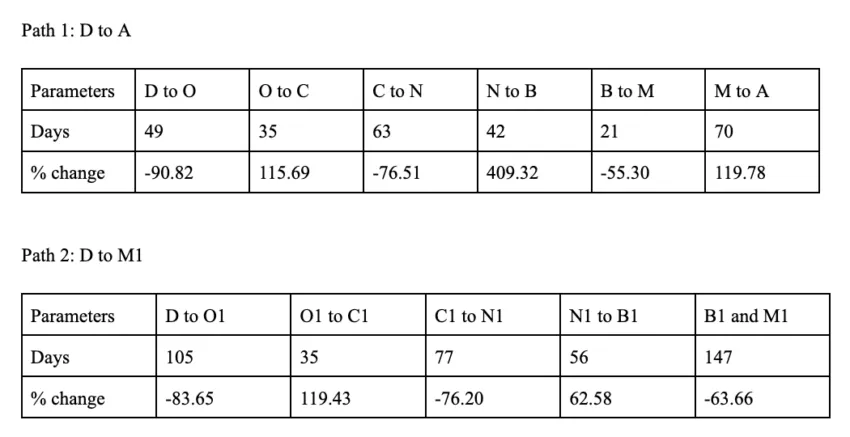
The sum of the column values with negative figures will give us the high-to-low average percentage change and days. Similarly, the sum of column values with non-negative figures will give us the low-to-high average and days.
The low-to-high average is 165.36% and 48 days. The minimum price change keeping the expectations in check is 62.58% — per table 2.
The high-to-low average is -74.35% and 77 days. The minimum percentage drop during bullish phases can go as low as 55.30% per table 1. And the max distance can be 147 days, per table 2.
We can use the average datasets to locate the next set of points.
Loopring (LRC) price prediction 2023
We predicted a high of 49 cents for LRC by April and it had the legs to go as high as $0.459, despite a choppy market. Here is how we approach the price prediction for 2023.
Our last point of reference is M1. So, from M1 — the obvious low — we can use the average price hike discussed above to plot the next high or A1.
Using the low-to-high average of 165.36%, we can plot the next point for the Loopring price prediction for 2030 at $0.4901. The time taken can go as high as 70 days instead of the average of 48 days as the crypto market conditions are still broadly bearish.
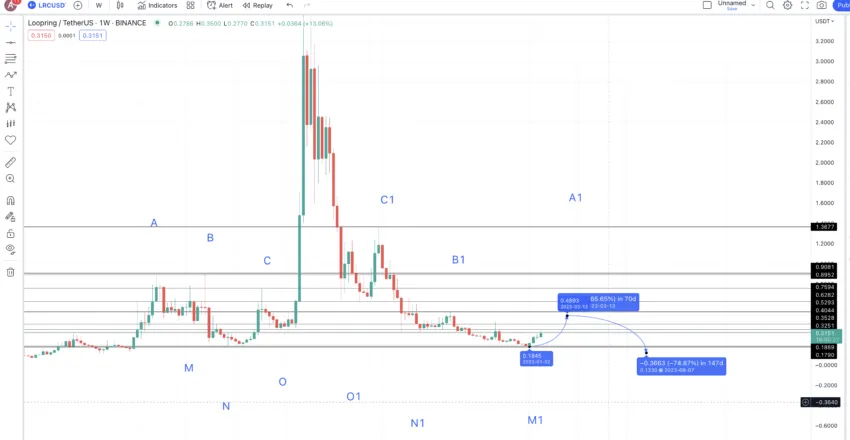
The minimum price in 2023 can be the previous low or M1, which already surfaced at $0.1889. However, if the broader market condition continues, we can expect a drop from A1 to surface at $0.1230. This level might not be impossible if the likes of BTC and ETH head toward newer lows. And while that doesn’t seem likely yet, we can never count out the unexpectedness.
However, for the possible drop, our minimum LRC price forecast for 2023 would still be $0.1889.
Loopring (LRC) price prediction 2024
Outlook: Bullish
From the last low or the projected low of $0.1230, we can expect the next high to surface at A2 or at a hike of 165.36%. The time taken can vary, but we expect the same to surface in 2023 itself. This level, or $0.3285, coincides with the current price level of 2023. This shows that the average price of LRC in 2023 might be close to current price levels.
However, if we mark this point as A2, we can expect the next low to surface at a minimum drop of 55.30%. But it is safe to assume that the low here might take support at the previously reached level of $0.1889 — the low LRC touched in early 2023. We can expect this Loopring price prediction low for 2024 to surface early on.
Path to 2024
From this level or M2, we can expect LRC to move higher towards B2. As per the growth curve in 2021 and even in 2022, we can expect the 2024 price level to hit the average of 165.36%, at least. This puts the high for 2024 at $0.4893 — the same as that of 2023 — by early 2024.
However, with B2 reaching the same level as A2 (approximately), we can expect the next drop to be lower than before. Therefore, if we take the minimum drop percentage of 55.30%, the next low or N2 could be at $0.2212.
Projected ROI from the current level: 84%
Loopring (LRC) price prediction 2025
Outlook: Bullish
The next high, in 2025, could therefore be at $0.5876, using the low-to-high average percentage hike of 165.36%. The drop from C2 or rather O2 can take support at $0.4044 — a level coinciding with the low M from the chart. This could be the lowest price of LRC in 2025.
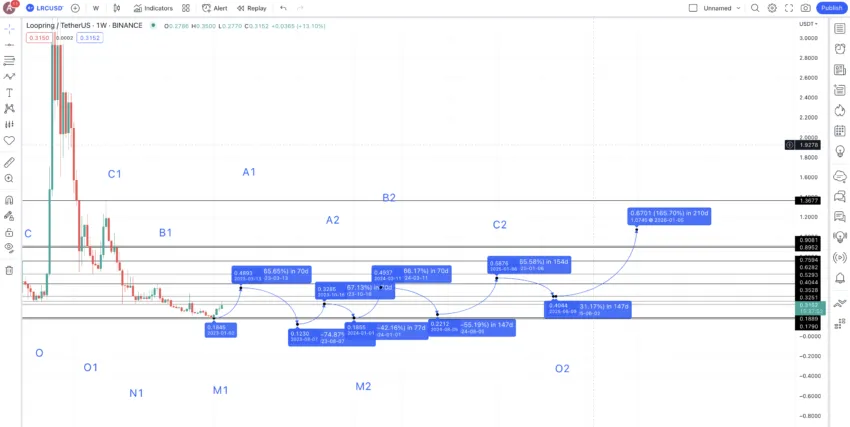
Note that the price of LRC might not drop as much in 2025 as C2 being higher than B2 can kickstart a strong uptrend.
Projected ROI from the current level: 120%
Loopring (LRC) price prediction 2030
Outlook: Bullish
From O2 or the low in 2025, we can expect the high to surface at $1.0745, preferably in 2026. If we connect the high in 2026 and the low in 2035, we can expect the fib levels 2030 to go as high as $6.43 by the end of 2030.
Remember, these price levels can change if Loopring undergoes a massively bearish or bullish move anytime between 2026 and 2030. Also, to go as high as $6.43, the price of LRC must breach the previous high of $3.83 by early 2030 or late 2029.
Projected ROI from the current level: 2316%
Loopring (LRC’s) long-term price prediction (up to 2035)
Outlook: Bullish
You can easily convert your LRC to USD here
Now that we have the short-term and long-term price projections for Loopring (LRC), we can use the same calculations to trace the Loopring price forecast until 2035. Here is a table for your reference:
| Year | | Maximum price of LRC | | Minimum price of LRC |
| 2023 | $0.4901 | $0.1230 |
| 2024 | $0.4893 | $0.1889 |
| 2025 | $0.5876 | $0.4044 |
| 2026 | $1.0745 | $0.8151 |
| 2027 | $1.611 | $1.256 |
| 2028 | $2.82 | $2.20 |
| 2029 | $4.22 | $3.29 |
| 2030 | $6.43 | $3.83 |
| 2031 | $9.645 | $5.98 |
| 2032 | $11.57 | $9.02 |
| 2033 | $12.73 | $9.92 |
| 2034 | $22.27 | $13.80 |
| 2035 | $33.42 | $20.72 |
Is the Loopring price prediction model accurate?
This Loopring price prediction model considers several aspects. While we arrive at the precise price points using technical analysis, the fundamentals and tokenomics help with investor sentiment mapping. Plus, the price prediction also uses on-chain metrics and relevant historical data to show how prices respond to trends.
Frequently asked questions
How much will Loopring be worth in 2025?
What is Loopring all-time high?
Is Loopring a good coin to invest in?
Who owns the Loopring coin?
Disclaimer
In line with the Trust Project guidelines, the educational content on this website is offered in good faith and for general information purposes only. BeInCrypto prioritizes providing high-quality information, taking the time to research and create informative content for readers. While partners may reward the company with commissions for placements in articles, these commissions do not influence the unbiased, honest, and helpful content creation process. Any action taken by the reader based on this information is strictly at their own risk. Please note that our Terms and Conditions, Privacy Policy, and Disclaimers have been updated.