

Stepping into the crypto universe can be both exciting and a bit intimidating, especially for those new to the space. Being well-informed is key to making smart choices and keeping pace with rapid market changes. So, how do you sidestep common mistakes and make savvy investment decisions? This guide is here to give you the insights and tools needed to make your journey through the crypto world a successful one. Here’s how to use on-chain analysis and fundamentals to gain crucial insight into the decentralized asset landscape.
How to look beyond price
Investing in cryptocurrencies is not as simple as buying something because its price increases. Relying solely on appearance or just one analysis method can lead to failure. What’s needed is a holistic approach that integrates fundamental analysis and on-chain analysis. Utilizing on-chain analytics and combining it with a thorough understanding of an asset and important news can equip you to judge momentum and opportunities.
What’s fundamental analysis?
To form a complete picture of an asset, fundamental analysis is crucial. While the term fundamental analysis is often used in various ways, the main idea is that it aims to look at the core aspects of a project and evaluate its potential.
Fundamental analysis requires careful consideration of things like tokenomics and diligent evaluation of opportunities. Understanding the balance between hype and quality can provide the insights needed to make a confident decision. While following the hype can sometimes be lucrative, it’s a path rife with scams and failed projects. A key thing to learn when you’re investing in a new asset is to evaluate the fundamentals carefully. Some of the elements you should analyze include:
- The team
- The technology
- The use-case
- The competition
- Developer activity
- Community Activity
To give a practical example, you should determine the quality of the team behind the project you’re looking at. In some cases, there might not even be any developer information available, which should make you think carefully about your approach.
Another important thing to review is the technical merit of the project. Review the documentation and the technical papers. In case this becomes too technical, diving into analysis and reviews of the projects can be helpful.
The key here is that you want to understand whether or not the project has strong fundamentals and whether or not it has growth potential.
How to use on-chain analysis
When analyzing a project, and the fundamentals look promising, the next step is to assess whether the project has any traction and whether now would be a good time to invest. On-chain analytics is a great tool for you to judge this.
On-chain analysis consists of using public data from the blockchain to create insights. This can relate to data like transactions, holder information, the number of addresses, etc.
There are many indicators available that help you to analyze on-chain data more effectively. We will look at some of the key ones below.
In/Out of the Money
The In & Out of the Money indicator is a valuable indicator for understanding the profit & loss profile of holders. In the image below, you can see an example of this indicator. The bubbles represent addresses that bought an asset in a certain price range. The bigger the bubbles are, the more volume was bought in that price range.
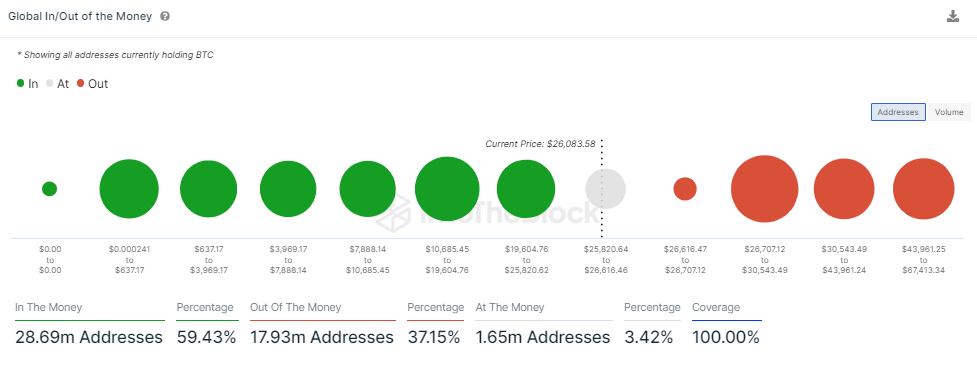
In the short term, these bubbles can act as support or resistance. For example, an individual losing money might decide to sell and cover their losses as the price moves toward their profitability area.
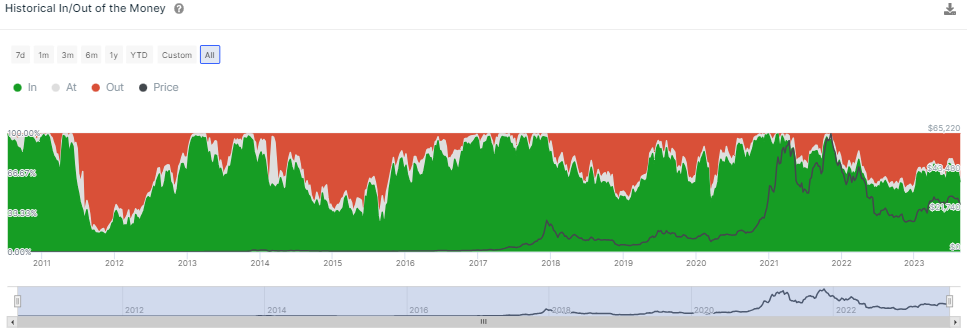
In the longer term, you can take a look at the historic In/Out of The Money information. Here, you see what percentage of addresses were at a loss or profit in the past. If you see that the current level of holders in profit is very high compared to past levels, it might not be the best moment to acquire this asset.
NVT Ratio
When you’re trying to find the right moment to acquire a specific asset, the Network Value to Transaction (NVT) Ratio can be a valuable indicator to use. This indicator compares the value of the network to the value of transactions on the network. Historically, this indicator can help determine lows and highs for assets.
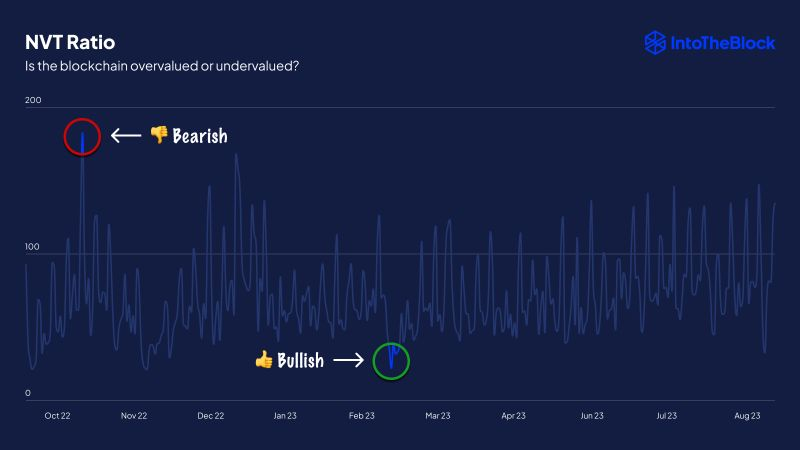
The way to use it is quite simple. The NVT ratio helps estimate whether a blockchain is overvalued or undervalued. When NVT is low, it means that there is a lot of value being transacted compared to the value of the network. This is a bullish sign. Likewise, a very high NVT ratio can be bearish because it shows that there is relatively little value being transacted on the network compared to the value of the network.
You can use this data to find local bottoms, which will help you buy at the right price, and local tops, which will help you sell at a profit.
Active addresses & new addresses
Next, you can take a look at the active addresses and new addresses. If a project is growing and gaining users, this should be reflected in this chart. New users coming in will show up — and that is a good sign. If the number of active addresses is consistently high or growing, it can also indicate that the network is being used or growing.
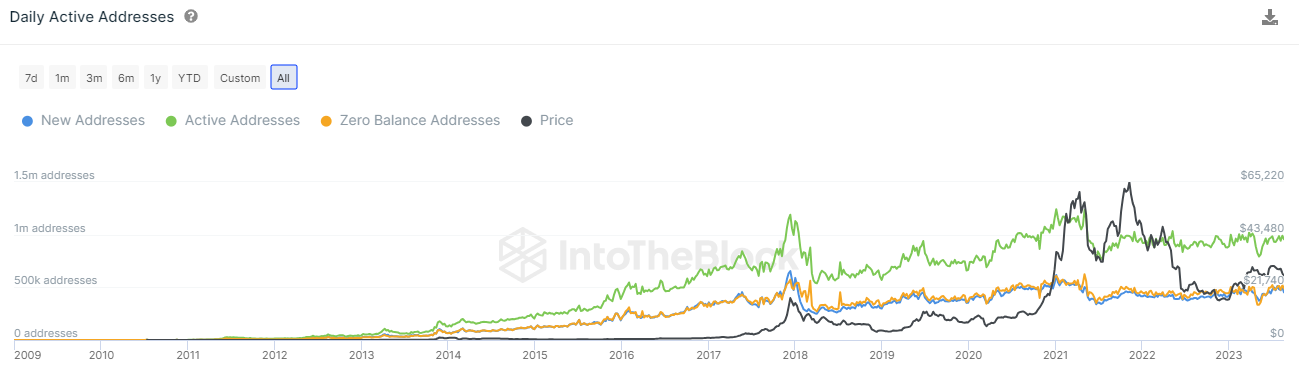
Another valuable indicator for this is the active addresses ratio. This indicator shows you what percentage of the total addresses is active. When the active addresses ratio increases, it shows that a larger part of the total addresses is actively using the network, which is a positive sign. Likewise, a decrease can be cause for concern.
Transaction count & volume
Similarly, as with active addresses, transaction counts, and volume can help you understand how active a network is. In the image below, you can see the transaction count for bitcoin. Generally, we can say that when this figure is increasing, it is positive as it indicates that the asset is being used more.

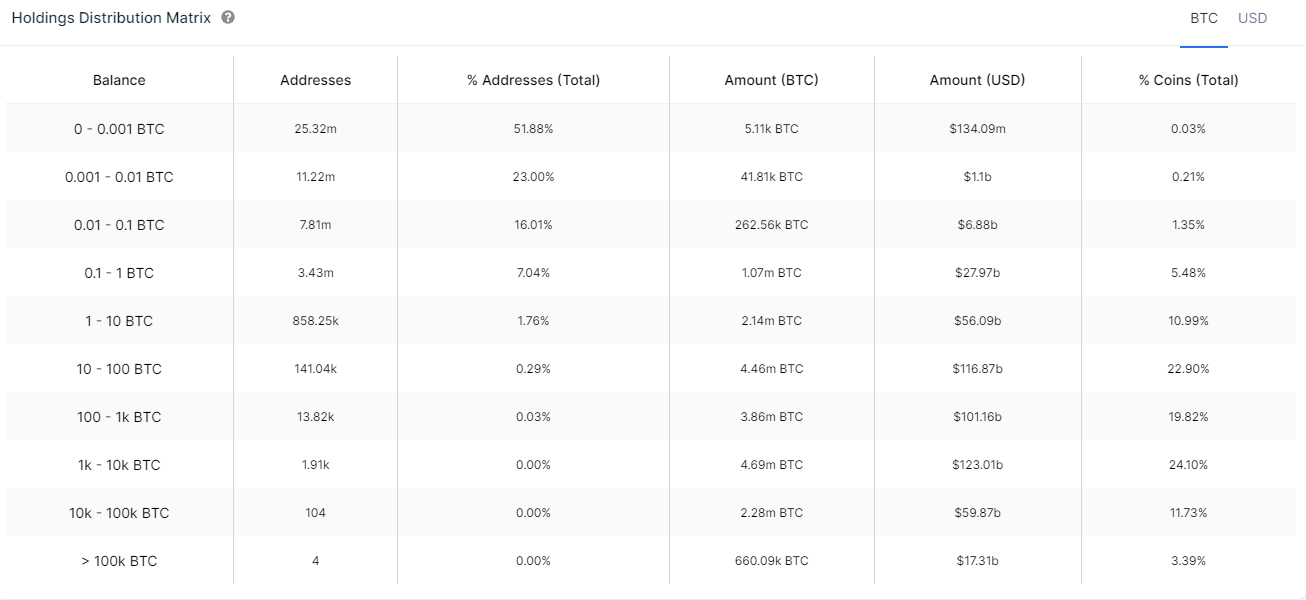
Holder composition
Finally, it is always good to consider holder composition. Essentially, you want to assess whether large-scale holders hold a big part of the supply and what these individuals or entities are doing with those assets. While accumulation by whales can be a good sign, if just a few big holders hold most of the assets, retail investors are at the whim of these bigger investors. In the image below, you can see the holder composition matrix for bitcoin, which shows how many addresses hold what percentage of supply.
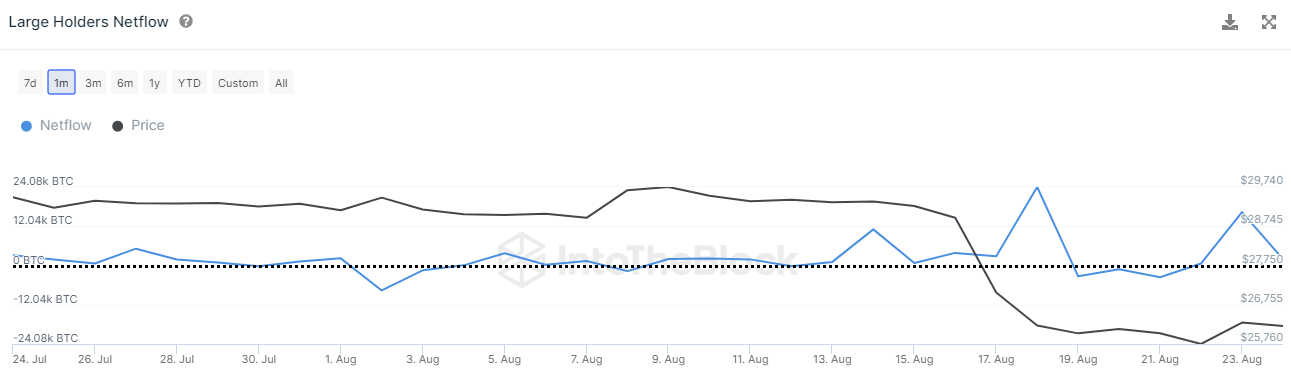
The chart below shows the large holder netflow indicator. If this indicator spikes upwards, it signifies that large holders are buying. Such spikes are generally a bullish sign, especially when we see multiple spikes in a row.
Comparing cryptocurrencies
Since there are so many different cryptocurrencies, even within specific market segments, going through them all and comparing the on-chain data can be very challenging. Nonetheless, it’s important to do this.
For example, if you think the layer-2 ecosystem is promising, you might want to compare the activity between different layer-2 networks to assess which one has the highest potential. There are tools to help you do this, like Perspectives by IntoTheBlock, which is shown below.

Ethereum L2 Perspective
In this example, you can see how we can quickly compare the number of transactions between Ethereum layer-2s. By using the knowledge shared in this article and diving into these specific comparisons, it becomes infinitely easier to get the insights you need to make the right decisions.
On-chain analysis is a vital tool
Navigating the crypto landscape can be pretty challenging. It requires a well-orchestrated blend of analytical methods, awareness of market trends, and a comprehensive understanding of individual projects. With a comprehensive approach that encompasses diverse analyses, vigilance against scams, strategic planning, and on-chain analysis, you can navigate the market with confidence.
Frequently asked questions
What are tokenomics?
How do I evaluate developer activity?
What is on-chain analysis?
What is NVT ratio?
About the author

Vincent Maliepaard is the marketing director at IntoTheBlock, a leading on-chain analytics provider. He leverages his extensive background in the cryptocurrency and technology industries to generate valuable insights, focusing on the application of blockchain technology, AI, and data analytics.
Disclaimer
In line with the Trust Project guidelines, the educational content on this website is offered in good faith and for general information purposes only. BeInCrypto prioritizes providing high-quality information, taking the time to research and create informative content for readers. While partners may reward the company with commissions for placements in articles, these commissions do not influence the unbiased, honest, and helpful content creation process. Any action taken by the reader based on this information is strictly at their own risk. Please note that our Terms and Conditions, Privacy Policy, and Disclaimers have been updated.