


Like any other high-beta space, the crypto market moves on sentiment. While fundamentals and technicals matter, emotional triggers — fear-driven sell-offs and greed-fueled rallies — often dictate price swings. That’s where the crypto fear and greed index comes in. This tool quantifies market emotions, helping traders navigate volatility. So, what can it tell us about the market? More importantly, how can traders use it to stay ahead in 2026?
KEY TAKEAWAYS
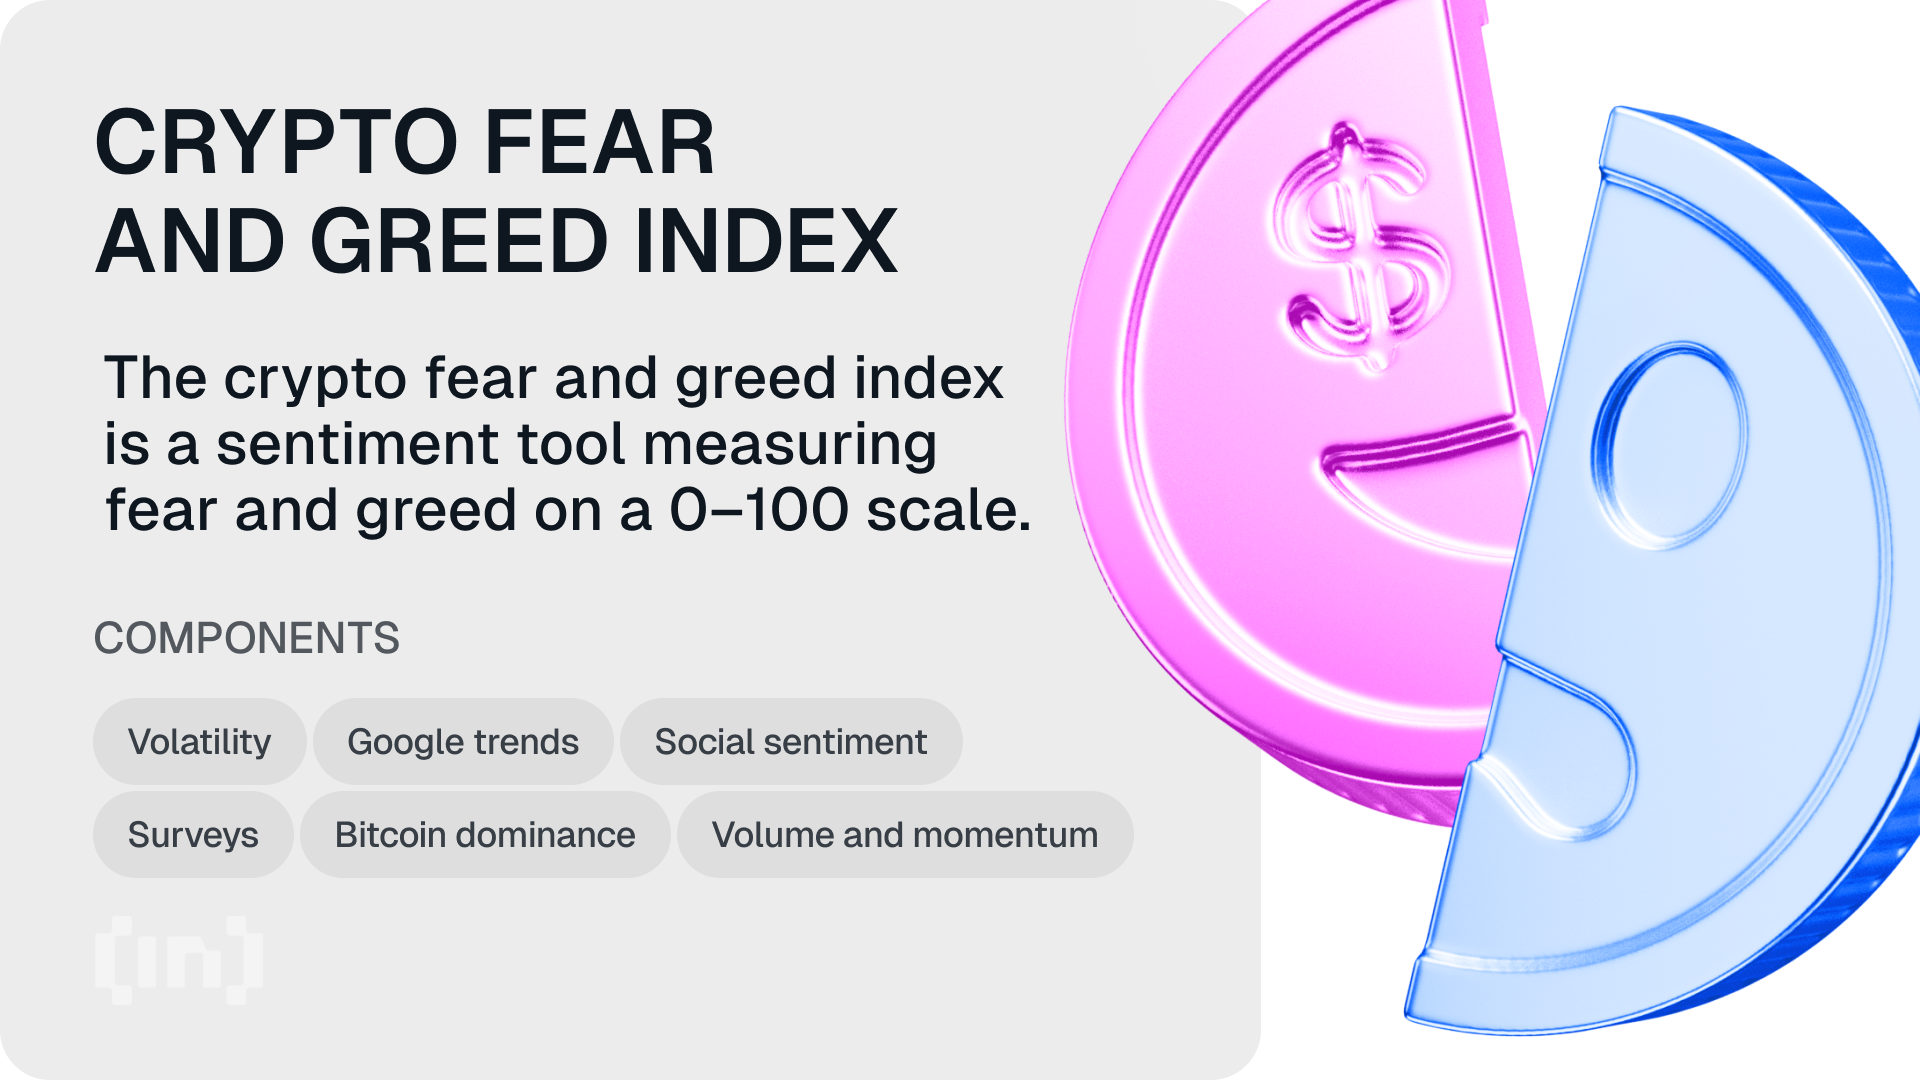
► The crypto fear and greed index is a sentiment-based indicator that gauges emotions in the market and uses several factors like volatility, volume, and social media activity.
► This index complements other signals by focusing on market sentiment rather than asset performance, helping traders understand potential shifts in emotional momentum.
► While useful for short-term analysis, the index has limitations, especially during neutral or sideways markets and does not replace the need for fundamental and technical analysis.
► Traders can use the index as a guide to assess buy and sell zones, though it should be combined with additional on-chain and charting tools for more reliable decision-making.
- What is the crypto fear and greed index?
- Why do we need another index?
- How is the crypto fear and greed index calculated?
- How current market conditions influence the index?
- Pros and cons of the fear and greed index
- How do traders use the crypto fear and greed index?
- Is the fear and greed index reliable?
- Pair the index with other trading indicators
- Frequently asked questions
What is the crypto fear and greed index?
The crypto fear and greed index is among the many popular sentiment indicators. It is often used to analyze market participants’ thoughts, feelings, and responses — those with digital proclivities.
Simply put, the index aggregates crypto-specific emotions; fear during downturns and greed during rallies — on a daily basis, compiling data from multiple sources to present a single number between 0 and 100. A low score (0–24) signals Extreme Fear, often associated with panic selling and risk aversion, while a high score (75–100) reflects Extreme Greed, suggesting potential market bubbles or overbuying behavior.
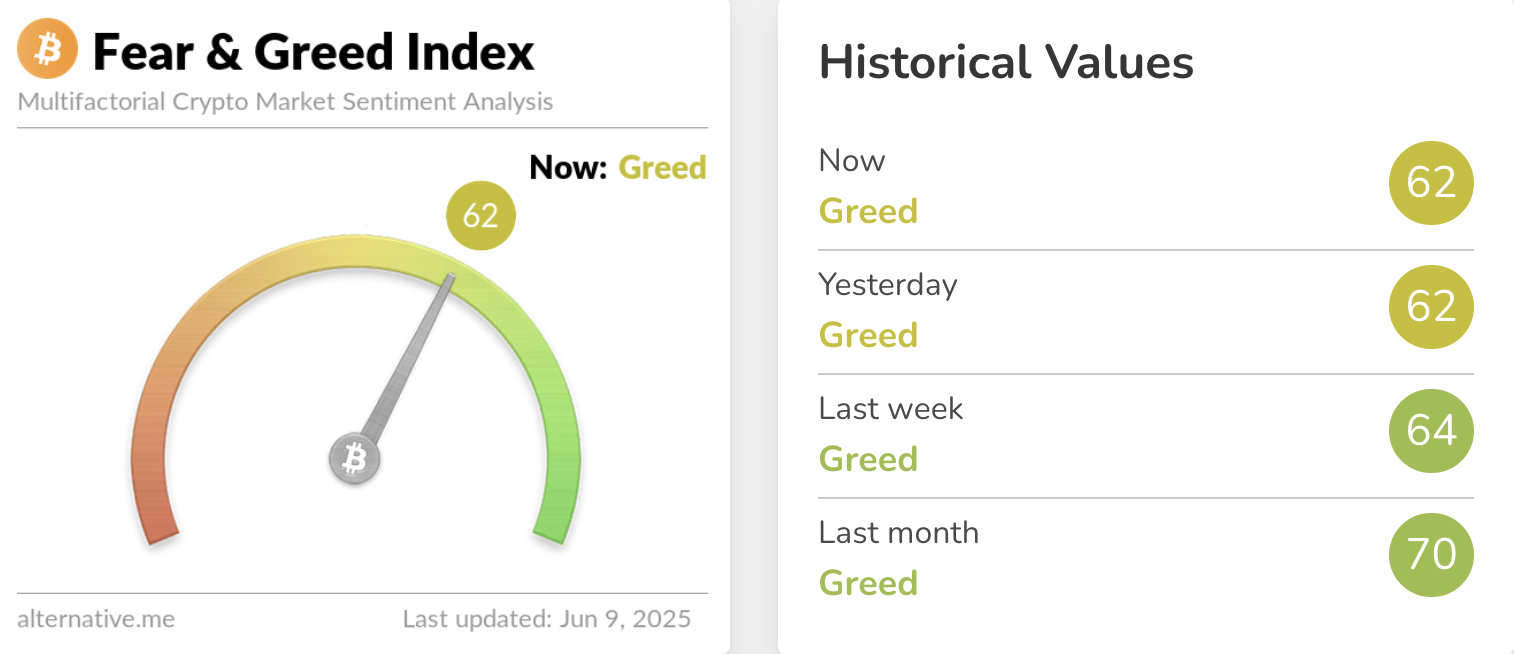
As of June 5, 2025, the index stands at 57, indicating a state of Greed. Bitcoin is currently trading around $104,850, reflecting a recovery from previous lows. Recent ETF outflows totaling $1.21 billion over three days suggest cautious investor sentiment amid market consolidation.
Other sentiment-driven indicators, like WhaleAlert and Augmento’s Bull & Bear Index, exist.
Why do we need another index?
Wait, don’t we already have enough crypto indices — the NASDAQ crypto index (NCI), the NYXBT (New York Stock Exchange Bitcoin Index), and the S&P Bitcoin Index (SPBTC)?
As resourceful as these indexes are, their primary job is to track asset performance. None of these indexes takes user emotions and broader market sentiments into account. So, there is a glaring gap.
The crypto fear and greed index is meant to fill this gap — taking several data points into account and combining them as a standalone statistical entity. Just to be clear — the index isn’t a financial instrument but a sentiment-analyzing market indicator— meant to complement your investment-focused analysis.
The history
Ironically, the fear and greed index was developed with traditional financial products in mind. CNN Money developed the index in 2012 to serve as a multi-factored measure of market sentiments — for the stock market, to be precise.
Alternative.me later tailored the index for the crypto ecosystem as a generic crypto sentiment index. This index analyzes several market indicators and returns a daily value of 0 to 100. While 0 is extreme for fear (market participants are wary of the conditions), 100 is extreme for greed (showcasing widespread participation/buying and building FOMO).
The elements
Even though the index underpins two specific emotions — fear and greed — the transition from one side of the spectrum to the other concerns multiple elements.
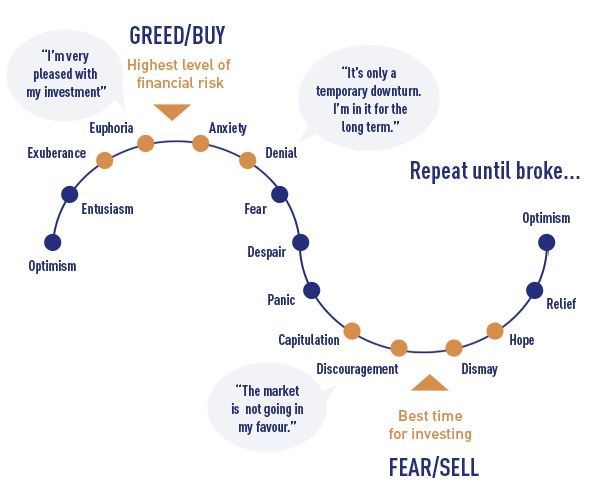
At 100, participants are most optimistic and on a buying speed. The index drops with profit booking, and the optimism starts moving into the “anxiety” territory. Anxiety is followed by denial when the participants shrug off any dip as a minor correction.
With dipping prices come panic and discouragement, with the fear and greed index moving closer to the sub-40 territory. Participants perceive subsequent index drops as buying opportunities, pushing the emotional bandwagon into the hope and optimism territory.
It is interesting to find that you encounter optimism at the extremes of the crypto fear and greed index. Here is a detailed diagram showcasing the emotional ride from 100 to 0.
How is the crypto fear and greed index calculated?

The fear and greed index takes several market indicators into consideration, crunches data according to the predetermined weightage, and condenses everything to come up with a number between 0 and 100. Here are the sub-index indicators in play along with the weights:
1. Volatility
Market volatility is a key indicator. It has a weightage of 25% in the fear and greed index. This indicator looks at the maximum spend (for Bitcoin and other large cryptocurrencies) and the current market volatility relative to the monthly and quarterly volatility averages. High volatility means more fear but might also lead to trader enthusiasm.
2. Market momentum
Also called the crypto fear and greed index volume indicator, market momentum has a 25% weightage. Regarding the calculation, the index factors in the current trading (buying) volumes are compared with the monthly and quarterly averages. High current volumes hint at an overly greedy space.
3. Social media
It is only appropriate to have a social media indicator as part of the index, primarily to gauge coin-specific chatter across social platforms (for example, the BeInCrypto Trading Community on Telegram, where traders and experts share their opinions about crypto). This indicator has a 15% weightage and is calculated using hashtags and social responses.
In early June 2025, crypto-related social sentiment is cautiously optimistic. Twitter engagement for $BTC hashtags is up 36% week-over-week, according to LunarCrush data. However, sentiment remains more analytical than euphoric, with dominant keywords shifting from “crash” and “panic” in March to “accumulation,” “buy zone,” and “sideways action.” Reddit and Telegram groups show increasing debates around ETF behavior, suggesting that traders are more focused on positioning than reacting emotionally.
4. Dominance
With a weightage of 10%, dominance is easily one of the trickiest and most effective sub-index indicators. Here is how it works in relation to the fear-greed narrative:
Growing Bitcoin dominance means lesser greed for other altcoins. Therefore, if the dominance of cryptocurrency is seen growing, the market will start moving towards the fearful zone. Similarly, a drop in Bitcoin dominance hints at growing greed.
On June 5, 2025, Bitcoin’s dominance surged to 63.8% — its highest level since early 2021. This marks a clear risk-off pivot, with capital flowing out of altcoins and into Bitcoin as a perceived safe haven. The shift reflects investor caution amid macroeconomic uncertainty and sustained ETF volatility.
Due to the market dominance of Bitcoin, the Bitcoin fear and greed index is often used interchangeably with the crypto fear and greed Index.
5. Trends
The fear and greed index pulls search queries from Google to determine the coin-specific search volume — primarily Bitcoin. The change in search volumes helps measure the change in the index values. This indicator also has a 10% weightage.
Per Google Trends data, dated early June 2025, the search interest in “Bitcoin” remains relatively flat despite its strong price action. This suggests lower retail participation than in past bull runs.
6. Surveys (Paused for now)
Currently paused, surveys had a 15% weightage when it came to their role in helping populate the fear and greed index. When active, surveys usually comprise crypto polls with a standard sample size of 2,000 to 3,000 individuals.
If reinstated, surveys could provide deeper insights into whether traders see the early June 2025 surge as a temporary push or the start of a prolonged bull market.
And that’s how the fear and greed index takes shape. The value is updated daily, depending on how the sub-index indicators change.
How current market conditions influence the index?
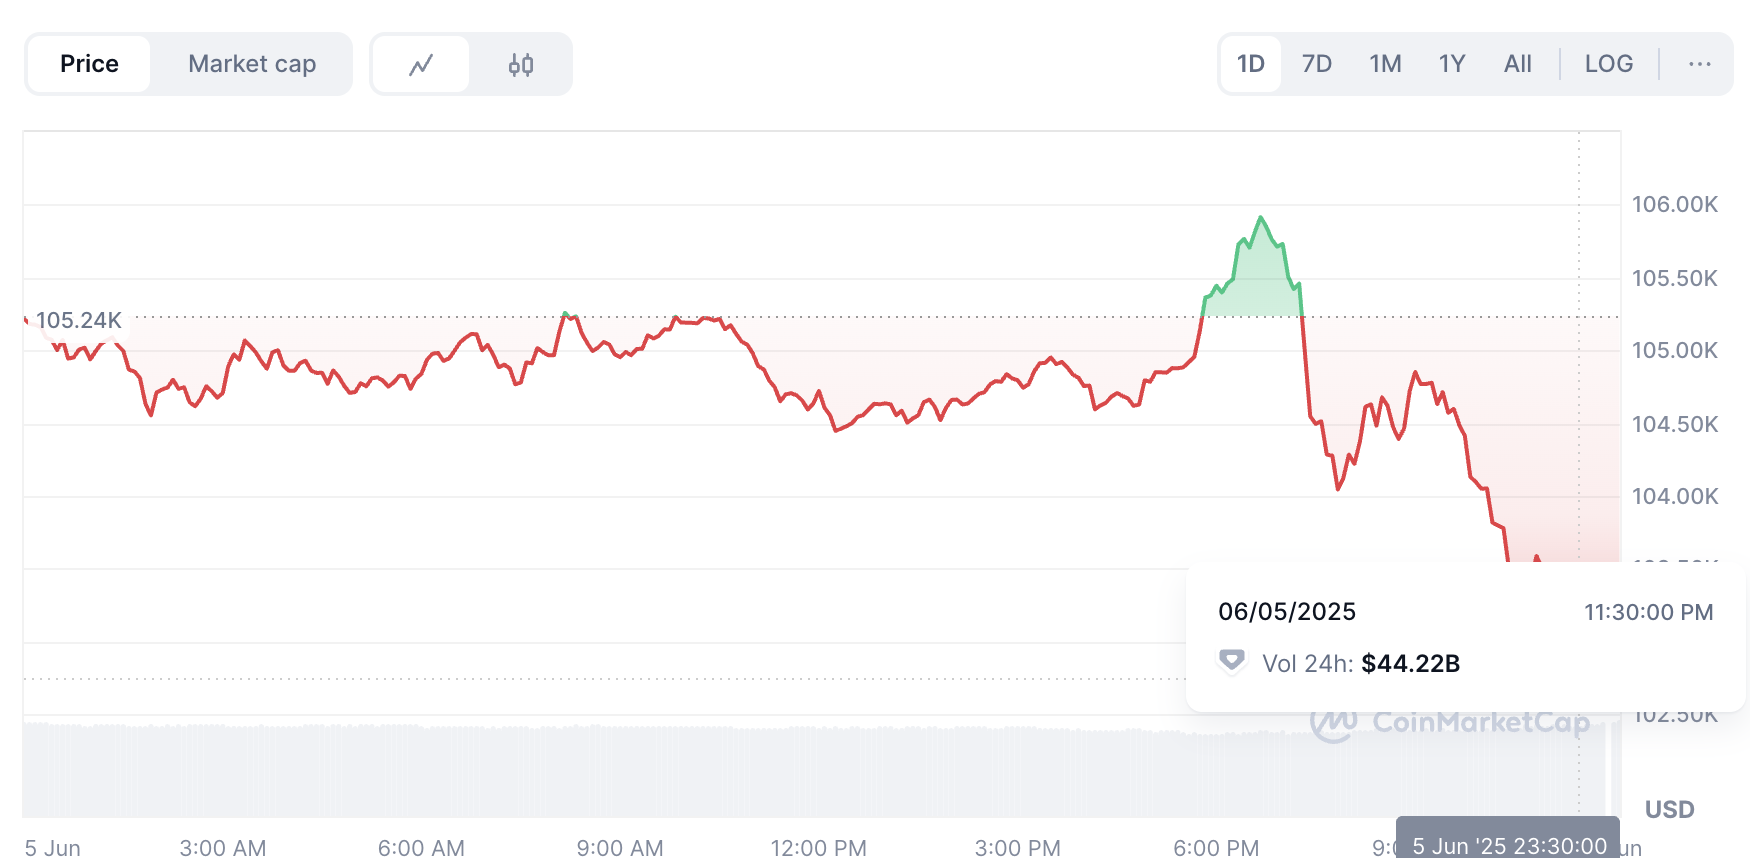
On June 5, 2025, the Fear and Greed Index sat at 57 — firmly in the Greed zone. While this signals growing confidence, the sentiment is not euphoric. Bitcoin is consolidating just above $104,800 after briefly hitting $112,000 in late May.
The biggest tension lies in the divergence between price and flows: between May 29 and June 2, over $1.2 billion exited Bitcoin ETFs, including $616 million in a single day — the highest since February. Institutional hesitation remains visible, even as Bitcoin price action holds steady.
On the macro front, ADP’s June 5 report shows only 37,000 U.S. private-sector jobs were added in May — the weakest number in two years. That rekindled fears of a softening labor market and potential U.S. recession. Yet, retail investors appear unfazed. Google Trends shows Bitcoin-related searches remain tepid, but on-chain data reveals a 7% increase in active BTC addresses since June 1, 2025.
Together, these factors form a cautious recovery mood. There’s no panic — but there’s also no mania. The Index reflects that ambivalence, hovering in a Greed state while risk signals quietly bubble underneath.
Pros and cons of the fear and greed index
Every index generates a certain amount of signal and noise, and has strengths and weaknesses depending on the context. The fear and greed index is no different. If you are planning to rely on it, then you should remain aware of its benefits and weaknesses.
| Pros | Cons |
|---|---|
| Gives a broader view of the market | Projects a short-term analysis |
| Slow to change | Doesn’t offer much support when neutral |
| Saves traders time | Still requires technical/fundamental indicators |
| Presents a fair picture in bullish/bearish phases | Skewed heavily towards volatility and volume |
| Saves research time | Can change even when the price doesn’t move |
Benefits of using a fear and greed index
By now, you should know how the fear and greed index is put together. Here are some of the advantages of using the index:
- Helps present a broader view of an otherwise volatile market.
- It doesn’t change overnight; instead, it moves slowly in a particular direction.
- Comes forth as a relative index that changes (drops or surges) as per the relative price levels
- It helps traders save valuable market research time by covering volatility, dominance, volume, and other important data sources.
- It gives clear information about the market extremes — like when the assets are available at a discount and when they are entering the bubble territory.
- Presents a fairer picture of the crypto market during a bull run and a bearish phase.
- It can be used to make aggressive investment decisions, similar to short-selling Bitcoin or any other crypto asset.
- It helps sketch out the riskiest phases using market sentiment without directly giving any financial advice.
Criticisms of the fear and greed index
As we saw, the crypto fear and greed index has its advantages. Yet, it’s far from perfect and has been known to attract the following criticisms:
- Projects the short-term sentiment analysis and hardly helps with the bigger picture.
- Skewed heavily toward two erratic indicators: volatility and volume.
- It doesn’t offer much trading support when the index is near the neutral 50 level, or the price action is sideways.
- It still needs technical and fundamental indicators to present a clearer picture.
- It doesn’t take whale activity, exchange inflow, and trade intensity into account.
- It can change significantly even when the price doesn’t move much.
How do traders use the crypto fear and greed index?
Despite the numerous advantages and a handful of shortcomings, the crypto fear and greed index is a reliable trading tool. Here is how the traders use it to gain a competitive edge in an otherwise volatile market:
Dividing the index scale into four quadrants
You can divide the index into four different zones:
- Extreme fear or the Orange zone (0–24)
- Fearful or the Amber/Yellow zone (25–49)
- Greed or the Light Green zone (50–74)
- Extreme Greed or the Green zone (75–100)
Zone 1 projects extreme fear. It also offers the best buying opportunity and might also mean that a price reversal is near. Zone 2 is the fearful zone. This happens at the onset of a bear market when the prices start dropping sharply. These levels can quickly go up in a bull market, but in a deep bear market, the fearful zone often means more correction.
No one knows where the bottom will be. Therefore, it isn’t prudent to start buying blindly when the index is in Zone 1. Instead, we should look for multiple moves into Zone 2 to clearly indicate when to buy.
Prices start improving in Zone 3. Furthermore, the volatility is the least in this zone. You can also see an increase in buying volume, hinting at some bullishness. Zone 4 is when the market is the most overbought. This quadrant is a breeding ground for price reversals/corrections.
Is the fear and greed index reliable?

Before talking about how reliable the fear and greed index is, here are a few things we should keep in mind:
- Even a low Zone 1 fear and greed index value in a bear market doesn’t mean a bottom. It can just be growing panic and volatility.
- In a bear market, Zone 3 or the light green zone can also trigger a sell-off.
- This index doesn’t best depict sideways trading.
- Sentiments can be overblown during a bull run or during a crypto winter.
While extreme fear levels can indicate oversold conditions, history has shown that prolonged macroeconomic instability — such as recession fears — can keep markets suppressed longer than expected.
Overall verdict:Yes, the fear and greed index is reliable to a certain extent. This is especially true when using it with technical and fundamental indicators. It is also good for tracking sentiments and investment decisions in the short term. However, we would not recommend using it for long-term analysis.
Pair the index with other trading indicators
Overall, the crypto fear and greed index is a good tool for forecasting the overall market sentiment. However, it isn’t smart to focus your entire plan on this tool alone.
The perfect combination would be to look at the broader buy/sell zones, gauge market sentiments using the fear and greed index, and eventually use the on-chain and on-chart tools to fine-tune the entries/exists.


