
The entire crypto ecosystem is a cosmos of possibilities. But what about the interoperable blockchain project, Cosmos? This detailed Cosmos price prediction model focuses on fundamentals, tokenomics, on-chain metrics, and technical analysis to trace the potential of ATOM in the short and long-term.
- The future price of Cosmos and the role of fundamentals
- Cosmos tokenomics and future price expectations
- ATOM price prediction and on-chain metrics
- Cosmos price prediction and technical analysis
- Cosmos (ATOM) price prediction 2023
- Cosmos (ATOM) price prediction 2024
- Cosmos (ATOM) price prediction 2025
- Cosmos (ATOM) price prediction 2030
- Cosmos (ATOM’s) long-term price prediction until the year 2035
- Is the Cosmos price prediction practical and accurate?
- Frequently asked questions
Want to get ATOM price prediction weekly? Join BeInCrypto Trading Community on Telegram: read ATOM price prediction and technical analysis on the coin, ask and get answers to all your questions from PRO traders! Join now
The future price of Cosmos and the role of fundamentals
The Cosmos blockchain aims to develop a scalable ecosystem for developers. The Cosmos blockchain can host several DApps and even help develop full-fledged blockchain projects. It is termed the “Internet of Blockchains” for the same reasons.

Cosmos boasts a novel IBC (Inter-Blockchain Communication) protocol. This allows different blockchain ecosystems and setups to transfer data and digital assets among each other. At the center of the Cosmos ecosystem is the Cosmos Hub which acts as the governance layer. The native ATOM coin is an integral part of the Cosmos Hub and facilitates seamless governance, supporting staking and acting as the transaction fees.
Here are some of the insights that make Cosmos extremely popular among blockchain enthusiasts:
- The Cosmos Hub works as the heart of the Cosmos ecosystem, donning the hat of a custodian, marketplace, and security provider.
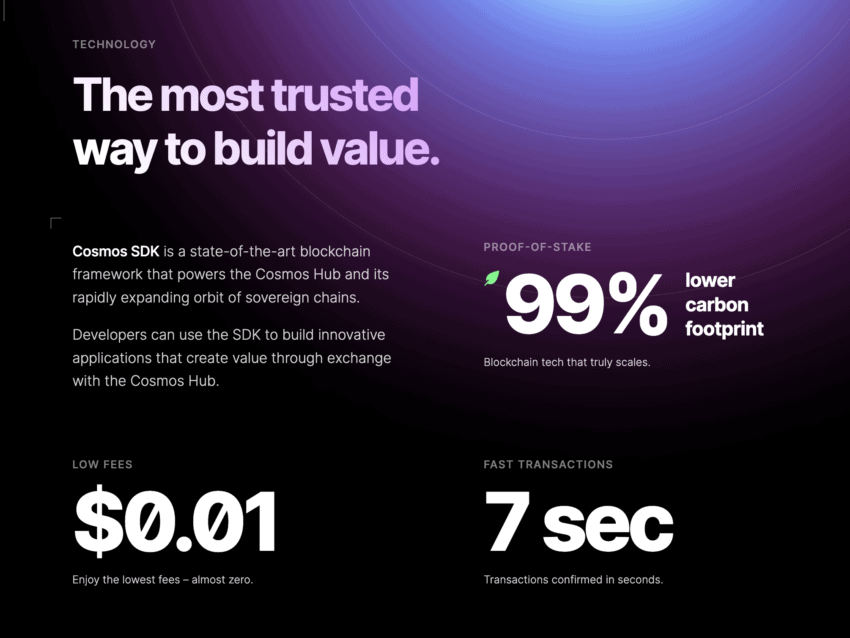
- The Cosmos SDK is popular among DApp builders, helping create diverse and powerful interconnected systems.
- The ecosystem is 99% more carbon-efficient, boasts fast transactions, and promises affordable transaction fees.
Cosmos tokenomics and future price expectations
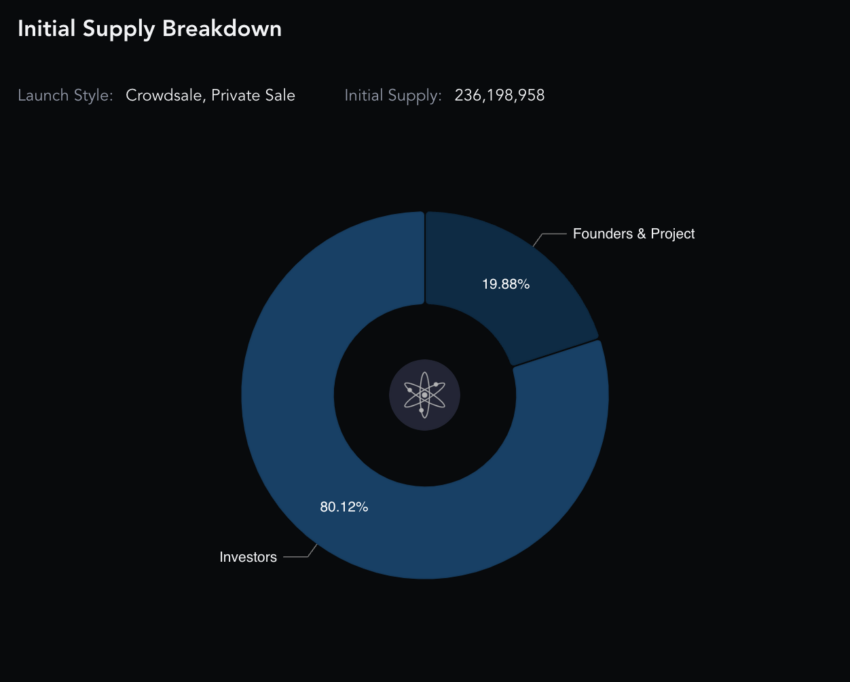
The coin distribution system for Cosmos started in 2017. Over 80% went to the investors on release, whereas nearly 20% went to the project and the founders. Interestingly, the overall supply is inflationary. But there’s a twist. The rate of inflation varies between 7% and 20%. This means if more Cosmos is staked, the inflation hits the 7% mark, whereas if the staking percentage is less than ⅔ of the circulating supply, the inflation ceiling moves up to 20%.
Did you know? Zaki Manian, Co-Founder of Sommelier — a Decentralized Asset Management Protocol — proposed an inflation reduction parameter for Cosmos, which could push the ceiling down to 10%.
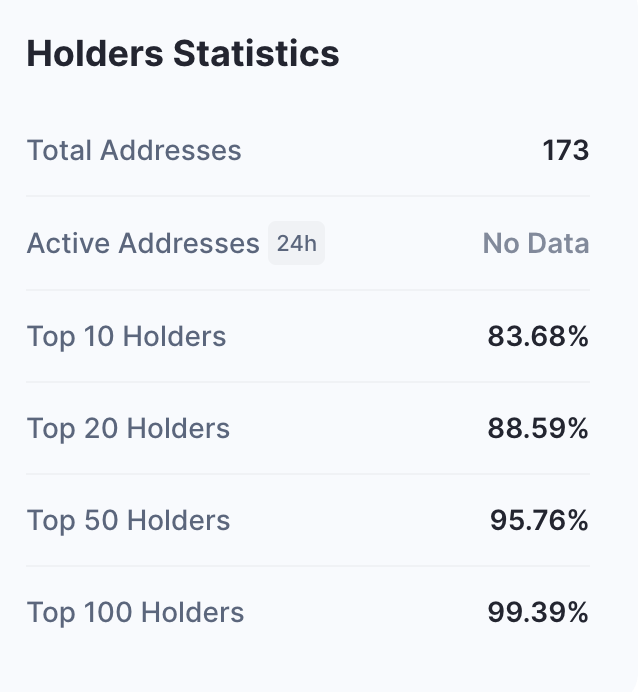
Hence, market participants have the incentive to stake more ATOM coins. As of early 2023, the top 100 ATOM holders managed 99.39% of the supply, making the coin prone to market-wide sell-offs. This explains the 2023 low of $6.26.
ATOM price prediction and on-chain metrics
The development activity/price action chart reveals something interesting. Every time the development activity peaks, the price is positively impacted. The development activity grew significantly (as of early February 2023), followed by a price rise.
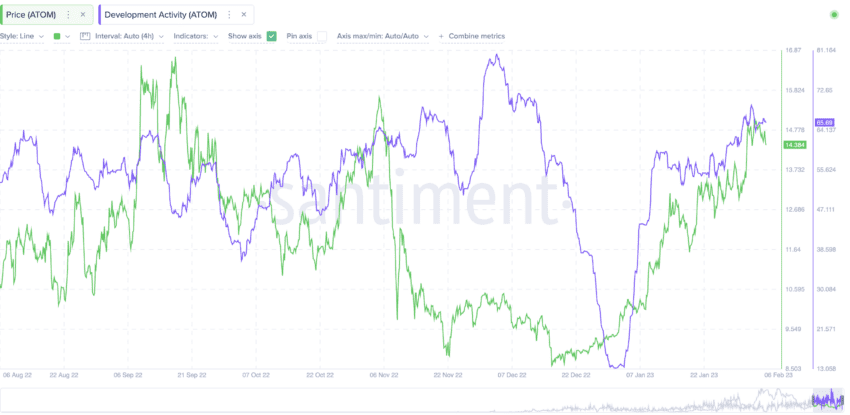
As of December 2023, the development activity is slowly peaking with the prices sitting above the development line. This could be an optimistic sign for the price of ATOM.
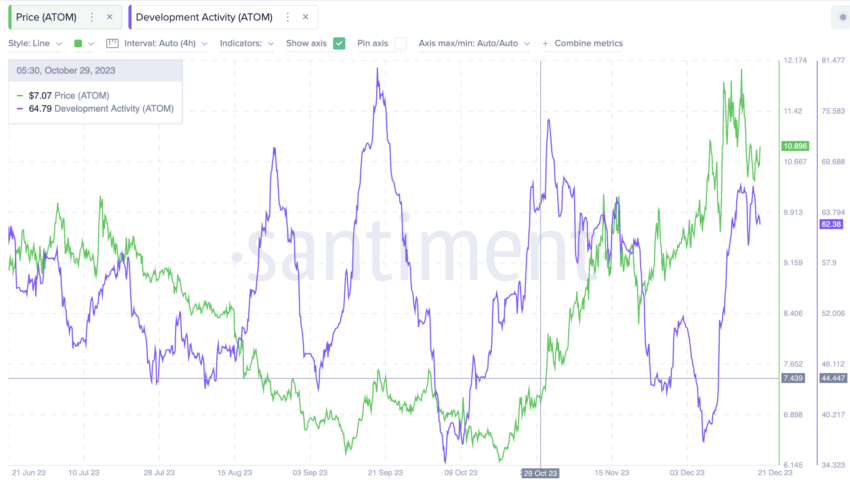
A deeper look into the development activity, courtesy of the Cosmos SDK:
For traders and investors, though, looking at the price of ATOM in relation to the volatility makes sense. The four-week volatility chart in January 2023 suggested that every time the volatility of ATOM hits a low level for a given swing, the prices start moving up from there.
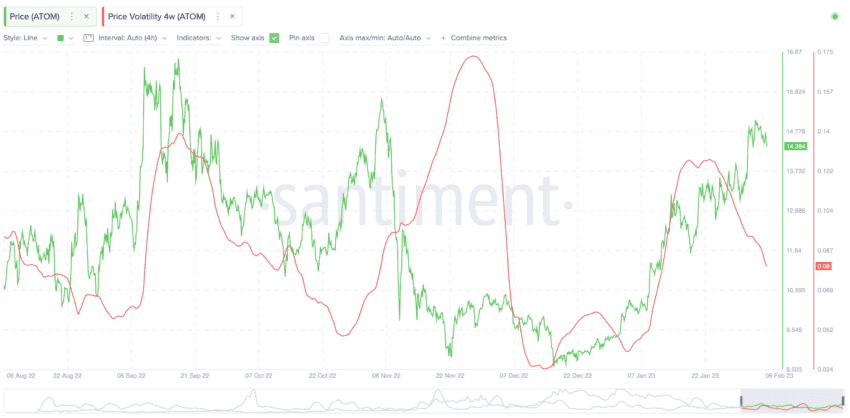
You can see that the orange line (volatility) is moving down, and a bigger drop might move the existing price action to the optimistic territory.
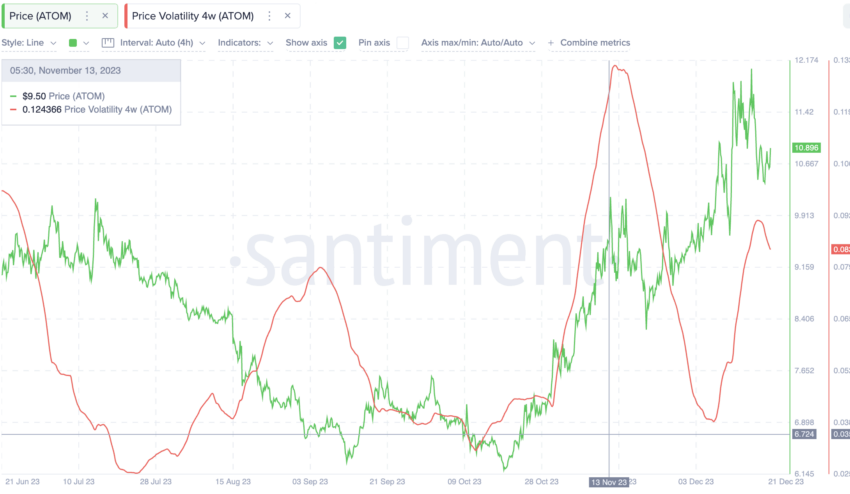
As of December 2023, volatility seems to be making a lower high, which, like earlier, could drive a positive price action for ATOM. We shall look at price-specific insights while pulling out the trading charts.
“PoS Bitcoin on Cosmos will dominate as the currency of choice for the next millennium of commerce on this planet earth.”
Jae Kwon, Co-Founder of Cosmos: X
Cosmos price prediction and technical analysis
Here are a few pointers about the current and historical price of the ATOM coin that might nudge us in the right direction regarding the Cosmos price prediction. Remember, these pointers were from early 2023.
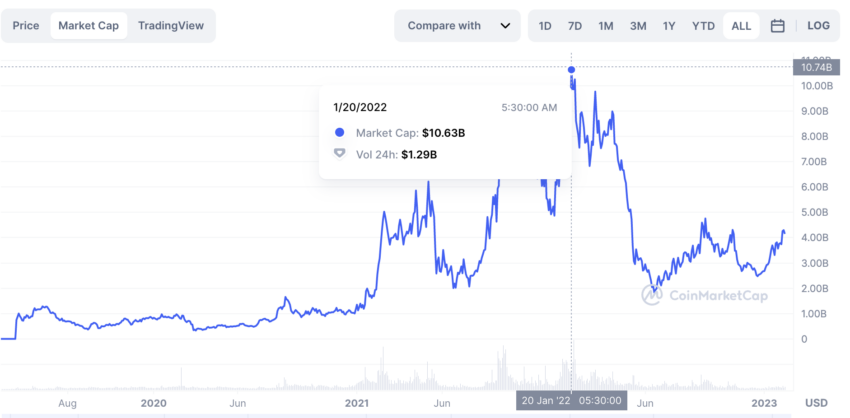
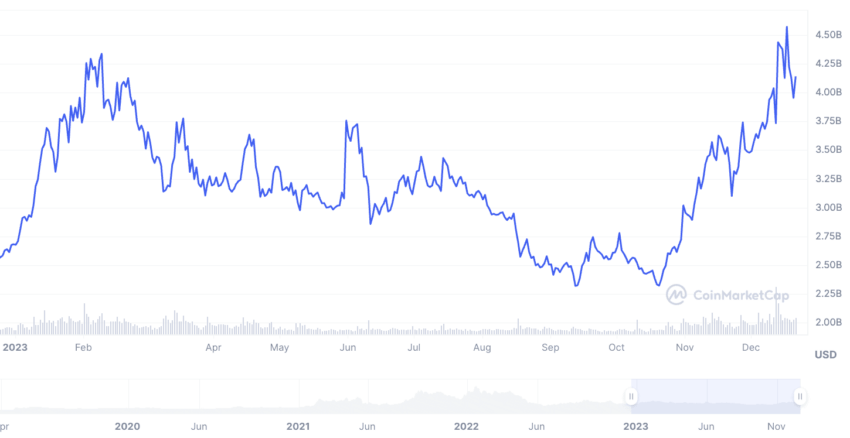
- The market cap of Cosmos peaked on Jan. 20, 2022, reaching $10.63 billion in the process. The trading volume during that time also did exceptionally well, clocking $1.29 billion.
- Despite the broader crypto market correction throughout 2022, Cosmos managed to make some recovery as opposed to other cryptos. On Sept. 17, 2023, a lower high was formed in terms of market cap. Cosmos (ATOM) clocked $4.7 billion in market cap, whereas the trading volume clocked $588.83 million — just a 50% drop off the peak trading volume.
- The lesser significant drop in trading volume in September meant that the price of ATOM coins was less volatile in late 2022. This explains why Cosmos has been a big beneficiary of the recent crypto rally.
- The highest price of ATOM is $44.70, reached on Sept. 20, 2021.
Here is the latest chart showing that the market cap for Cosmos is peaking all over again. Even though it is still far off from the Jan 2022 figures, the bull market might change that.
Now that we have the historical data out of the way, let us look at the price action of ATOM.
Short-term price analysis: Early 2023
Despite the multiple rallies in 2023, ATOM failed to break past the mentioned resistance of $16.25. Here is what our early 2023 technical analysis went:
The daily price chart reveals something crucial about ATOM’s short-term price action. Notice that ATOM has recently broken out of the descending trendline, forming a converging wedge. On top of that, the breach above the important resistance line of $14.40 is also obvious. ATOM is currently trading at $14.49 — eyeing the next resistance of $16.25.
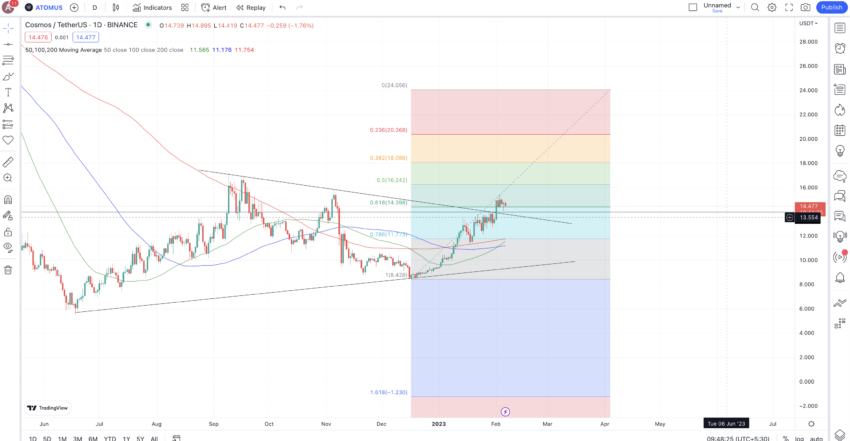
And the move does look likely, courtesy of the moving average lines. The green line, or the 50-day moving average line, just crossed above the blue line, or the 100-day moving average. It also closes in on the 200-day moving average or the red line.
While this chart captures the ATOM-USDT price potential, ATOM has also been doing well in relation to BTC. ATOM’s price action, compared to BTC, looks bullish, as captured by this detailed prediction piece.
Our December 2023 analysis
If we pull out the latest ATOM/USD chart, the bearish divergence, courtesy of the lower highs made by the RSI, is evident. Plus, ATOM is trading inside the ascending wedge pattern, which seems bearish considering the bearish RSI divergence and low volumes. At present, the lower trendline and the 20-EMA (red line) act as support levels and any breach under the $9.4 mark could lead to a deeper correction.

A rise above the $12.5 mark could invalidate the bearish trend and is the level to beat if ATOM wants to make a new high in 2024. Now that we have the short-term price forecast, we can use the weekly chart and hunt for patterns.
Pattern identification
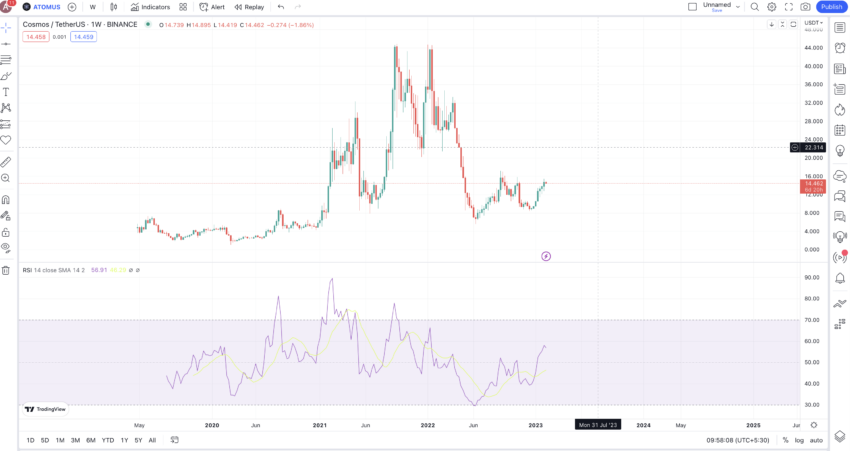
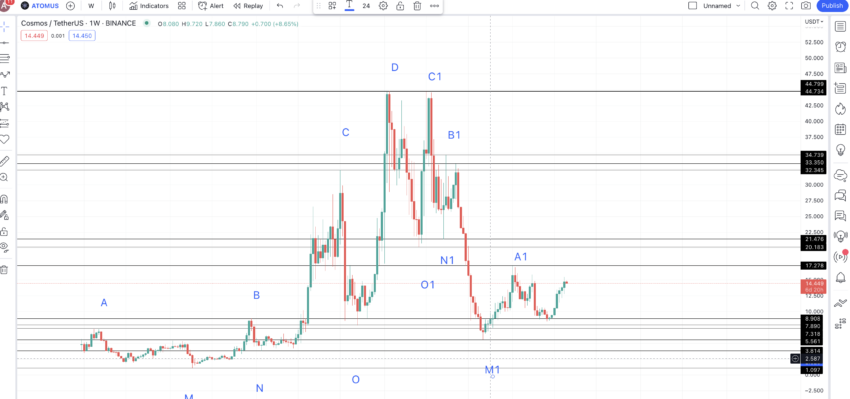
Here is the raw weekly chart alongside the relative strength index or the momentum indicator.
The pattern is clear as a day. The left side of the chart shows three discernable higher highs before the price of ATOM peaks. From there, we see ATOM making three lower highs.
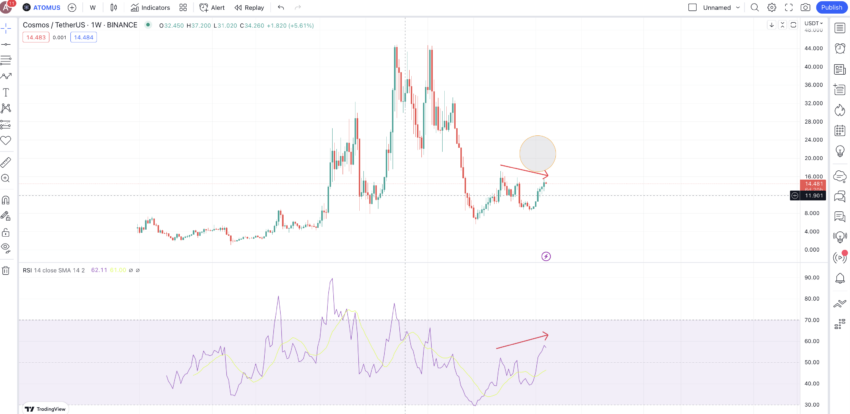
At present, we can see a weekly high forming. A circle marks the region. If you see the encircled region against the previous high, the bullish divergence, courtesy of the RSI, is visible. Therefore, we might expect the next high to form above the previous high, ending the lower-high formation. This might even kickstart a new pattern for Cosmos, where we would expect the left side of the chart to repeat itself.
Now, let us mark all the high and low points on the chart to get some data about the upswings and downswings at ATOM’s counter. Here is a chart with all the lows and highs marked for ATOM. Note that each price level could be a strong support and resistance line.
Price changes
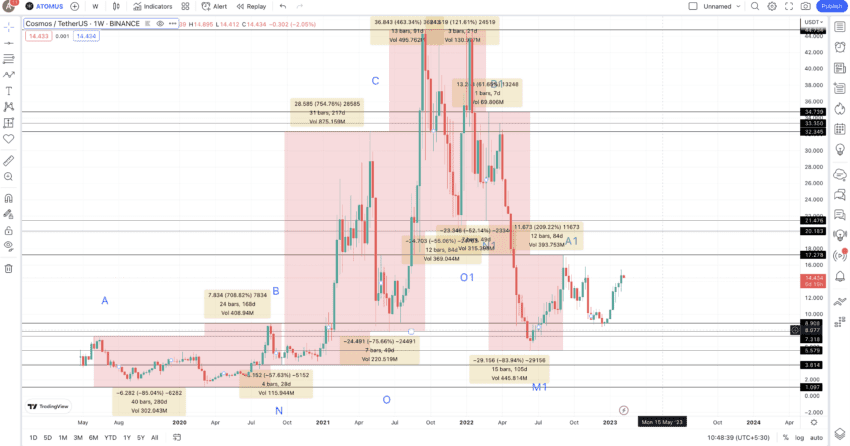
We now have to locate the price changes for two distinct paths: A to D and D to A1.
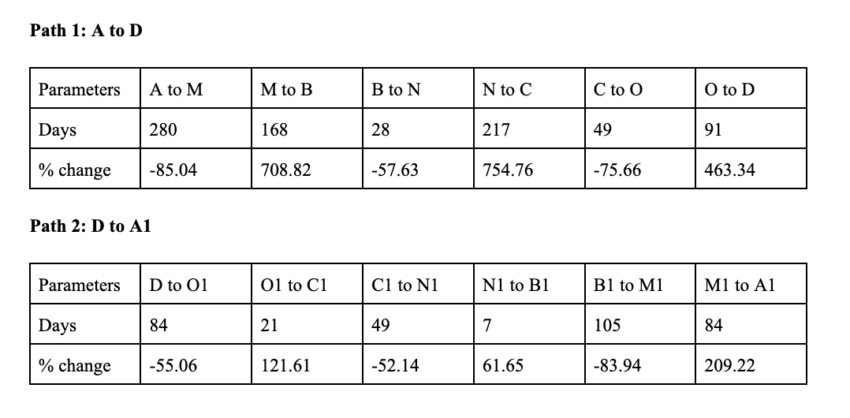
By analyzing the data from the provided tables, we can determine the average price changes and the time required for the market’s next low-to-high and high-to-low movements. Specifically, for the high-to-low average, which utilizes columns with negative values, we observed an average decrease of -68.25% over 99 days.
Conversely, the low-to-high average, calculated using columns with non-negative values, showed an average increase of 386.56% within a similar timeframe of 98 days. It’s important to note that these average price change percentages and the duration can fluctuate based on the current conditions of the crypto market. We can use these figures to project future price points for the ATOM coin, providing a more informed perspective on its potential market trajectory.
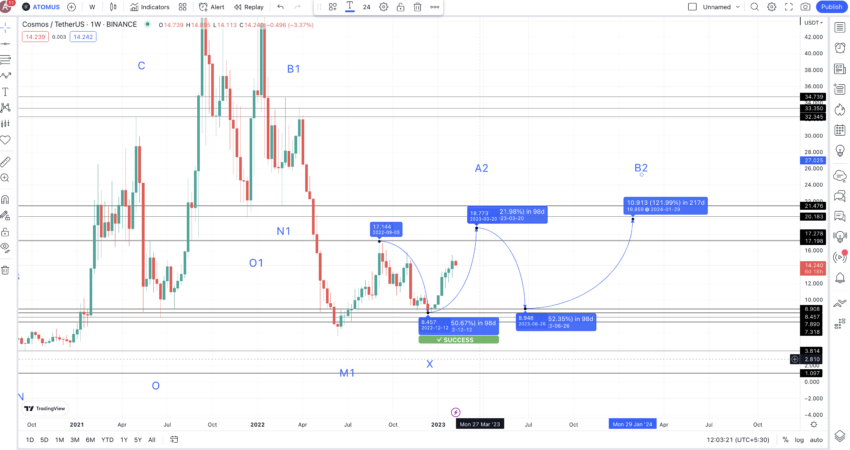
Cosmos (ATOM) price prediction 2023
Our ATOM price prediction for 2023 was partially successful at $15.15. Here is how we evaluated the elements:
A1 is the last high we have for reference. We can now use the high-to-low average drop to project the next low. However, we shall also use the drop of 52.14% — the minimum price change from the tables above.
The existing low from A1 surfaces at $8.457, corresponding to a drop of over 50%. This aligns with our tables and ATOM price forecast data. And notice that the time taken is 98 days, according to our average finding.
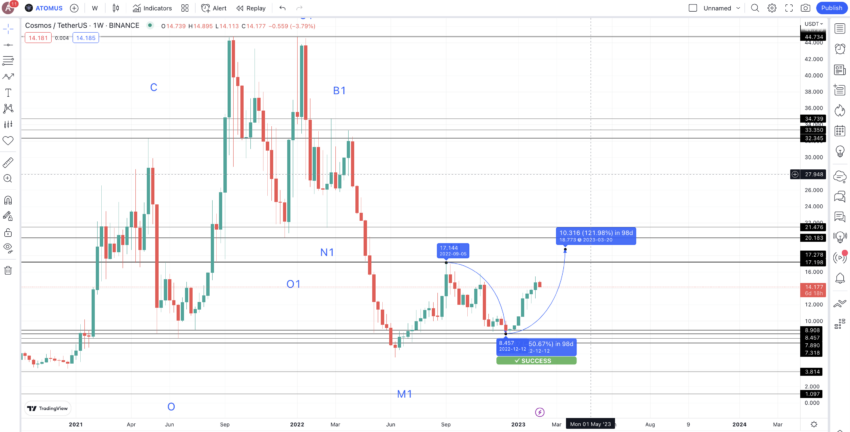
We can mark this low as X. Post X; we can use the low-to-high values to predict the next high for ATOM. The short-term chart shows that ATOM’s price looks bullish for now. However, the broader crypto market still looks a bit jaded; hence, we expect the next high to go up by 121.61% — the second lowest percentage growth per the tables above. By this time, ATOM had already increased by more than 61.65% — the lowest percentage hike. This explains why we opted to project the path by 121.61%.
This assumption puts the next Cosmos price prediction high in 99 days at $18.773. The next low from A2 could again follow the average drop of -68.25% and 99 days. However, the current price growth might help ATOM take support at $8.908 — a level coinciding with B from the left side of the pattern. This level could be the minimum ATOM price prediction for 2023.
Cosmos (ATOM) price prediction 2024
From the low in 2023, we can expect ATOM to make a higher high, going up by 121.61%. However, between 2023 and 2024, we can expect the crypto market to consolidate and trade in a range. Hence, the next Cosmos price prediction level could surface in 217 days — the max timeframe of a low-to-high move from the tables above.
Therefore, we can expect the next high or B2 to surface at $19.86 from the previous data and $13.87, based on the 2023 low of $6.26. However, this could be the Cosmos price prediction level for 2024.
Projected ROI from the current level: 26% to 81.5%
Cosmos (ATOM) price prediction 2025
Outlook: Bullish
From the 2024 high or B2, we can expect the next low to drop only by 52.14% — the lowest drop figure. We expect this because the ATOM coin would have gained decent price momentum by now. This puts the next low at $9.489.
By now, the Cosmos price prediction trend of higher highs and higher lows would show up clearly. Therefore, by 2025, we can expect the price of ATOM to follow the average low-to-high growth of 386.56%. The distance could be 217 days, per the table above.
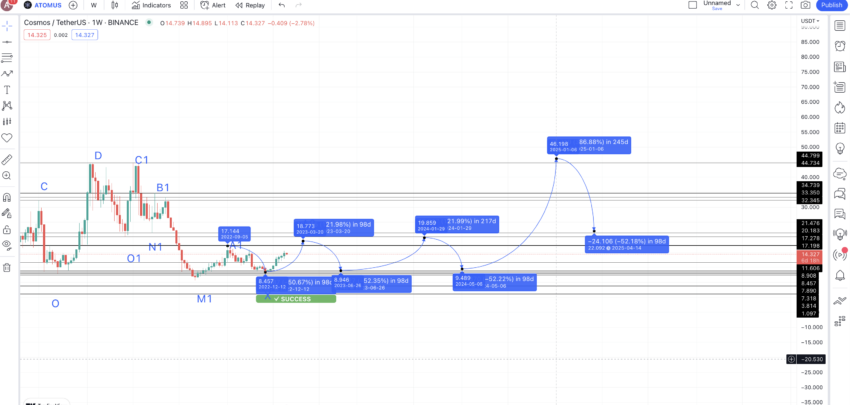
Hence, the 2025 high for Cosmos could surface at $46.20. The low from that level could take support at $22.10 — coinciding with the lowest drop percentage of 52.14%. We can expect ATOM to form a new all-time high by this time.
The next high, in 2026, could still follow the 121.61% price growth, surfacing at $49.060. This might feel a bit underwhelming compared to the 2025 high. This might act as a cool-down compared to the peaks touched in 2025.
Projected ROI from the current level: 322%
Cosmos (ATOM) price prediction 2030
Outlook: Bullish
We can connect the levels using the Fib indicator now that we have 2025 low and 2026 high. If we trace the same growth path till 2030, the expected high could surface at $211.40.
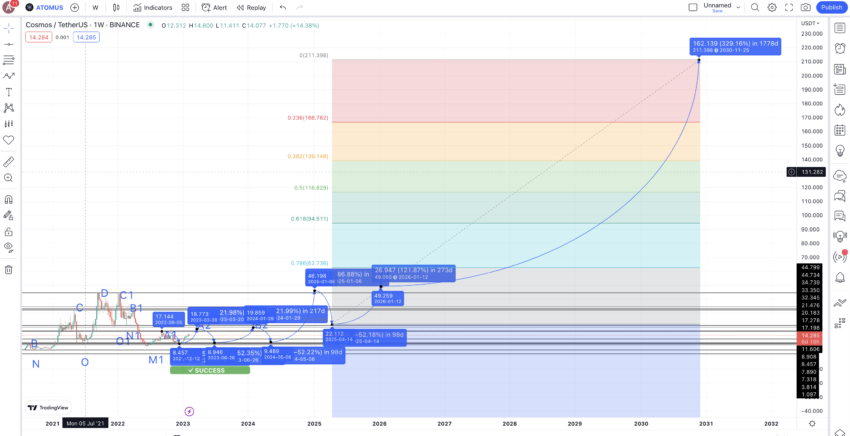
We expect the Cosmos price prediction low in 2030 to surface at $139.15.
Projected ROI from the current level: 1171%
Cosmos (ATOM’s) long-term price prediction until the year 2035
Outlook: Bullish
Now that we have the price of Cosmos traced till 2030, we can use similar calculations to trace the path till 2035. Here is the Cosmos price forecast table to help you with the same.
You can easily convert your ATOM to USD here
| Year | | Maximum price of ATOM | | Minimum price of ATOM |
| 2023 | $15.15 | $6.26 |
| 2024 | $13.80 to $19.86 | $9.489 |
| 2025 | $46.20 | $22.10 |
| 2026 | $49.06 | $30.42 |
| 2027 | $66.23 | $51.66 |
| 2028 | $99.34 | $61.60 |
| 2029 | $149.02 | $92.40 |
| 2030 | $211.40 | $139.15 |
| 2031 | $274.82 | $214.36 |
| 2032 | $357.26 | $278.66 |
| 2033 | $535.90 | $418.00 |
| 2034 | $723.46 | $564.30 |
| 2035 | $1085.20 | $672.82 |
Is the Cosmos price prediction practical and accurate?
Our Cosmos price prediction model relies on more than technical analysis. We also focus on the fundamentals, growth prospects of the Cosmos ecosystem and blockchain, tokenomics, and other insights. Therefore, we can expect this price prediction theory to be as accurate as possible in a dynamic crypto market.
Frequently asked questions
What will ATOM be worth in 2025?
How high can the ATOM price go?
Is ATOM still a good investment?
Will Cosmos reach $100?
Disclaimer
In line with the Trust Project guidelines, the educational content on this website is offered in good faith and for general information purposes only. BeInCrypto prioritizes providing high-quality information, taking the time to research and create informative content for readers. While partners may reward the company with commissions for placements in articles, these commissions do not influence the unbiased, honest, and helpful content creation process. Any action taken by the reader based on this information is strictly at their own risk. Please note that our Terms and Conditions, Privacy Policy, and Disclaimers have been updated.