
You don’t need a crash to spot a downturn. If you’re waiting for price dumps or headlines to confirm it, you’re already too late. The real bear market signs show up earlier in how capital retreats, where liquidity fades, and when usage quietly drops off. If you want to catch the crypto market downturn before it hits your portfolio, start watching what smart money does, not what X says. Here’s what you need to know.
KEY TAKEAWAYS
➤ Bear markets don’t start with panic. They start when capital sidelines, activity dries up, and no one’s using the money that’s still on-chain.
➤ Incentives stop working, new launches fade within hours, and even volatility feels empty — all signs that real users have checked out.
➤ By the time headlines confirm it, smart money has already pulled liquidity, bridged out, and left retail holding the bag.
- 7 underrated bear market signs to watch out for
- Stablecoins supply increases while on-chain activity falls
- DEX incentives go up, but volume doesn’t
- Volatility spikes without liquidity support
- Token pairs fragment across chains
- Smart money withdrawals from LPs and lending protocols
- New launches flatline within 48 hours
- Bridge outflows to stables or centralized chains spike
- Bonus signal: Funding rate divergences and liquidation clusters
- The bear market signs you thought mattered (but rarely do)
- Can you really spot a bear market before it hits?
- Frequently asked questions
7 underrated bear market signs to watch out for
Bear markets don’t begin with a bang. They begin with hesitation. Before prices fall, capital slows down. Activity thins, and liquidity disappears without a headline.
If you know what to track, you’ll see the retreat happening in real-time long before the crash becomes obvious.
These are the seven underrated bear market signs that smart traders catch before the crowd:
- Stablecoin supply increases while on-chain activity falls
- DEX incentives go up, but volume doesn’t
- Volatility spikes without liquidity support
- Token pairs fragment across chains
- Smart money withdraws from LPs and lending protocols
- New launches flatline within 48 hours
- Bridge outflows to stables or centralized chains spike
Each of these tells a story, not of panic, but of confidence quietly leaving the room. In the next section, we’ll break them down one by one, with real examples, data-backed tracking cues, and what each sign reveals about the market’s direction.
Stablecoins supply increases while on-chain activity falls
One of the earliest bear market signals is when stablecoin supply rises, but the rest of the network goes quiet. A growing pile of USDC, USDT, or DAI with no corresponding spike in trading or protocol activity usually means users are pulling back, not gearing up.
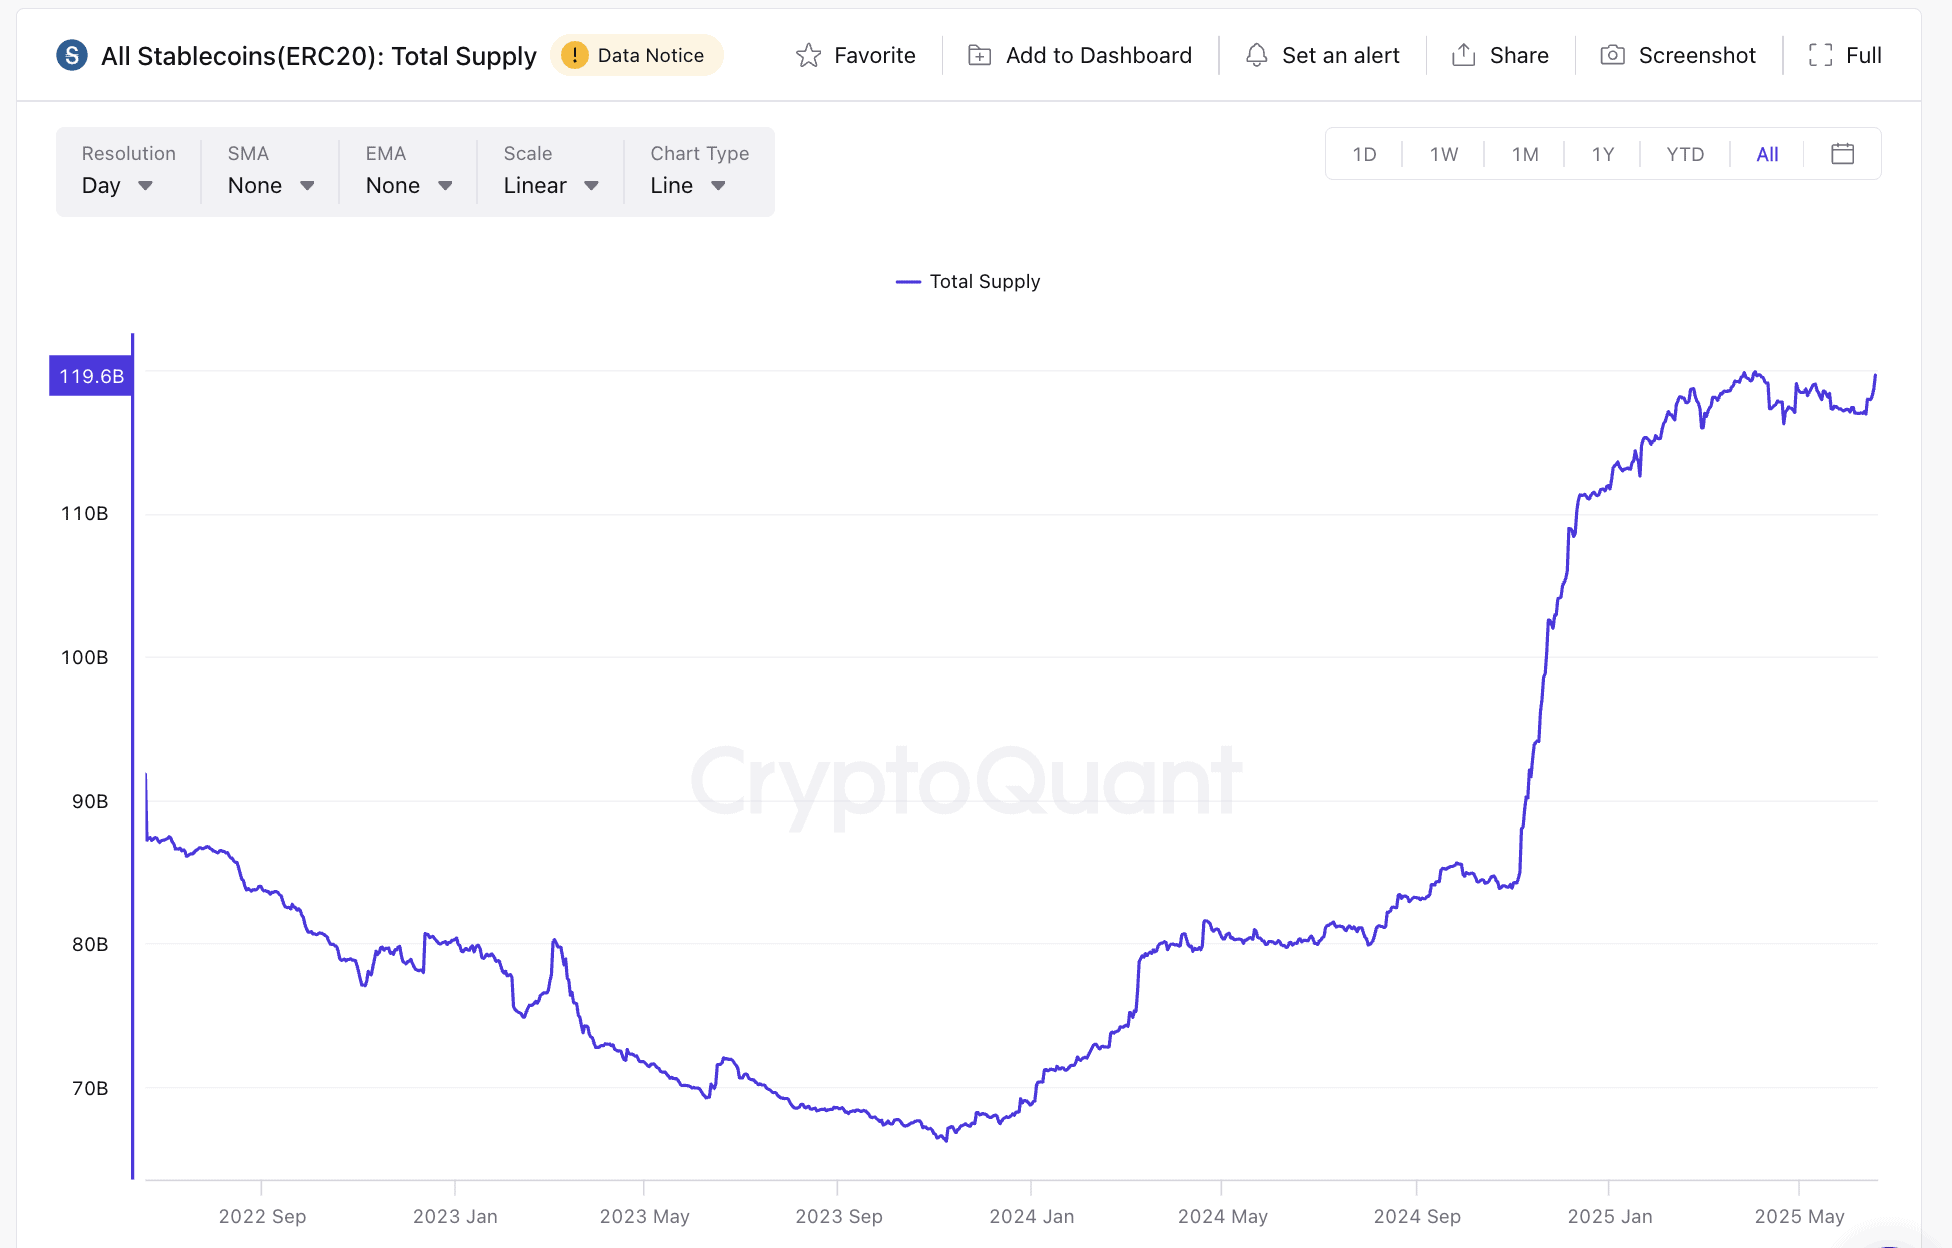
This divergence becomes obvious when transaction counts drop, DEX volumes flatten, and wallet activity shrinks, even as stablecoin balances across chains creep up. Capital isn’t exiting. It’s just waiting, sidelined.
In mid-2023, Ethereum’s stablecoin supply crossed $78B, while daily active addresses dropped over 25%. Activity on Arbitrum and Optimism slowed in parallel. Two weeks later, ETH slid from $1,870 to $1,570, and DeFi TVL shrank by 15%.
You’ll notice this shift across dashboards that show wallet usage, stablecoin flows, and chain-level volumes. When the money sticks around, but no one’s using it, the party’s already over.
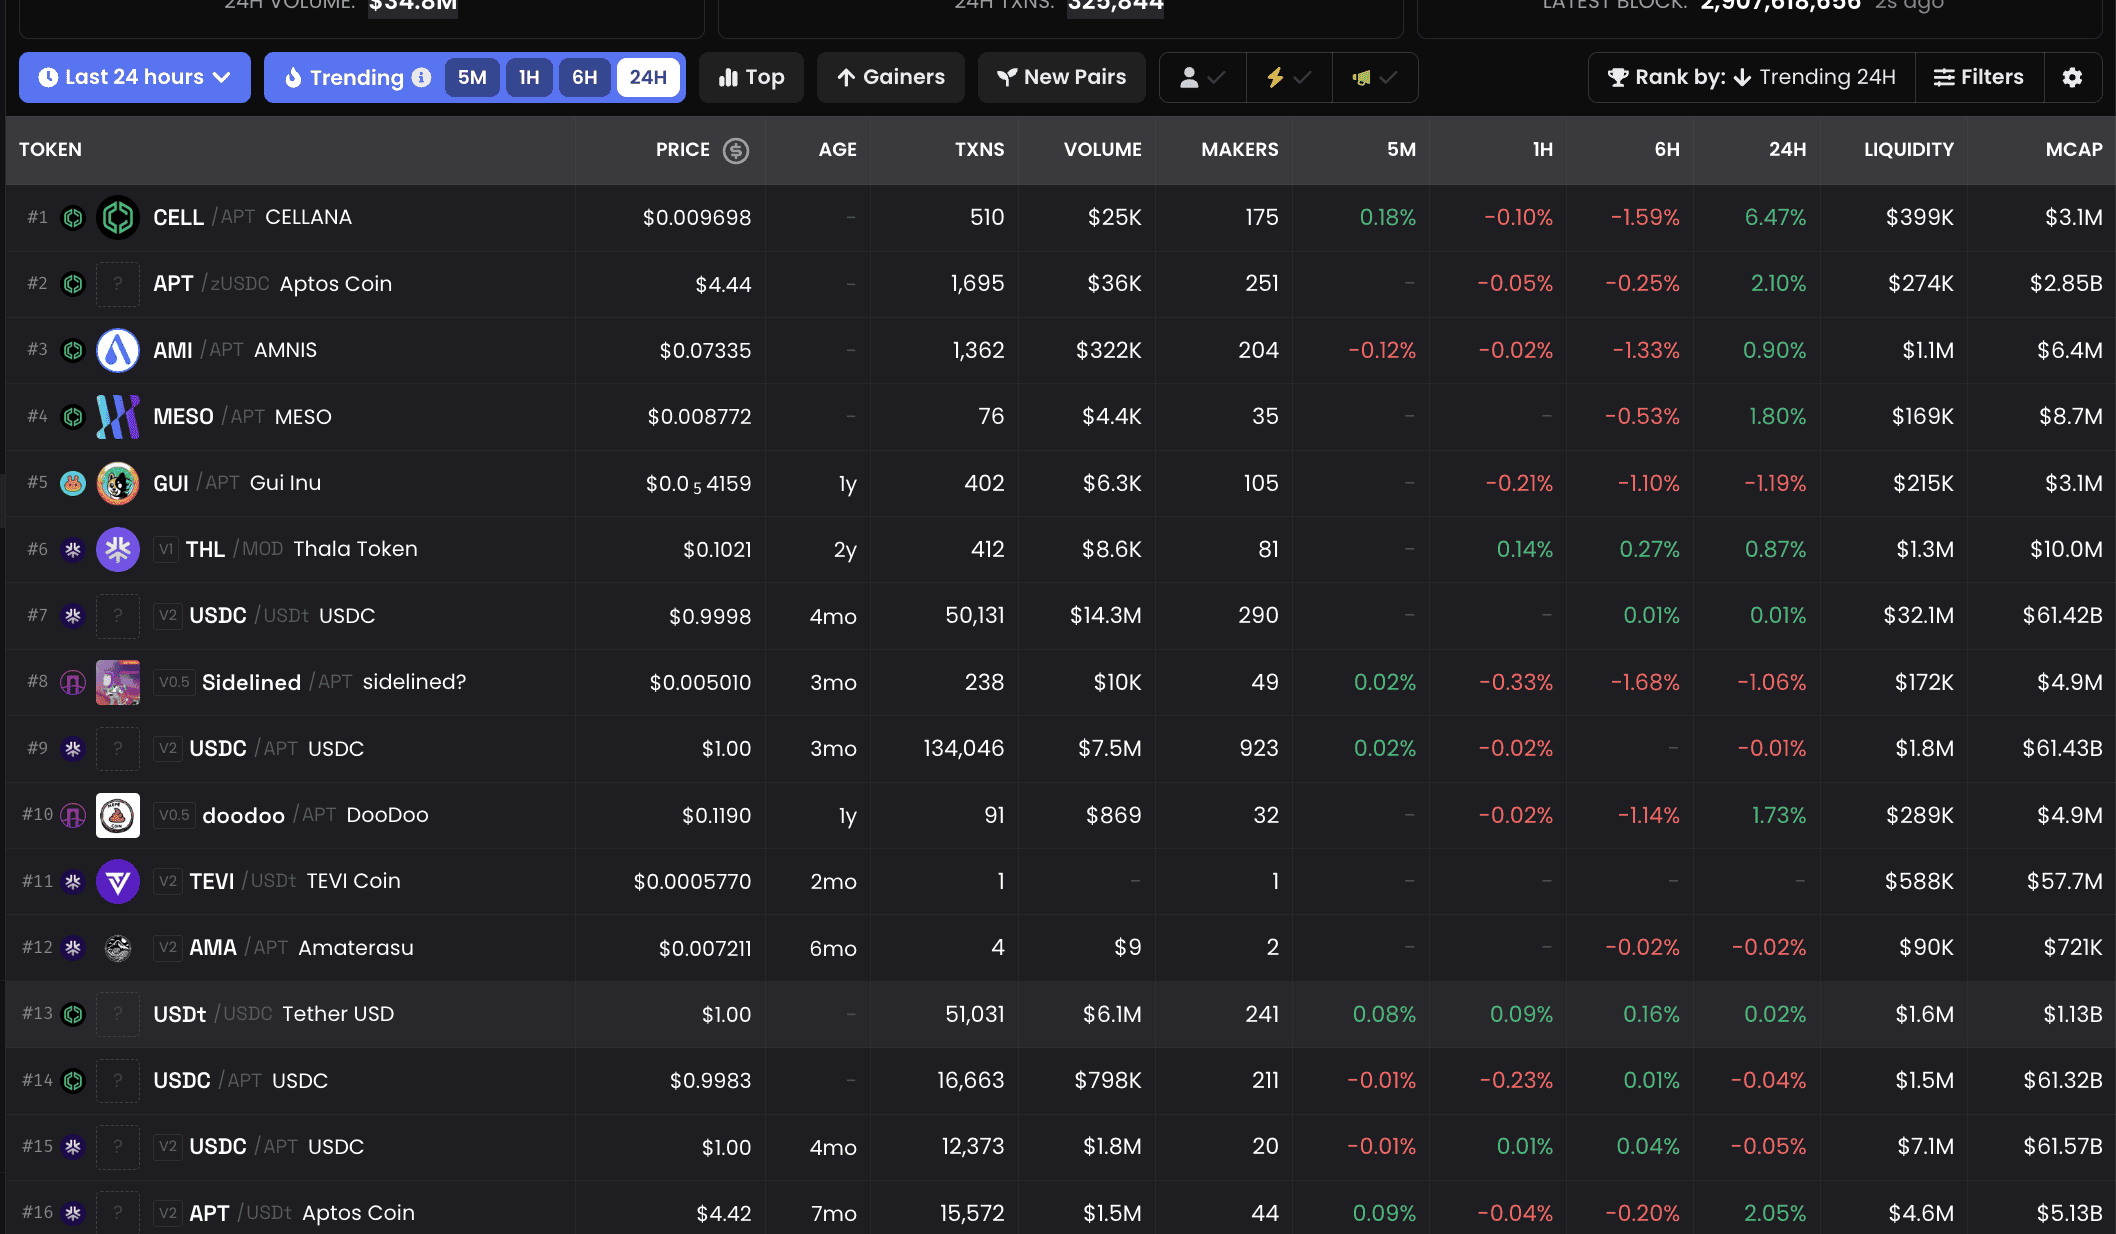
DEX incentives go up, but volume doesn’t
When market sentiment sours, protocols often boost rewards to keep traders around. But if DEX incentives spike and trading volume stays flat — or worse, declines — it’s a clear sign users aren’t biting. Yield isn’t sticky when conviction is low.
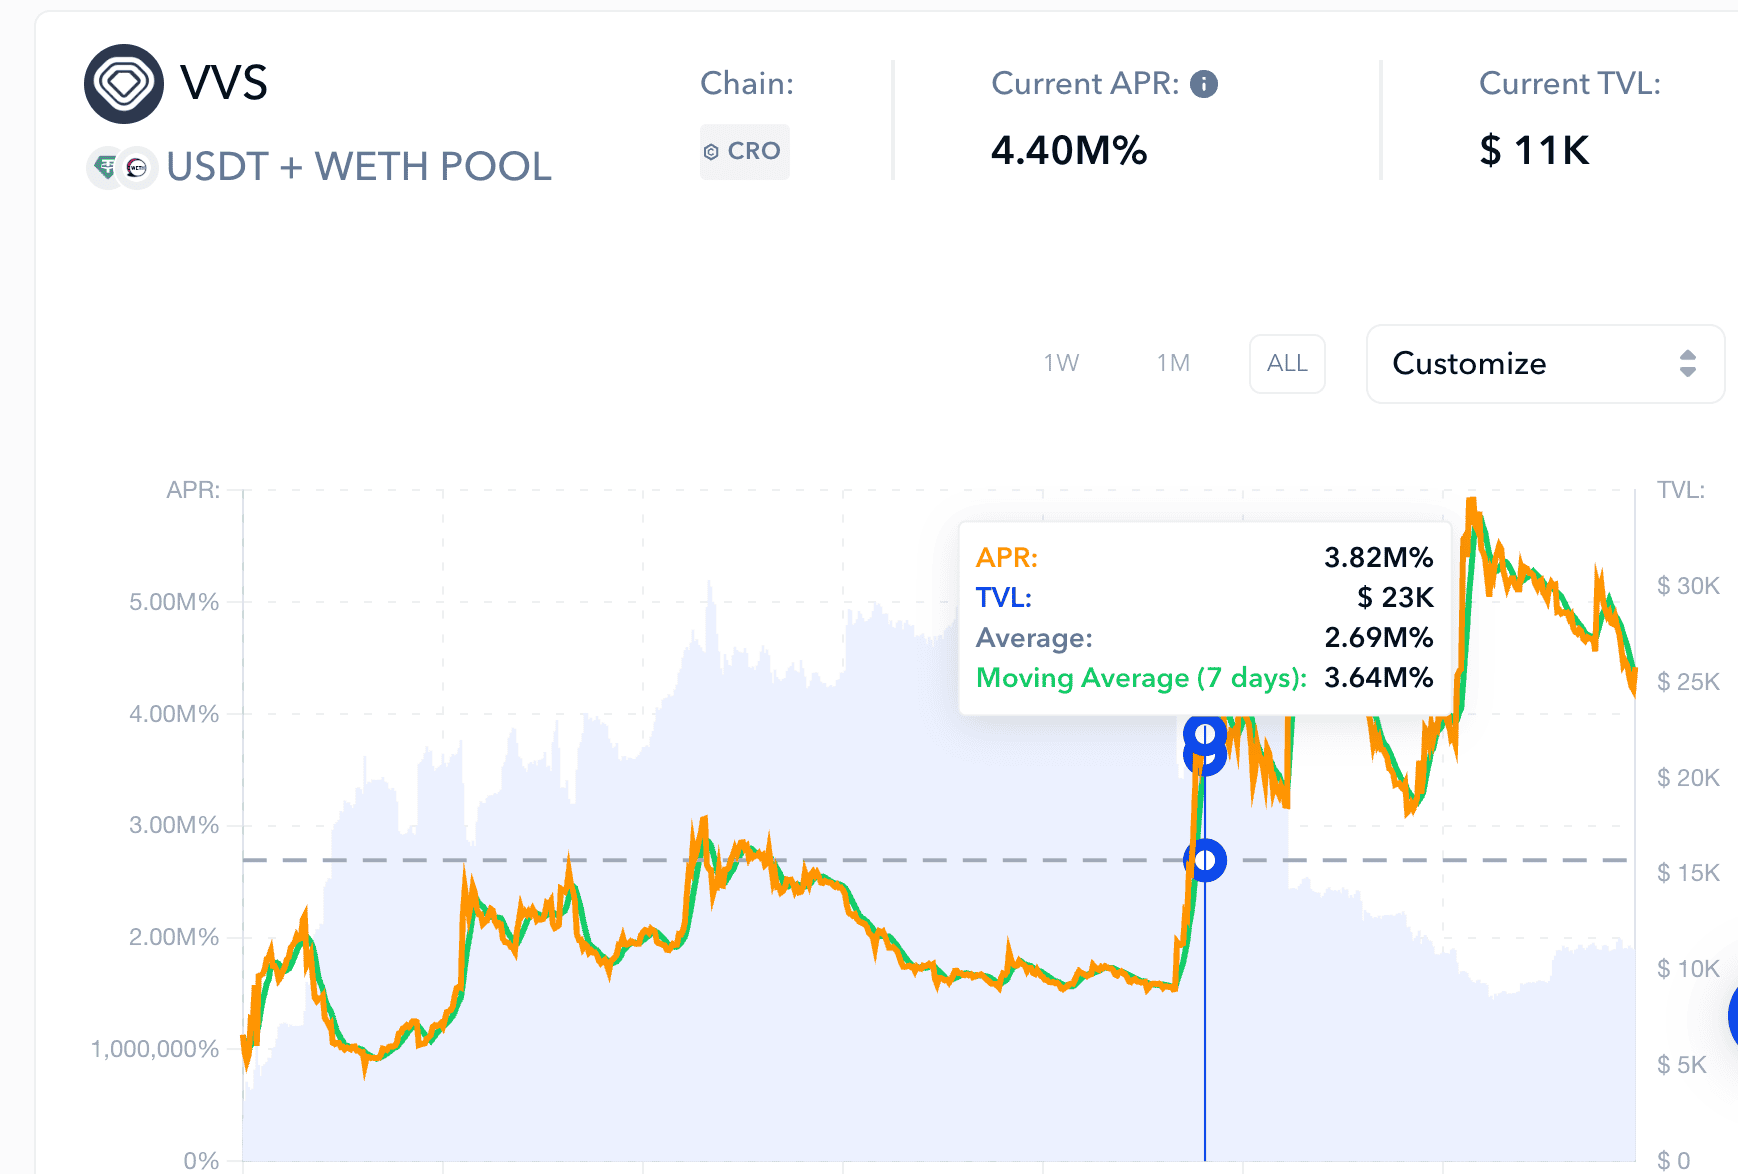
You’ll spot this when emissions, reward APRs, or LM campaigns rise sharply, but daily volumes on that DEX or chain refuse to follow. It often signals inorganic activity or desperate capital rotation, not real usage.
In early May 2023, multiple Arbitrum DEXs increased rewards after GMX and Camelot volumes dipped. Despite that, Camelot’s volume stayed under $20M daily, while Arbitrum-wide stablecoin swaps fell over 30%. By June, most of those campaigns were quietly slashed, and token prices retraced.
To catch this in real-time, compare protocol-level emissions or DEX-specific incentive spikes with actual usage data, like trading volumes, unique traders, or pool activity. If the bribes get louder but the crowd doesn’t return, the signal is clear: we’re slipping into exit mode.
Volatility spikes without liquidity support
Sudden price swings aren’t always signs of life. In bear markets, they’re often warning shots.
When volatility rises but liquidity doesn’t, it usually means that large moves are happening in a shallow market. There’s not enough capital to cushion the shifts, so even small trades move prices disproportionately.
You’ll often see this on mid-cap tokens where spreads widen, and price wicks get violent, but order books or DEX depth don’t show matching support. It’s not bullish momentum — it’s thin floors.
This happened in April 2022 when tokens like APE and LUNA showed extreme hourly spikes. But despite the action, DEX liquidity on chains like Ethereum and Terra remained stagnant. Within weeks, both tokens cratered — LUNA infamously going to zero.
The best way to spot this pattern is by comparing volatility metrics with slippage charts and depth-of-book data. When one moves without the other, the risk of fake breakouts or flash crashes grows dramatically.
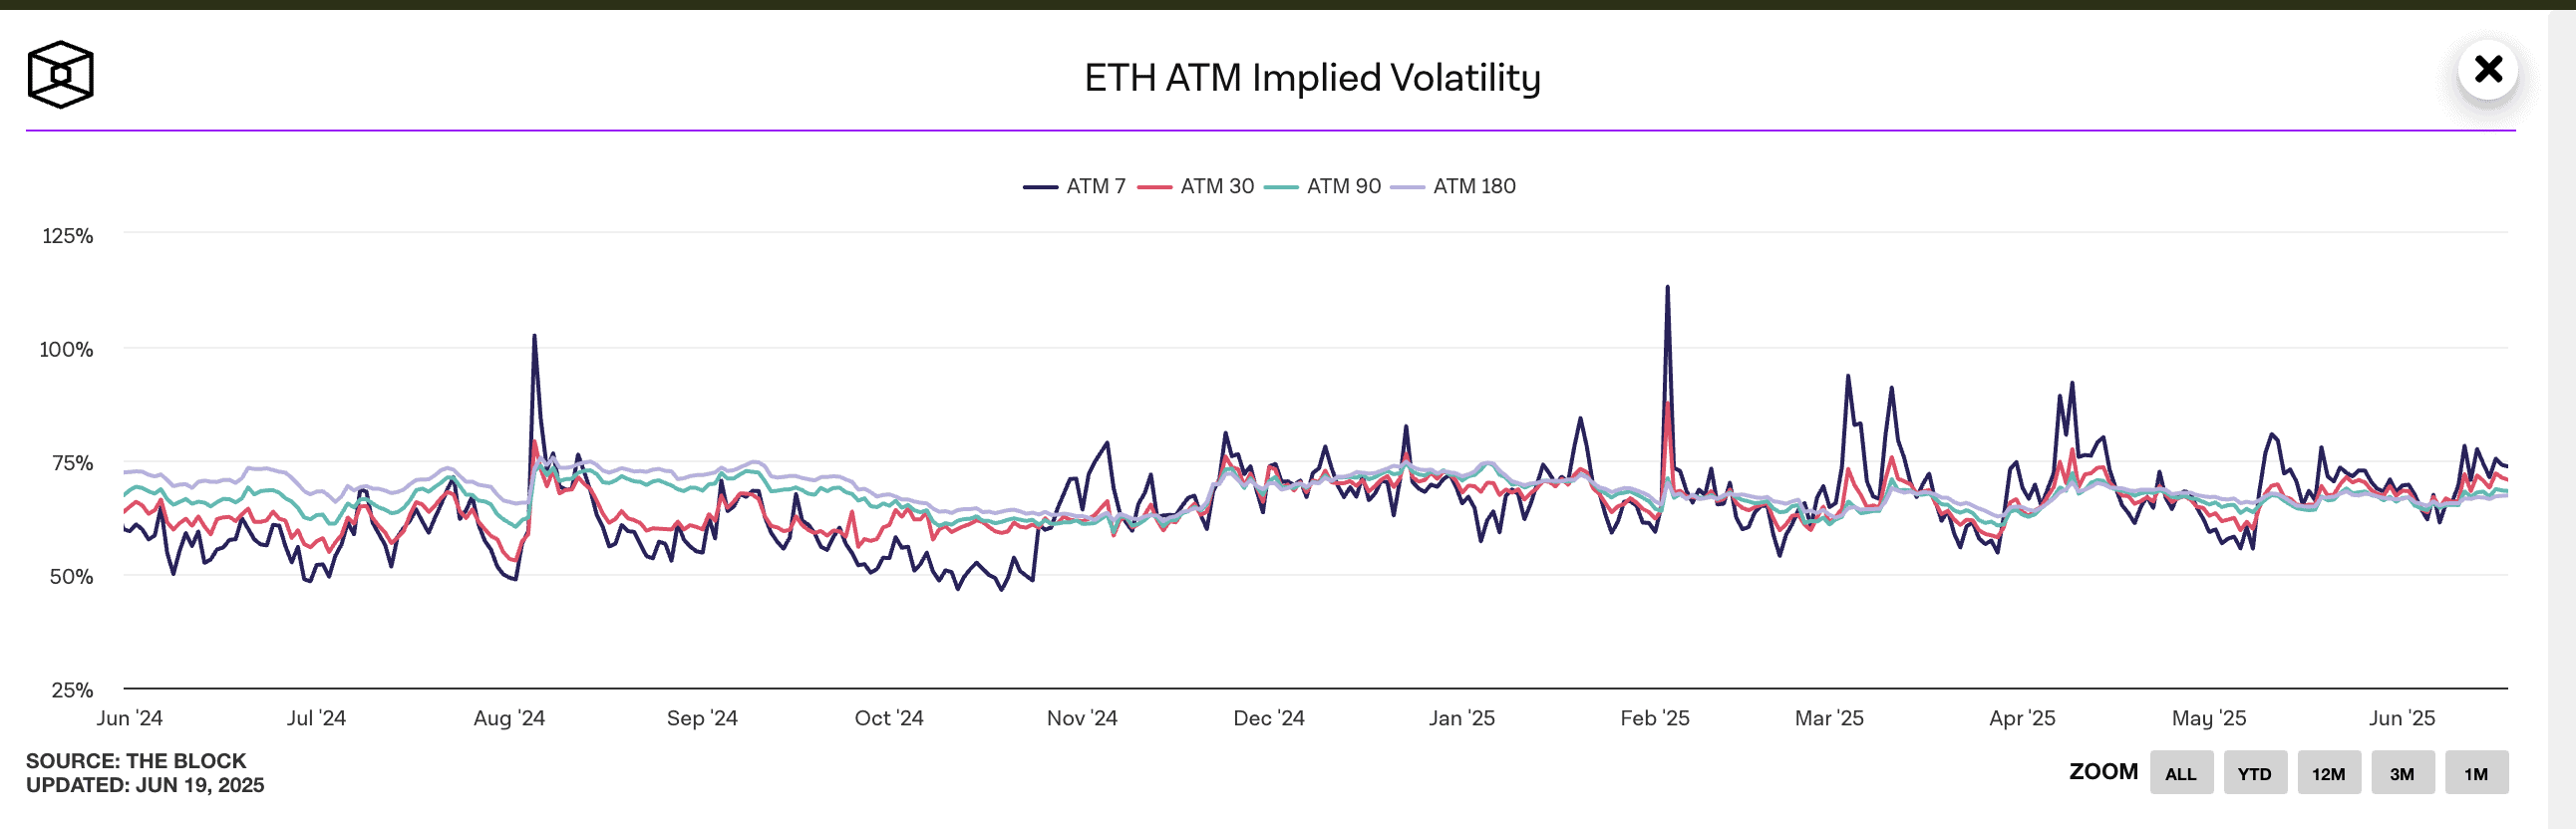
Platforms that visualize price volatility alongside order depth or slippage can help identify when the market is too thin to trust the move.
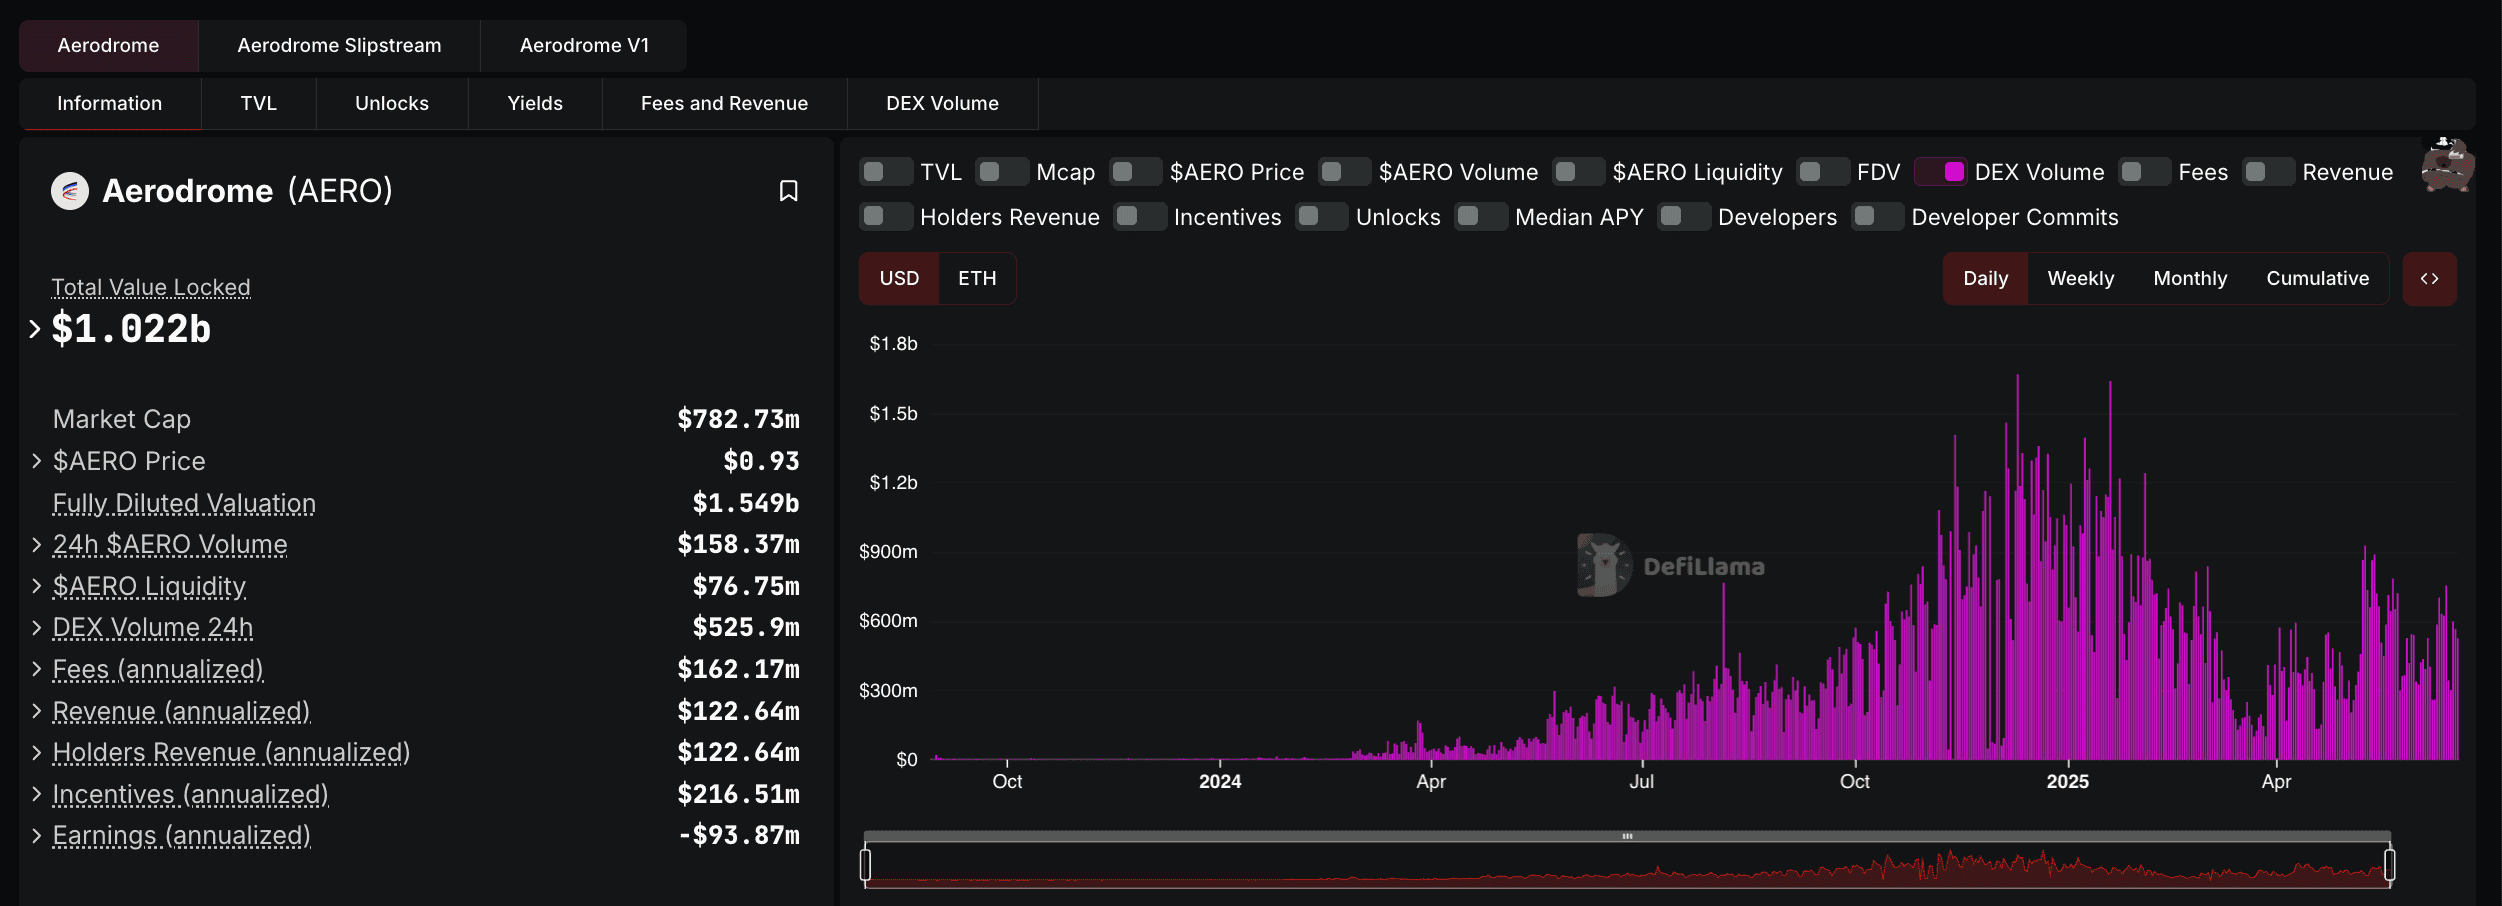
Token pairs fragment across chains
In healthy markets, token liquidity tends to converge — tighter spreads, deeper pools, and uniform pricing across chains. But during early bear cycles, that coherence breaks.
You’ll see the same token (like USDC, ARB, or OP) trading at noticeably different prices or volumes across L1s and L2s. That’s not just arbitrage noise. It’s a signal that capital is fragmenting and liquidity providers are pulling back from less active venues.
For example, in late October 2023, WETH-OP pools on Arbitrum showed strong liquidity and stable pricing. But the same pair on Base saw shallow liquidity and over 0.8% slippage on trades above $ 10 K. The chain divergence continued until incentives were pulled, and price eventually collapsed across both.
You can track this pattern by comparing pricing spreads, liquidity depth, and pool sizes of the same token pair across major chains. Platforms that let you view token-specific pool health and slippage metrics across DEXs are particularly helpful.
When pricing diverges and pools thin out, it’s a sign the market no longer trusts equal upside across chains. That’s often the prelude to a broader retrace.
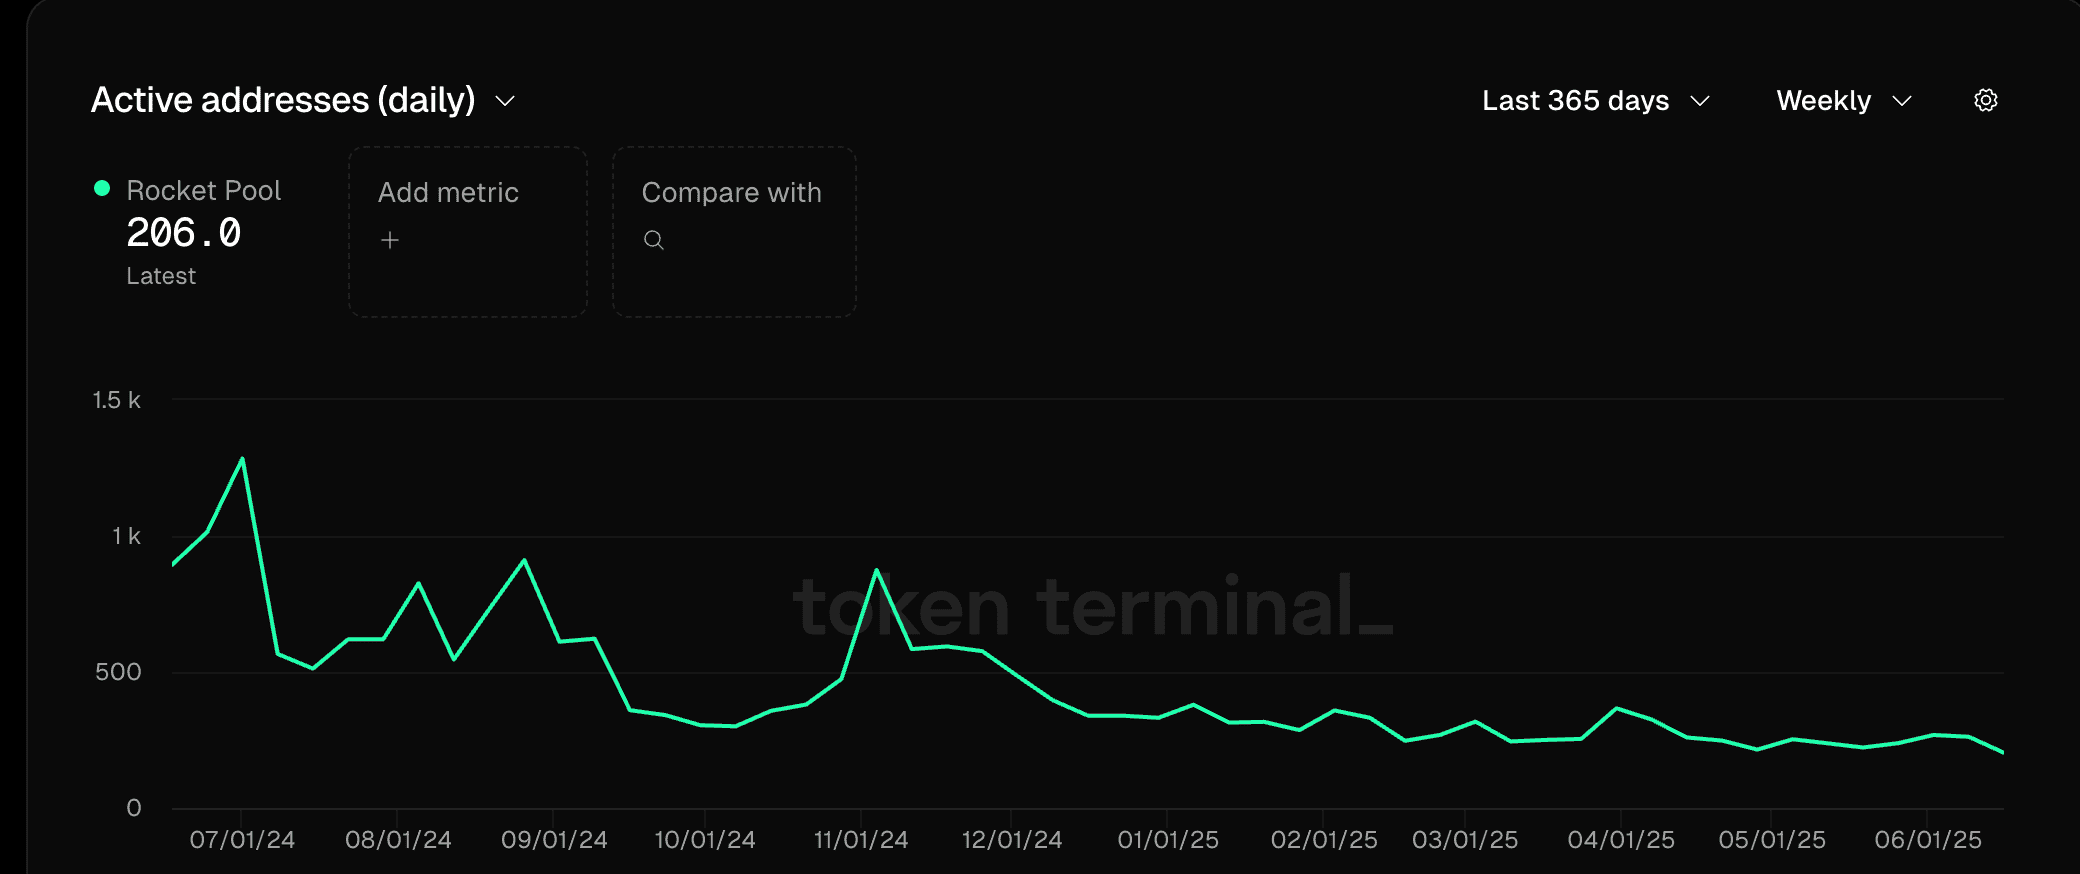
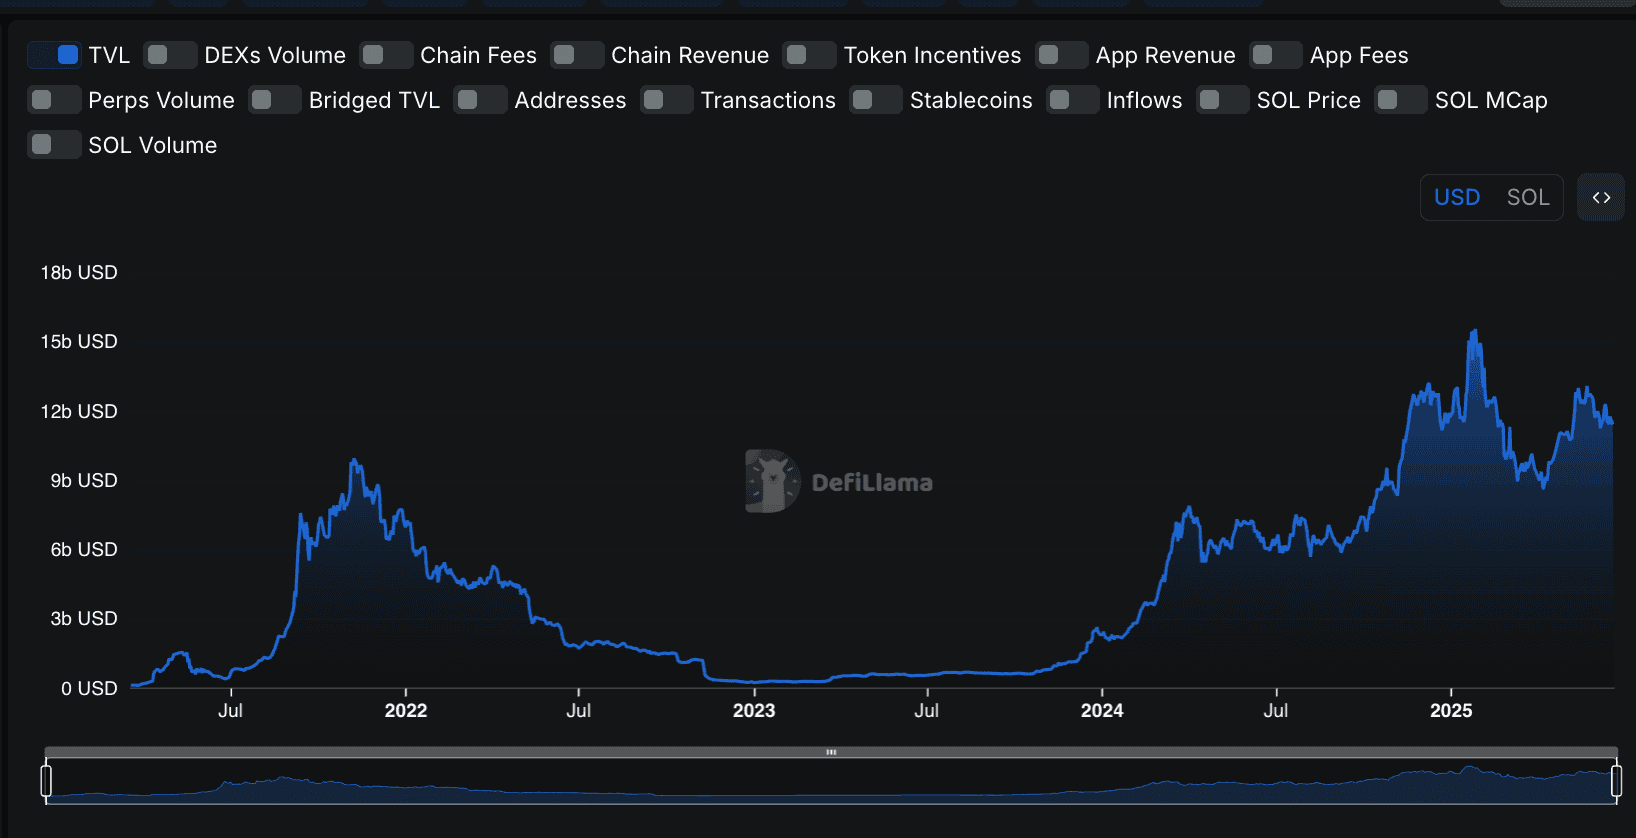
Smart money withdrawals from LPs and lending protocols
When markets turn, smart money doesn’t wait for a red candle. It quietly de-risks. One of the clearest signs is capital flowing out of LPs and lending protocols before prices move.
You’ll often see large TVL drops on lending platforms like Aave or Compound, even when rates and incentives remain stable. AMM pools like ETH/USDC or stETH/ETH start thinning out. This is not due to yield changes but because whales are pulling out liquidity and parking it in stables.
In May 2022, Curve’s 3pool saw a sharp $500M+ drop in liquidity days before the Terra collapse. Lending TVL across protocols dropped in tandem, even though nothing major had hit the news yet. It wasn’t fear. It was foresight.
To track this, check whether lending TVL is sliding without external triggers or if popular LPs are losing depth even during sideways price action. Platforms like Token Terminal, DeFiLlama, and protocol dashboards can show you these trends. You just have to compare them week by week.
If the big players are no longer willing to provide liquidity, they’re definitely not betting on upside. That’s usually your cue to watch your own risk.
New launches flatline within 48 hours
In a healthy market, new token launches bring buzz, activity, and sticky users. But in early bear phases, that excitement vanishes fast, even if prices look stable on the surface.
You’ll start seeing new projects lose traction almost instantly. Even airdrops and meme coins barely trend past Day 1. The on-chain metrics — transactions, unique wallets, holding patterns — drop off before any price dip.
In late 2021, projects on Avalanche and BSC that once drove $50M+ in Day 1 TVL started stagnating within 24 hours. Their tokens didn’t crash immediately, but user growth flatlined, and LPs exited faster than they entered. The signs were all there, hiding under the short-lived hype.
To spot this, don’t just follow social buzz. Look for traction decay: does the DEX volume, active addresses, or liquidity supporting the token drop sharply within two days of launch? Platforms like DEXTools, DeFiLlama, and Artemis can help you observe these patterns in real-time.
When launches can’t hold interest, it’s not a project problem. It’s a market problem.
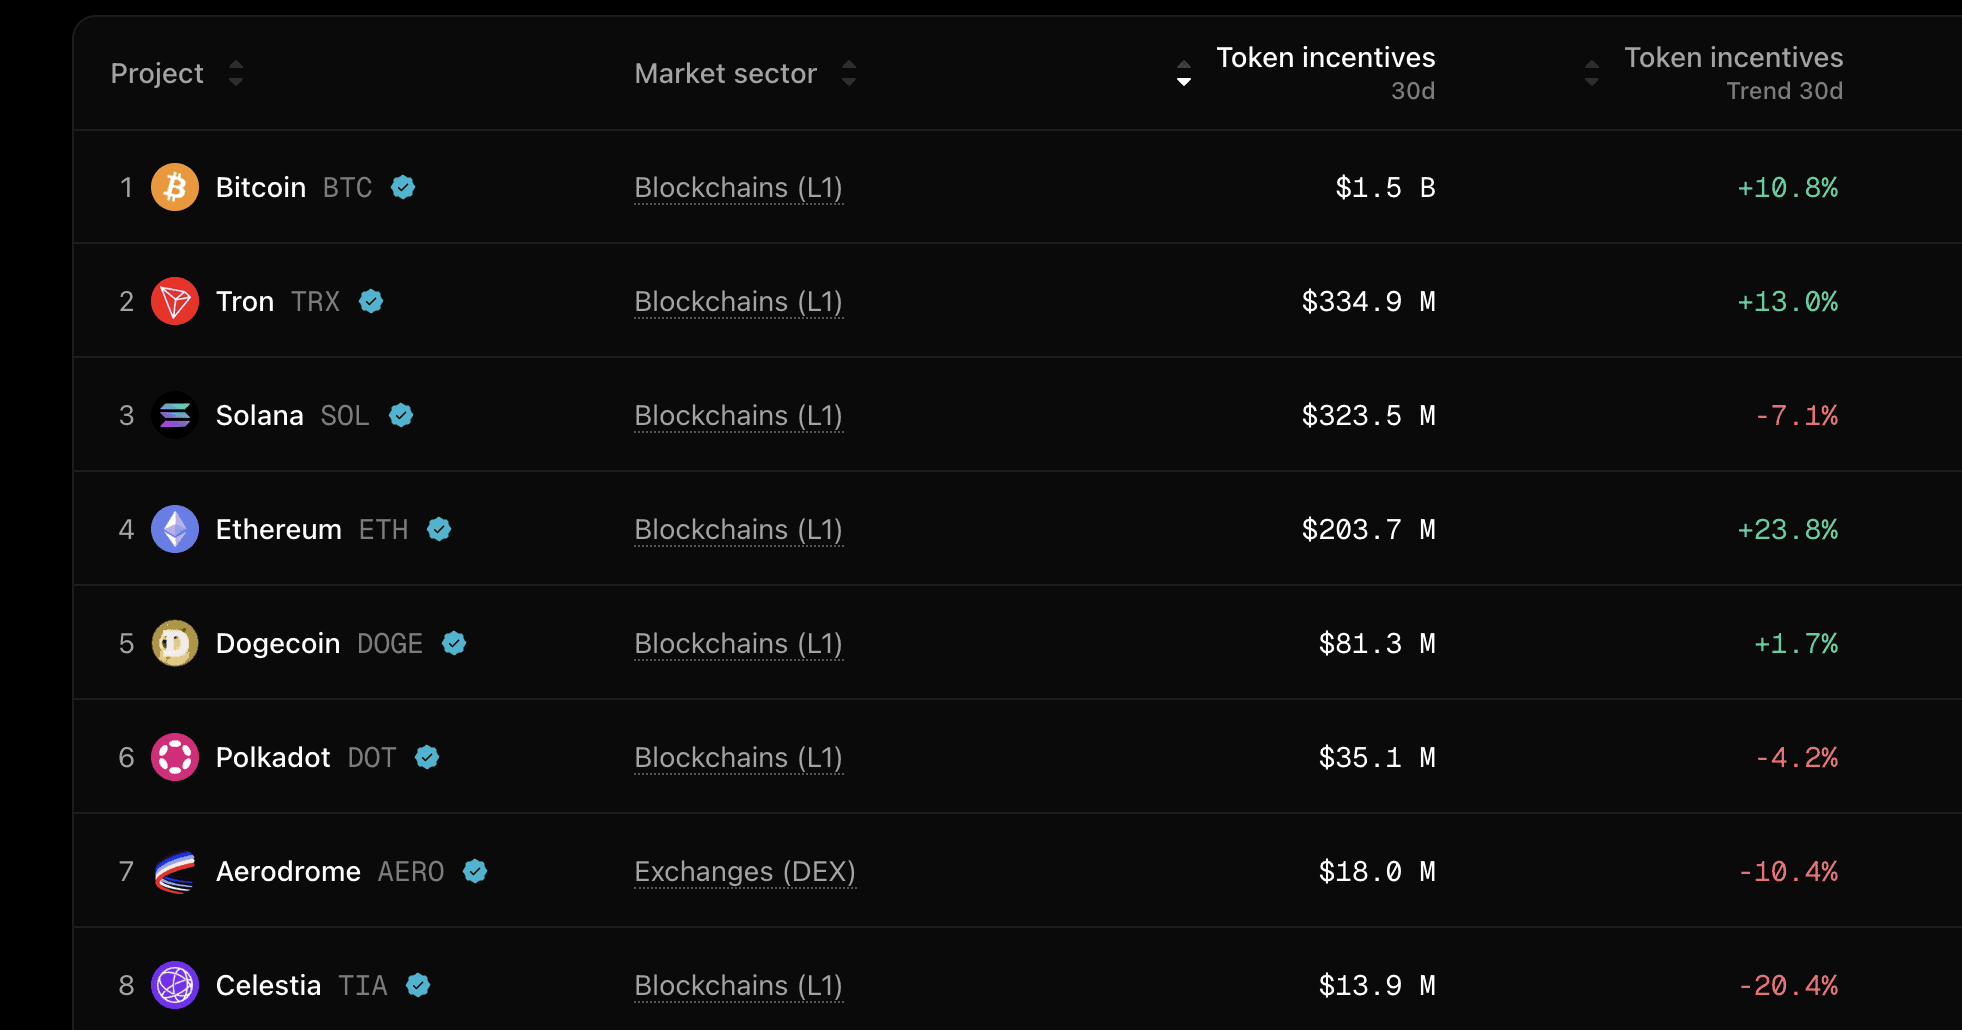
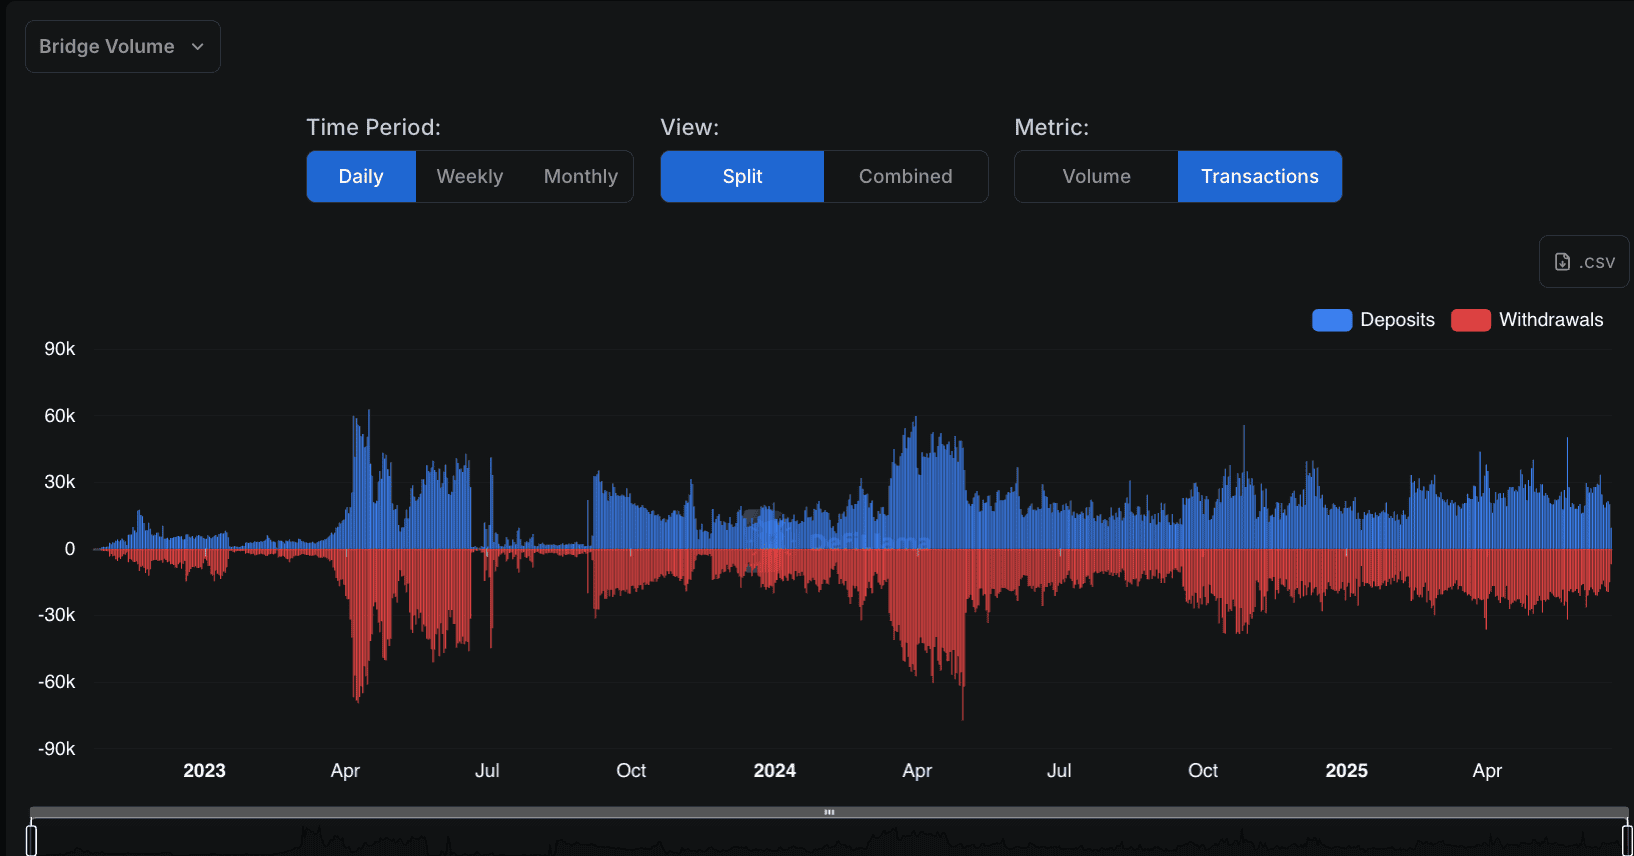
Bridge outflows to stables or centralized chains spike
When capital quietly exits the ecosystem, it doesn’t always go straight to exchanges. Sometimes, it takes a detour through bridges.
One of the clearest early bear market signs is a sustained increase in bridge outflows, especially when the destination is a stablecoin on the Ethereum mainnet or a centralized chain like BNB or Tron. These aren’t rotation plays. They’re exits.
In April 2022, weekly bridge inflows into Ethereum stables rose sharply — USDC and USDT bridged in from alt-L1s like Fantom and Avalanche. Meanwhile, activity on those chains dropped. It wasn’t rotation. It was risk-off migration before the major dump in May.
Watch for inflows into “safe” chains and stables, paired with declining TVL on risk-heavy L2s and alt-L1s. If users are pulling capital into USDC on Ethereum while abandoning native assets elsewhere, they’re preparing for downside.
You can track this trend using dashboards on DeFiLlama (Bridge flows), Artemis, or chain-specific explorers. Look for rising stablecoin inflows on Ethereum, net outflows from chains like Base, and low redeployment activity. When people start bridging out and they don’t come back in, the market’s sending a message.
Bonus signal: Funding rate divergences and liquidation clusters
Most retail traders ignore funding rates or only check them when the market is swinging hard. But smart money tracks perpetual futures data daily, especially when on-chain sentiment diverges from what traders are paying to stay in positions.
When funding rates turn deeply negative on majors like BTC or ETH — despite stable on-chain activity — it’s often a sign of short-term panic, not structural bearishness. That creates long opportunities.
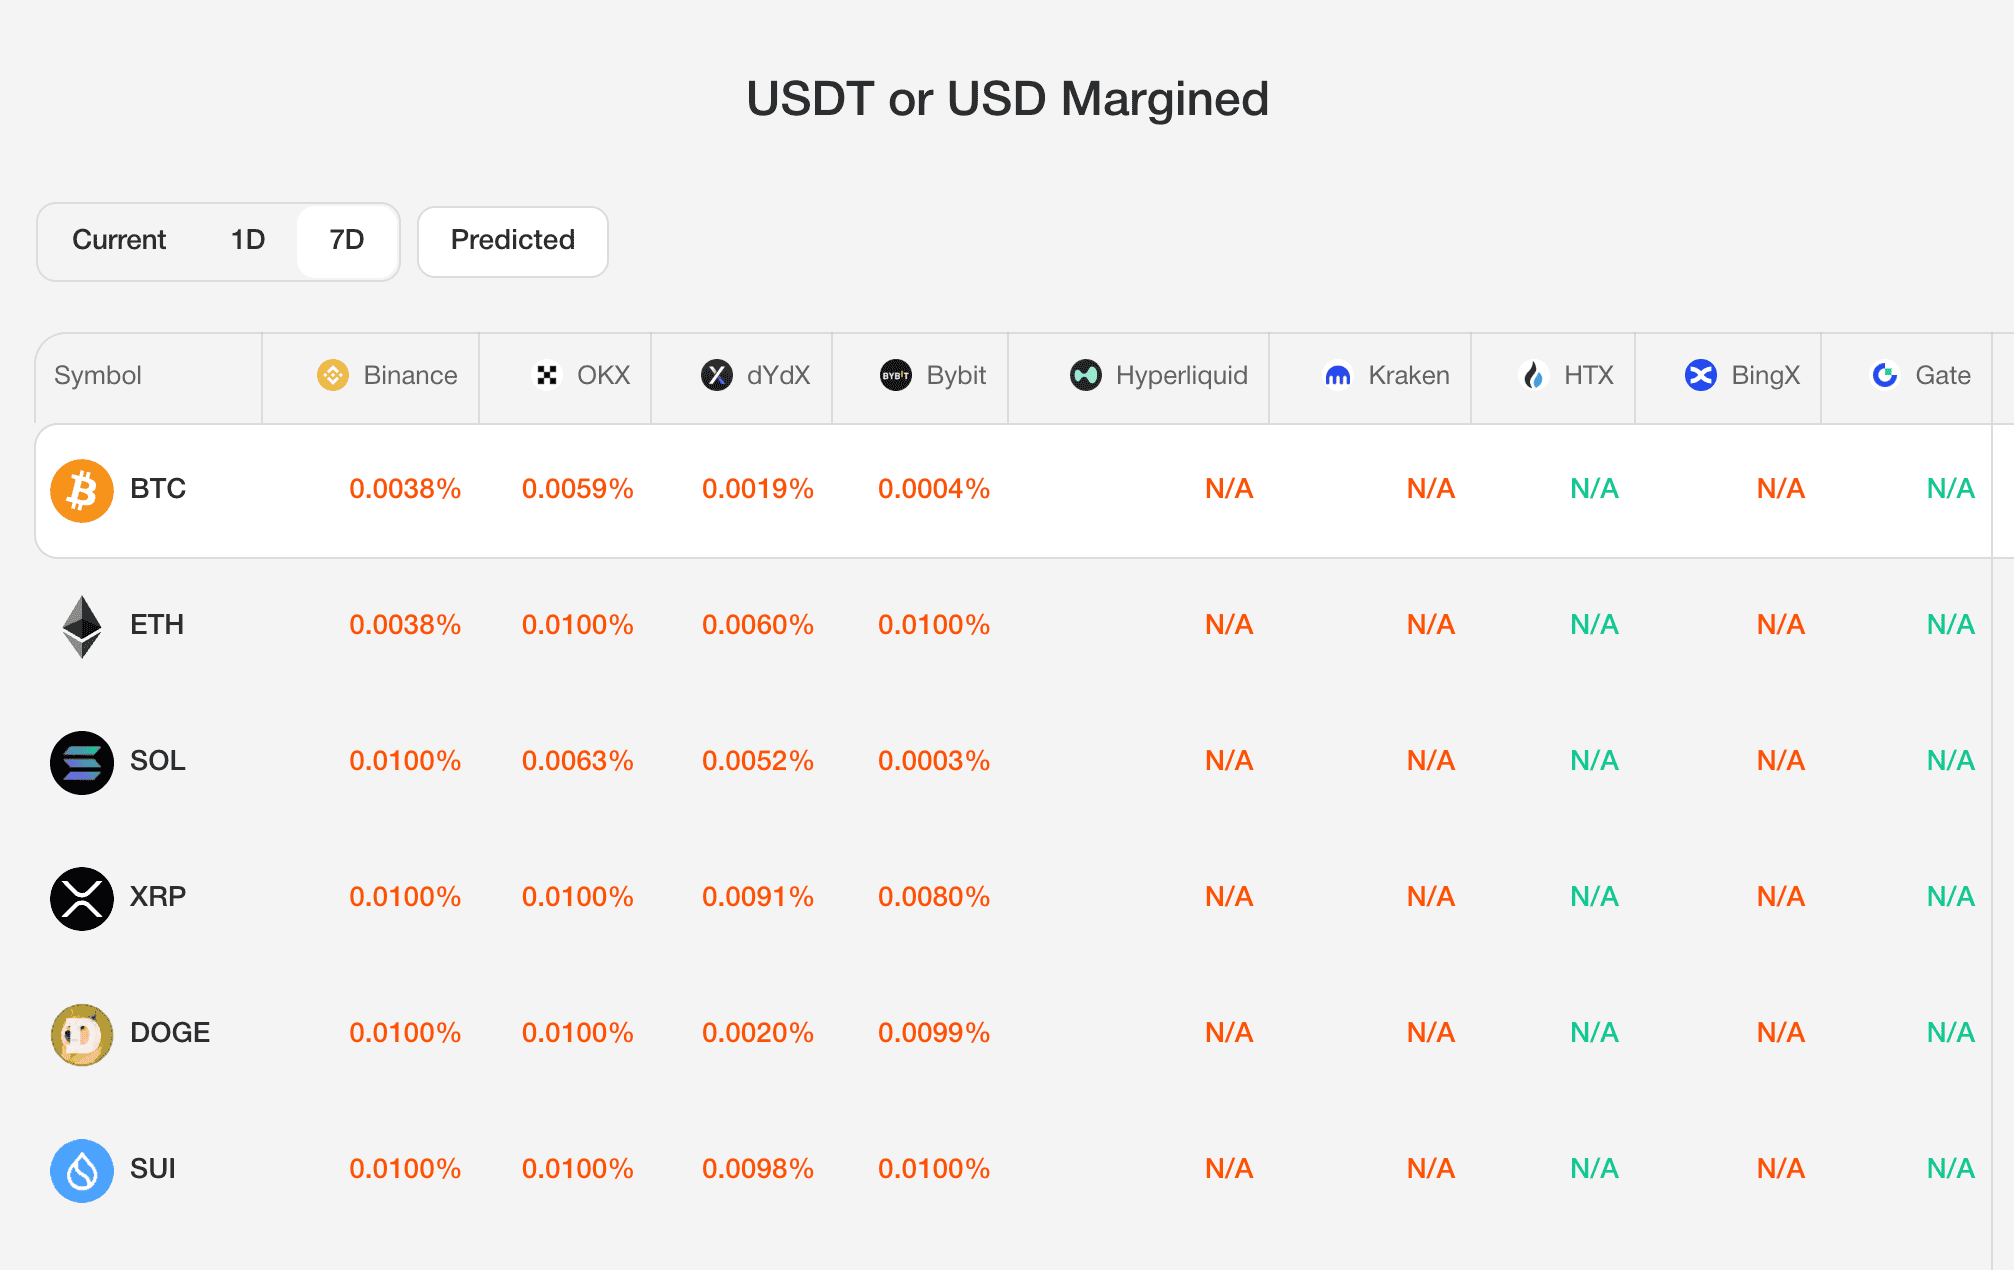
On the flip side, spiking liquidation clusters (visible around key levels) show where leverage is overstacked, and where violent moves can trigger cascade sell-offs. Think March 2020 or May 2022.
Tracking these patterns across perpetual futures exchanges can help front-run local tops and bottoms, especially in sideways markets.
Did you know?
Perpetual futures don’t expire, so they rely on funding rates to stay close to spot prices.
Here’s how it works:
If the funding rate is positive, long traders are paying shorts to hold positions, usually when sentiment is bullish.
If the funding rate turns negative, shorts are paying longs, meaning more traders are betting on downside.
Now here’s the catch in a bear market:
A deeply negative funding rate signals panic and overcrowded short positions.
If price doesn’t fall despite this, it’s often a sign the market has absorbed the fear, and may reverse.
Meanwhile, when too many traders pile into leverage, liquidation clusters form. One sharp move against them — even small — can trigger cascade liquidations, driving violent wicks. This happens more in bear markets when volatility spikes and order books are thin.
The bear market signs you thought mattered (but rarely do)
Some signs scream “bear market”… but don’t mean much. They’re noisy, late, or just plain irrelevant when real capital and builder activity already moved on. If you’re relying on these, you’re watching the rear-view mirror:
Price dips
Prices fall, and everyone yells bear market. Yet price volatility is just noise unless it’s backed by liquidity exits, user drop-offs, or volume drying up. In Jan 2022, Bitcoin dropped 25%… and then bounced back 40% before actually entering the bear phase in Q2. Price is a lagging indicator, not a signal.
ETF or regulation headlines
You’ll see panic over ETF rejections, lawsuits, or SEC FUD — but the market rarely responds how you’d expect. News flow ≠ market cycle. In June 2023, multiple ETH ETF delays were announced… yet ETH held steady. What mattered more? On-chain ETH staking continued rising.
Exchange volume drops
People see low exchange volume and assume disinterest. But in many bear phases, users move to DEXs or park stablecoins, not exit the market. Centralized exchange flows don’t always tell the full story, and in some cases, they’re distorted by market makers or spoof volume.
X sentiment
Crypto Twitter is a lagging echo chamber. When everyone’s bearish, we’re often closer to bottoming out than most think. In late 2022, “crypto is dead” was trending, right before BTC began its slow reversal from $15.5k.
Can you really spot a bear market before it hits?
If you’re watching the right signals, you certainly can. The best bear market signs aren’t dramatic. They’re slow drips in on-chain indicators, liquidity trends, and user exits that happen before the price reacts. Ignore the headlines. If you want to stay ahead of crypto market cycles, track what capital, builders, and users are doing, not just what they’re tweeting.
