

Blockchain, DApps, and smart contracts; are all, to varying extents, futuristic technologies with various applications. But what happens when these technologies need real-world data to work? This is when projects like Band Protocol, which supplements off-chain datasets to blockchain apps, come to the fore. This Band Protocol price prediction piece will consider the popularity of this decentralized project. How far can its native token, BAND, go in terms of its short-term and long-term price action? Let’s take a look, starting with fundamental analysis.
NOTE: This article contains out of date figures and information. It will be updated with fresh analysis for 2025 and beyond in the New Year. In the meantime, please see our Band Protocol Price Prediction tool for the most recent, data-informed projections.
- Band Protocol price prediction and the role of fundamental analysis
- Band Protocol tokenomics and the possible impact on prices
- Band Protocol and the market-related insights
- On-chain metrics and the impact on the price of Band Protocol
- Band Protocol price prediction using technical analysis
- Band Protocol (BAND) price prediction 2023
- Band Protocol (BAND) price prediction 2024
- Band Protocol (BAND) price prediction 2025
- Band Protocol (BAND) price prediction 2030
- Band Protocol (BAND’s) long-term price prediction until 2035
- Is the Band Protocol price prediction accurate?
- Frequently asked questions
Band Protocol price prediction and the role of fundamental analysis
Band Protocol is a cross-chain oracle platform. With this project, blockchains can access real-world data with ease. The data movement is managed by APIs that connect to blockchain-specific smart contracts and external oracles.
With the world shifting towards web3, oracle platforms like the Band Protocol have the potential to become the holy grail for blockchain apps.
Here are a few fundamental points about the Band Protocol that will be of use if making an investment-specific call:
- It aims to scale blockchains by making data available with close-to-zero latency.
- It was originally built on the Ethereum blockchain but later migrated to its own chain (BandChain) on the Cosmos network.
- Weather, sports, and other real-world dependent DApps can be built easily with Band Protocol supplementing real-world data.
- Oracle nodes offer more than real-world data. They also help validate blocks using the delegated proof-of-stake consensus.
- BAND — the native cryptocurrency of this Oracle network — works as collateral for the nodes. It is also a means of transaction and payment for users needing data.
- BAND tokens also support staking.
Band Protocol looks like an innovative Oracle solution. Its future prices will depend on which project — Band Protocol or Chainlink — serves more data-specific requests.
Band Protocol tokenomics and the possible impact on prices
Did you know? The native BAND token is both an ERC-20 token and a mainnet token. It is meant for staking for validation, on-chain governance, and usage as transaction fees.
Also, the max supply cap for BAND is set as infinite, whereas the total supply, as of Feb 2024, stands at almost 144 million. We expect the circulating supply to equal the same by 2025. Plus, the Band Protocol raised funds for the project by offering 27.37% of its total supply as part of three sale rounds.
The supply breakdown looks like this:
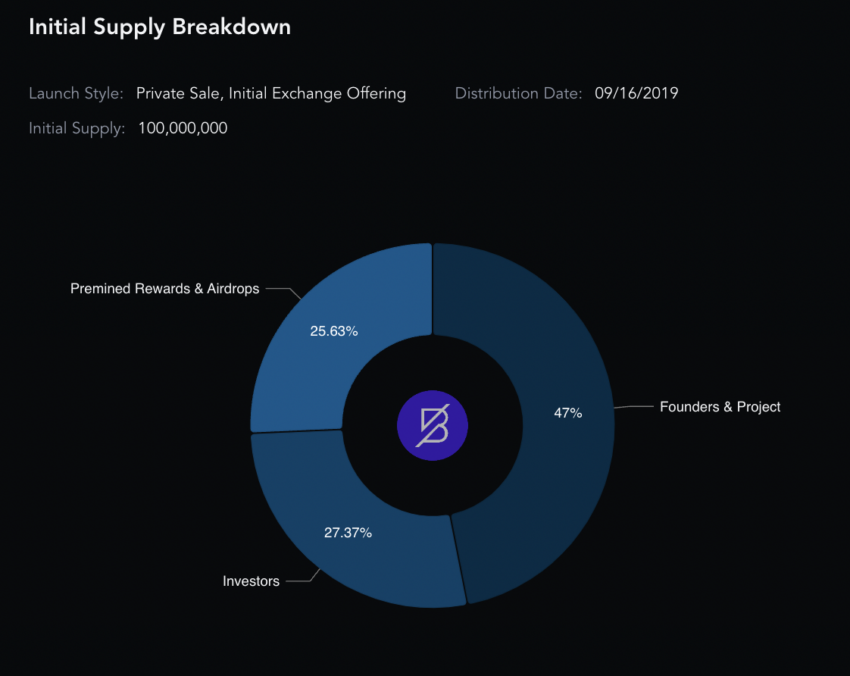
The token model is inflationary, with the issuance rate ranging between 7% and 20%. However, half of all the transaction fees relevant to the mainnet are burned, which controls the demand-supply curve.
We might see a steeper surge in BAND prices once the entire supply becomes liquid in 2025.
Band Protocol and the market-related insights
Now, we can shift our attention to the market cap and trading volume of BAND, both at its peak and levels identified during the early part of 2023.
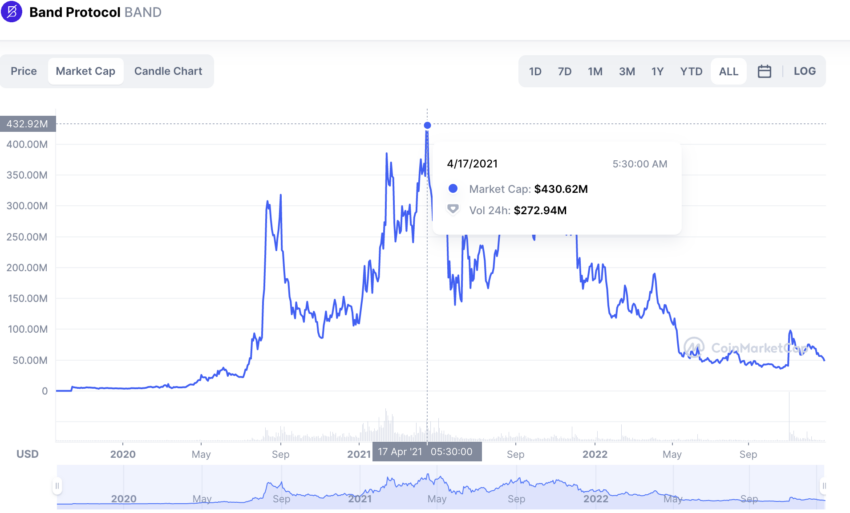
At its peak — on April 17, 2021 — BAND had a market cap of $430.62 million and a trading volume of $272.94 million. That translates into a turn-over ratio of 0.63.
As of Dec. 28, 2022, the trading volume is $14.81 million, and the market cap is $48.25 million. The turnover ratio using these values comes to be 0.30. Hence, BAND is currently more volatile than at its peak levels. This is why any digital asset must have trading volumes.
Regarding the trading volume, the spot market spread of BAND is pretty decent, as identified in late 2022. Most popular exchanges have BAND listed. However, Binance’s BAND-USDT and the BAND-BUSD pairs dominate most of the trading volume and liquidity.
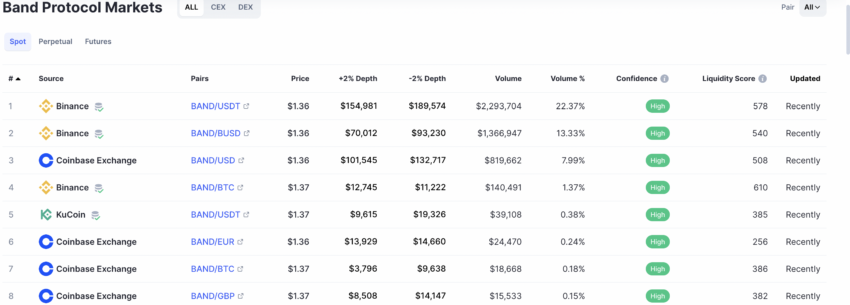
Even in 2024, Binance’s BAND-USDT pair enjoys exceptional liquidity at 37.16%.
BAND is extremely tradable despite the drop in market cap and trading volume. Therefore, investor interest hasn’t dropped much in comparison.
On-chain metrics and the impact on the price of Band Protocol
If you look at the transaction volume of BAND from 2022, there is a noticeable peak in early November. This might mean an increase in demand for real-world data. And if the peaking transaction volumes persist, we might also see the BAND price looking up. And that is exactly what happened with BAND crossing the $2 mark in 2023, easily.
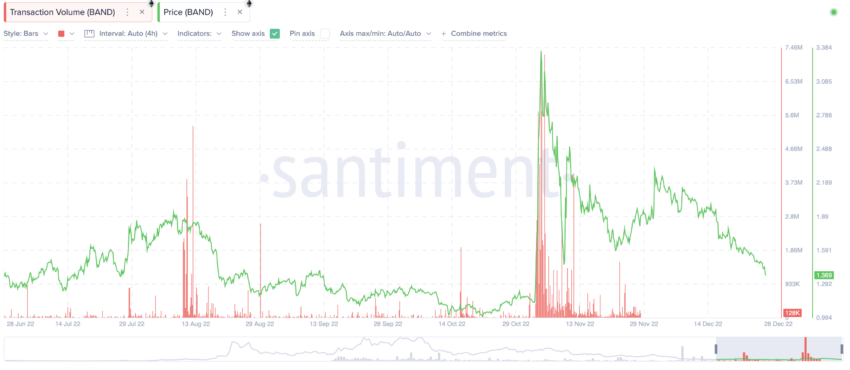
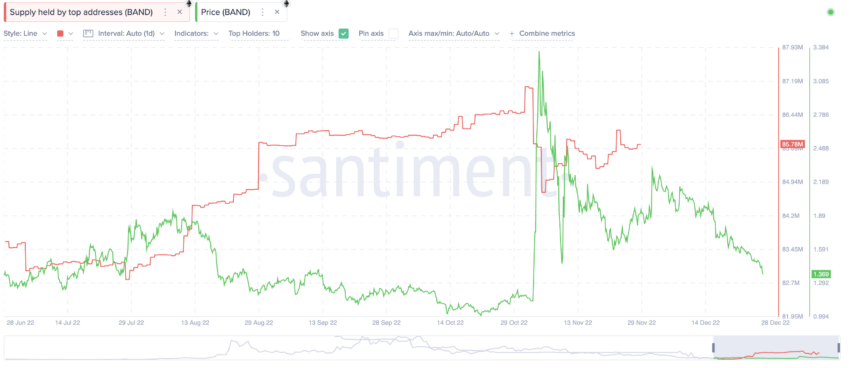
Another positive movement occurred in November 2033 when the supply (held by top BAND addresses) dropped. A price rally followed. But following this, prices have returned to usual. In the future, if smaller addresses start holding BAND, we might see a trend shift, even in regard to prices.
Again, the daily active addresses peaked in early November, resulting in a price surge. However, in December 2022, daily address additions stayed low yet steady.
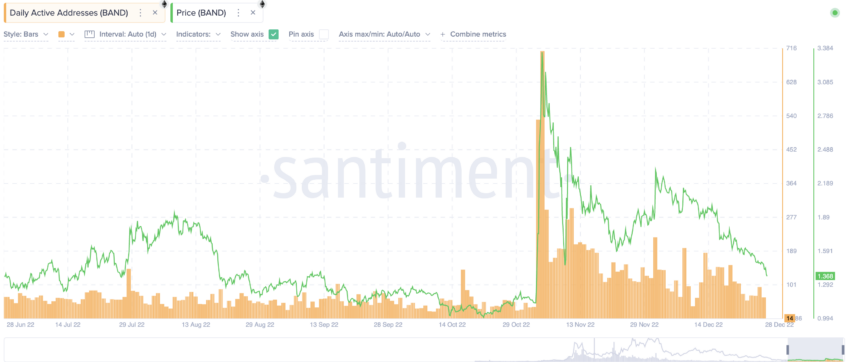
We know the metrics triggered a BAND rally. However, keeping a track of them might still be relevant in 2024.
Band Protocol price prediction using technical analysis
Before we begin the technical analysis, here is a daily chart that shows a BAND forming a “Head and Shoulders” pattern.
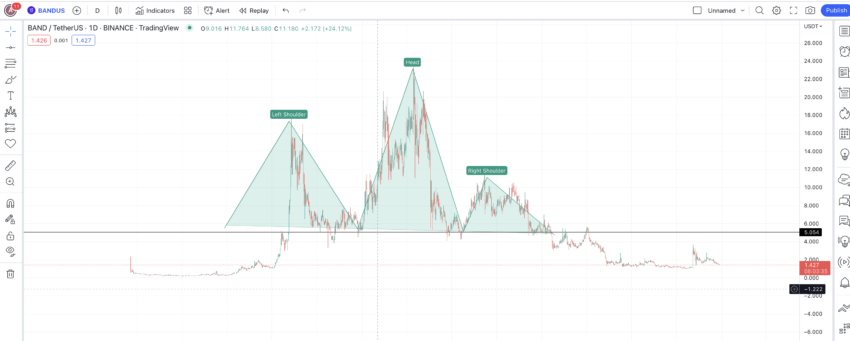
Do note that the price of BAND tokens dropped immediately after the pattern concluded. Since the downtrend, BAND has been trading in a range.
Also, here are some of the other insights about BAND that you might find useful:
- The maximum price of a BAND token was $23.19 on April 15, 2021.
- BAND’s all-time low surfaced on Nov. 25, 2019, at $0.2042.
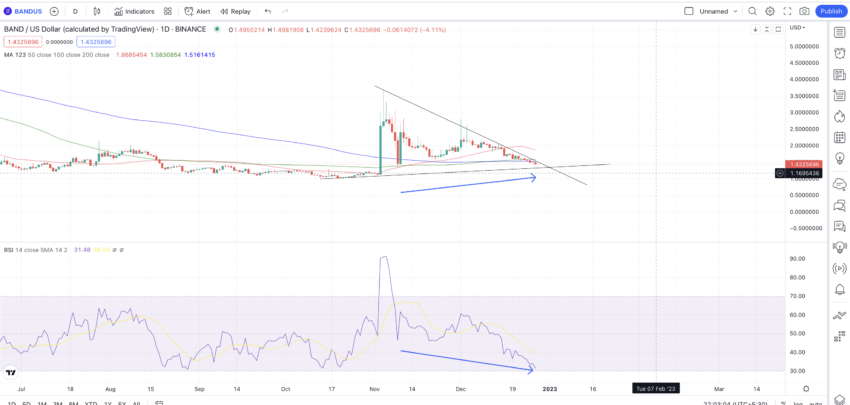
- The short-term price analysis paints a weaker picture. BAND is trading inside a pennant pattern, waiting to break out in either direction.
- The RSI shows a bearish divergence, making lower lows, while the price chart shows higher lows.
- And the 200-day simple moving average line (Blue) just crossed above the 100-day moving average line (Green). This hints at a death crossover and some near-term correction.
Now, let us look at the broader chart and analyze whether there is a clear pattern.
Pattern identification
Here is the weekly chart.
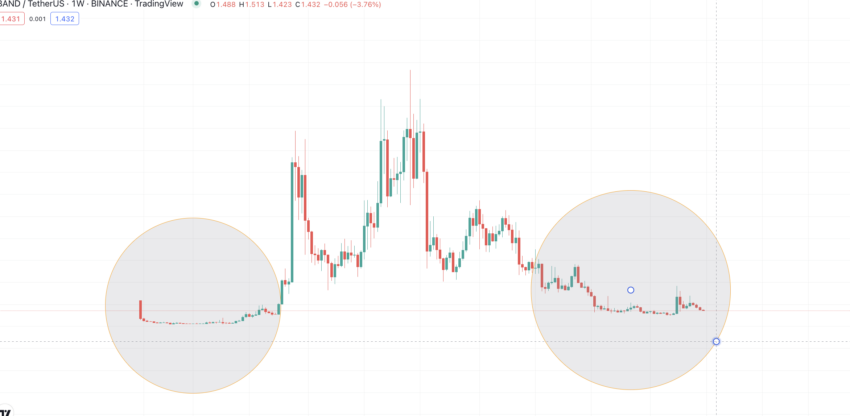
Notice that the two encircled zones look similar in terms of movement. This shows that BAND’s weekly chart might just be trading in a mirror-like pattern. Now we can divide the chart into Pattern 1 and Pattern 2.
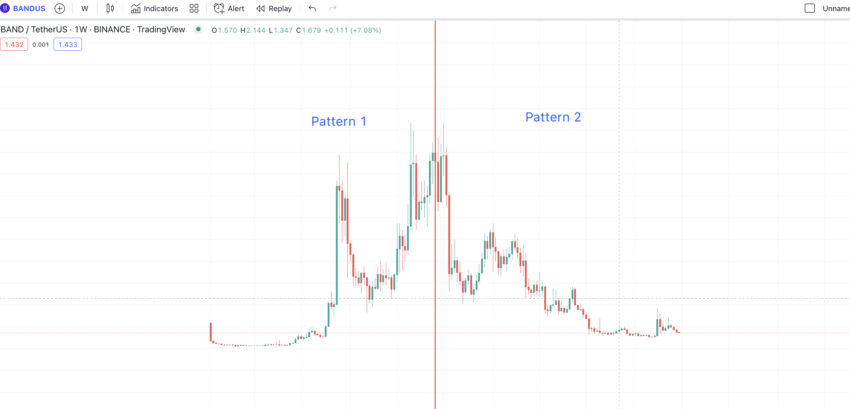
If BAND’s price chart follows the concept of foldback, by the end of Pattern 2, Pattern 1 has a chance of being repeated.
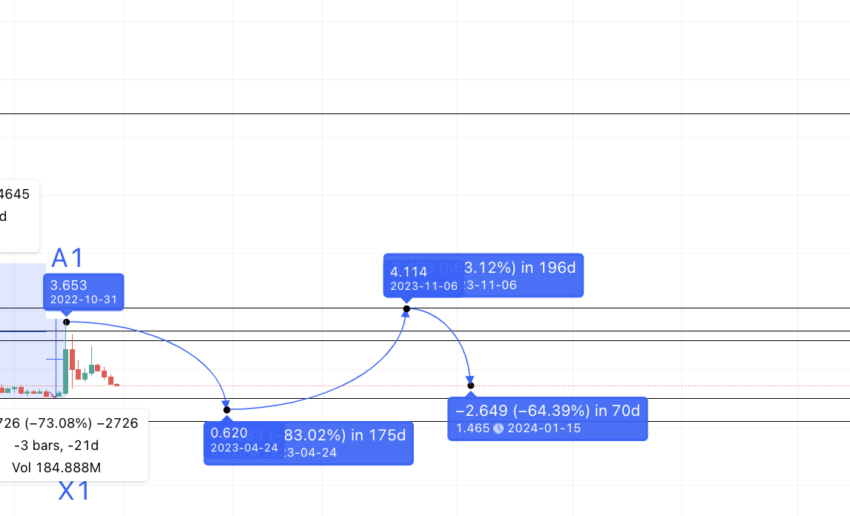
Now let us find the distance and price change percentage between all the higher highs in pattern one and swing highs (lower highs) in Pattern 2.
Price change
Our task is to find the next A or A2, which will be at the start of the new pattern.
Let us now plot the distance from A to D and A1 to D, going through all the lows:
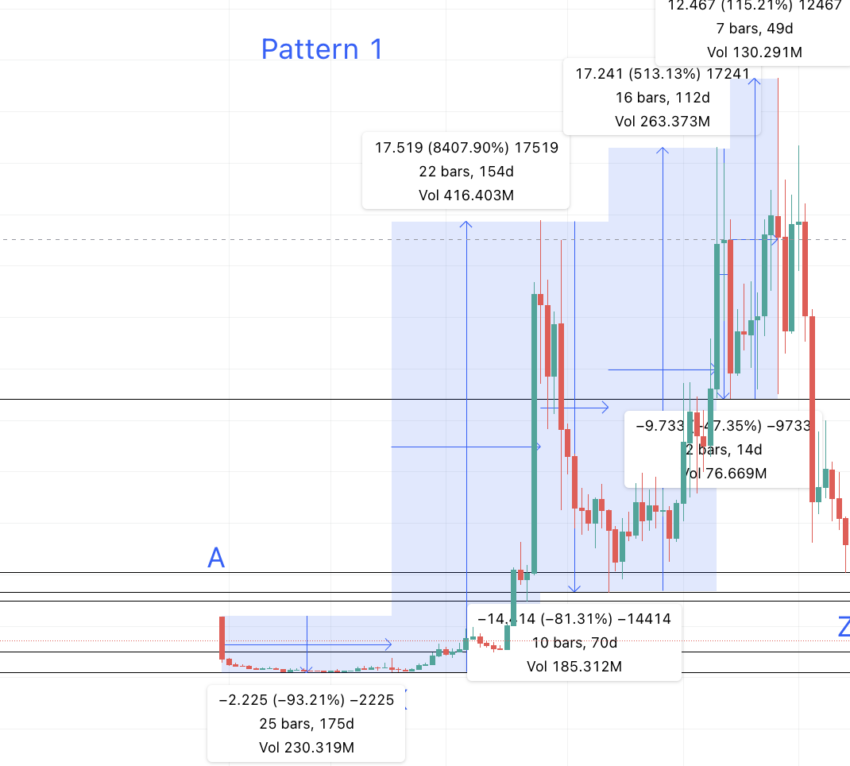
Pattern 1: (data set 1)
A to X = 175 days and -93.21% change; X to B = 154 days and 8407% change; B to Y = 70 days and -81.31% change; Y to C = 112 days and 513.13% change; C to Z = 14 days and -47.35% change; Z to D = 49 days and 115.21% change
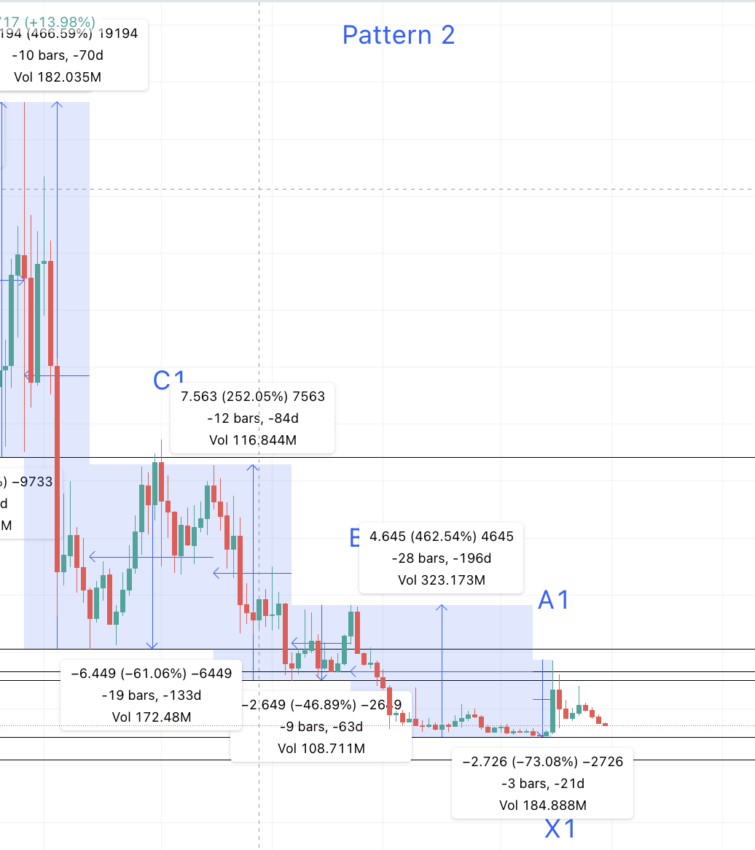
Pattern 2: (data set 2)
A1 to X1 = 21 days and -73.08% change; X1 to B1 = 196 days and 462.54% change; B1 to Y1 = 63 days and -46.89% change; Y1 to C1 = 84 days and 252.05% change; C1 to Z1 = 133 days and =61.06% change; Z1 to D1 = 70 days and 513.13% change
Now, if we take the average of the respective points across the patterns, we can first find the new low, X2, after A1. (assuming it’s a new pattern and A1 and A2 as the same points).
So, X2 comes at an average distance of 98 days (175 days max) from A1 and at a low of 83.4%. The forecast line puts that at $0.620. We can mark this point as X2.
Now, the next high could be at B1. While the max distance can be 196 days, using the information from data set 1 and data set 2, we cannot expect an 8407% or 462.54% gain in a bear market.
Therefore, we can project the price to the nearest resistance line or $4.10, which still puts B2 higher than A1 (A2).
Band Protocol (BAND) price prediction 2023
We expected BAND to cross $4 by the end of 2023. However, it could only move halfway, courtesy of bearish waves across the crypto space. Here is how our analysis went.
The previous forecast puts the Band Protocol price prediction for 2023 high at $4.10. The low can surface anytime between 60 to 70 days, using the average of the B to Y and B1 to Y1 data. The average percentage drop, in that case, comes to 64.1%.
The forecast line from the high of 2023 puts the low at $1.465, but in 2024. Hence, the minimum price of BAND in 2023 stays at $0.620. This might surface soon as a near-term bearish trend looks imminent.
Band Protocol (BAND) price prediction 2024
Outlook: Bullish
Notably, the price of BAND looks robust enough in 2024, which means that the expected BAND price prediction 2023 level could hold true even this year. Hence, in 2024, we are expecting BAND to go as high as $4.10. The low shouldn’t fall below $1.5, as was expected in 2023.
However, if we are to be more aggressive with the predictions, here is what can happen.
The low in 2024 might surface at $1.465. And if we follow the pattern, this point comes immediately after B2 and is termed Y2. Now, the next high, as per the old pattern, should be at C2.
Data from data set 1 and data set 2 places the Y to C movement in 112 days (max) and at a minimum of 252.05% peak. Plotting the same from the 2024 low puts the same at $5.150. The next low uses the average of C to Z from the tables above.
Projected ROI from the current level: 134%
Band Protocol (BAND) price prediction 2025
Outlook: Bullish
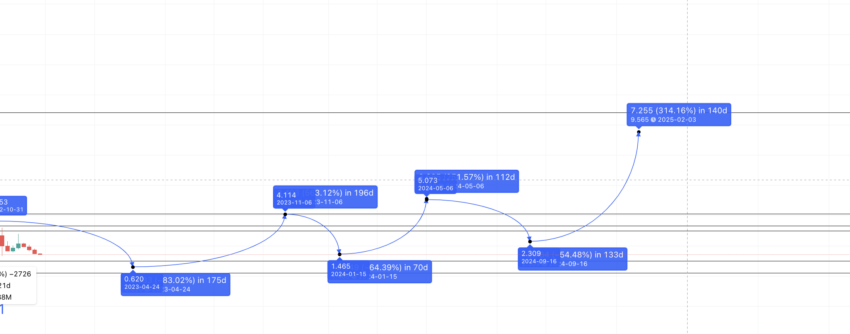
The 2024 high comes in a maximum timeframe of 133 days, with an average drop of 54.21%. The forecast line puts the same at $2.309. We can mark this as Z2. Finally, the next high or the peak of this cycle comes at D. Also, the previous Z to D data sets reveal a maximum timeline of 70 days, which might vary, and a minimum percentage gain of 115.21%. However, now that BAND looks to be in an uptrend, we can use the average percentage increase.
That comes to 314.17%. The forecast line puts the same at $9.56.
Do note that we have placed this point in 2025. After the bear market, a 300% move might take more than 70 days.
Projected ROI from the current level: 334%
Band Protocol (BAND) price prediction 2030
Outlook: Bullish
Now that we have the 2025 high, and the last low in 2024, we can connect the two and draw the Fib levels for better extrapolation.
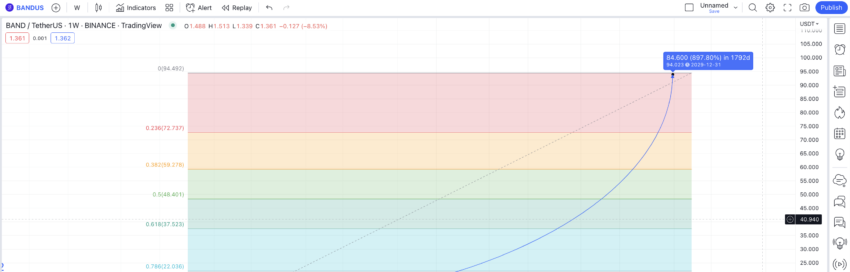
The Fib extension points place the BAND price prediction for 2030 at $94.023. BAND should cross the $37 mark for these Fib levels to hold by mid-2028. Also, the low in 2030 can be at $53.20, coinciding with the 61.8% of the Fib retracement when drawn from 2030 to 2025.
Projected ROI from the current level: 2318%
Band Protocol (BAND’s) long-term price prediction until 2035
Outlook: Bullish
You can easily convert your BAND to USD
Now we have visibility on the Band Protocol price till 2030, here is a table that helps us trace the same till 2035:
| Year | Maximum price of BAND | Minimum price of BAND |
| 2024 | $5.150 | $1.465 |
| 2025 | $9.56 | $3.06 |
| 2026 | $14.34 | $8.89 |
| 2027 | $21.51 | $13.33 |
| 2028 | $37.20 | $29.016 |
| 2029 | $63.24 | $39.20 |
| 2030 | $94.023 | $53.20 |
| 2031 | $141.03 | $87.43 |
| 2032 | $176.29 | $137.50 |
| 2033 | $220.26 | $171.80 |
| 2034 | $330.54 | $257.82 |
| 2035 | $429.71 | $335.17 |
Do note that the Band Protocol price prediction values might vary. This could depend on adoption, sentimental drivers, and the popularity of other real-world data providers like Chainlink. Therefore, the technical analysis might require updates, which we will bring to you as and when needed.
Is the Band Protocol price prediction accurate?
This Band Protocol price prediction considers detailed technical analysis but doesn’t rely on this. Instead, this price prediction model uses project fundamentals, on-chain data, and other factors like market cap, trading volume, and trading markets. Therefore, this Band Protocol price prediction piece is as detailed, accurate, and realistic as possible.
Frequently asked questions
How much will Band Protocol be worth?
Is band protocol on Ethereum?
Is Band better than Chainlink?
Disclaimer
In line with the Trust Project guidelines, the educational content on this website is offered in good faith and for general information purposes only. BeInCrypto prioritizes providing high-quality information, taking the time to research and create informative content for readers. While partners may reward the company with commissions for placements in articles, these commissions do not influence the unbiased, honest, and helpful content creation process. Any action taken by the reader based on this information is strictly at their own risk. Please note that our Terms and Conditions, Privacy Policy, and Disclaimers have been updated.


