

Amp, as a crypto project, tries to solve a genuine problem. It offers verifiable collateralization instantly, allowing chains to recognize value transfers immediately. Simply put, Amp helps you generate a collateral receipt that is credible and recognized across chains. But is the Amp token, AMP, a good investment? To find out, this AMP price prediction model embarks on detailed technical analysis and considers network and social growth and financial and on-chain metrics.
KEY TAKEAWAYS
➤Amp enables instant verifiable collateralization, ensuring asset transfers across chains are secure and credible.
➤Projected AMP ROI by 2030 is 436%, with a potential high of $0.1729 due to adoption growth.
➤Flexa and Pantera Capital back Amp, with staking and ERC-20 compatibility boosting utility and scarcity.
- Amp (AMP’s) long-term price prediction until 2035
- AMP technical analysis
- Weekly chart and pattern identification
- Amp (AMP) price prediction 2024 (concluded)
- Amp (AMP) price prediction 2025
- Amp (AMP) price prediction 2030
- Amp fundamental analysis
- Tokenomics
- Is the AMP price prediction accurate?
- Frequently asked questions
Amp (AMP’s) long-term price prediction until 2035
Outlook: Bullish
We can always use the table to check for the prices till 2035. However, in any given year, the average price of AMP would depend on the crypto market conditions, trading volume levels, market cap, and even on-chain metrics. Therefore, every price point should be treated more like a ballpark than an absolute figure.
| Year | Maximum price of AMP | Minimum price of AMP |
| 2025 | $0.0206 | $0.01129 |
| 2026 | $0.0367 | $0.02275 |
| 2027 | $0.0477 | $0.02957 |
| 2028 | $0.0668 | $0.05210 |
| 2029 | $0.1211 | $0.0944 |
| 2030 | $0.1729 | $0.1211 |
| 2031 | $0.2593 | $0.161 |
| 2032 | $0.3371 | $0.2629 |
| 2033 | $0.4383 | $0.5127 |
| 2034 | $0.6574 | $0.5127 |
| 2035 | $0.8546 | $0.666 |
AMP technical analysis
Nothing beats using historical data and working on technical analysis using price charts. This approach will help locate price patterns, indicating future AMP price paths. We started tracking AMP’s weekly price pattern as early as January 2023, timing when the key patterns surfaced.
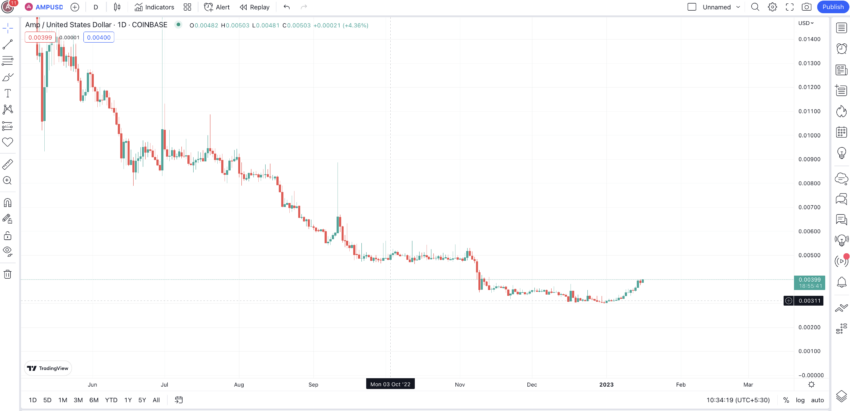
Our price predictions usually rely on weekly charts to look at long-term trends for any digital asset. However, we will use the daily chart for AMP and look at the short-term historical data first.
Weekly chart and pattern identification
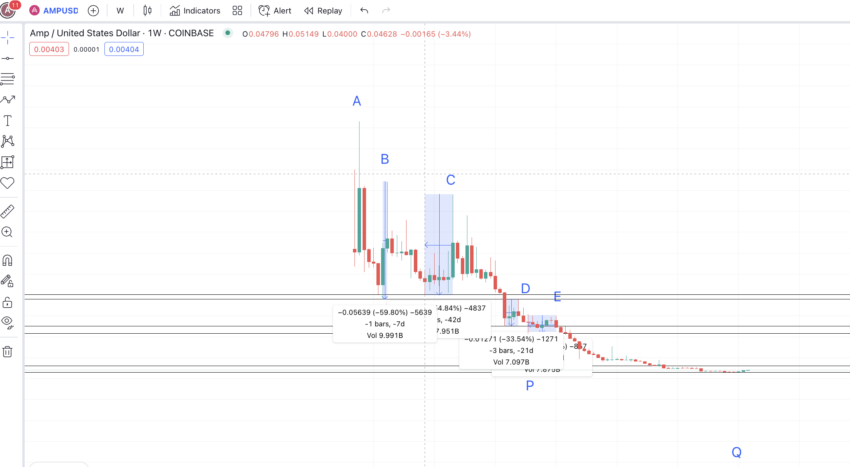
The daily chart of AMP shows considerable strength for it to reach $0.00618, a level that AMP continues to respect even in 2025. If the AMP price reaches this zone, we can consider it a high as per the weekly pattern.
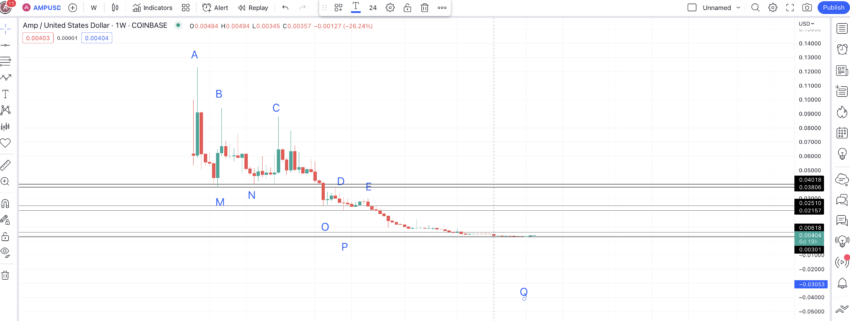
Therefore, we can clearly see the emerging pattern. The weekly chart of AMP starts with a high and makes a few lower highs before starting to trade in a range.
And if the high of $0.00618 is reached, we can consider this as a high, which could kickstart the old pattern in reverse. Therefore, we can assume the weekly AMP chart makes a foldback pattern with the lower high formation to be repeated as a higher high formation.
This might be the formation we are looking at:
Price changes
Now let us mark all the important points on the weekly chart, highs and lows included, to find the next set of highs and lows for AMP.
As per the assumptions and bar pattern, we expect the price of AMP to follow the path from Q to A. Therefore, we should trace the price changes and distance between the points in reverse — from Q to E — including the low-to-high and high-to-low formations.
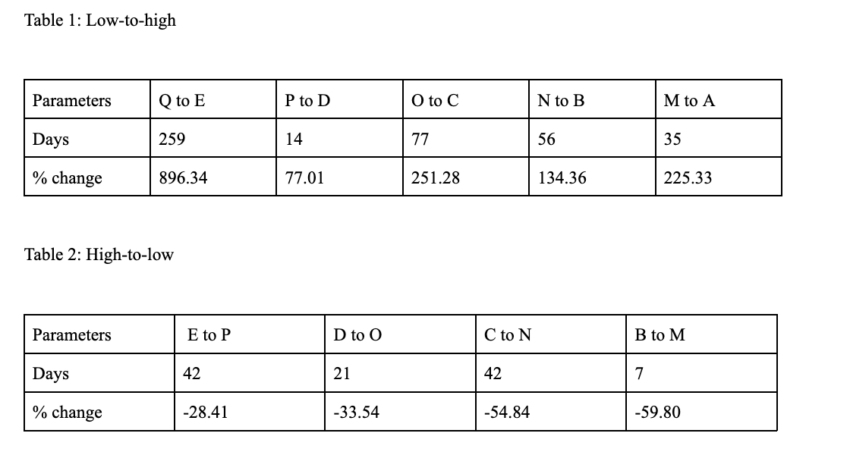
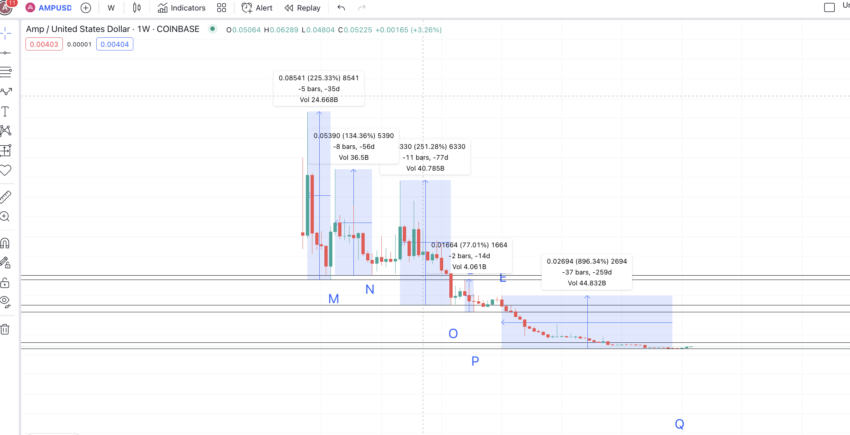
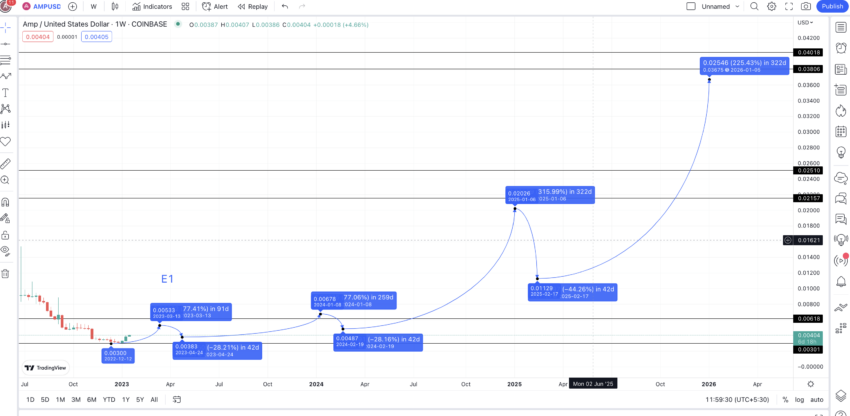
The low-to-high average price change percentage and distance are 316.86% and 88 days. For the sake of safety, we can take the maximum distance as 259 days and the minimum price increase percentage as 77.01% — data from Table 1.
The high-to-low average price change percentage and distance are 44.147% and 28 days. The maximum distance and the lowest price change percentage would be 42 days and 28.41%, respectively — data from Table 2.
Amp (AMP) price prediction 2024 (concluded)
From O1, a minimum percentage hike of 77.01% tried taking the maximum number of days — 259. This assumption put the 2024 high or D1 at $0.00678, which was reached.
Amp (AMP) price prediction 2025
Outlook: Bullish
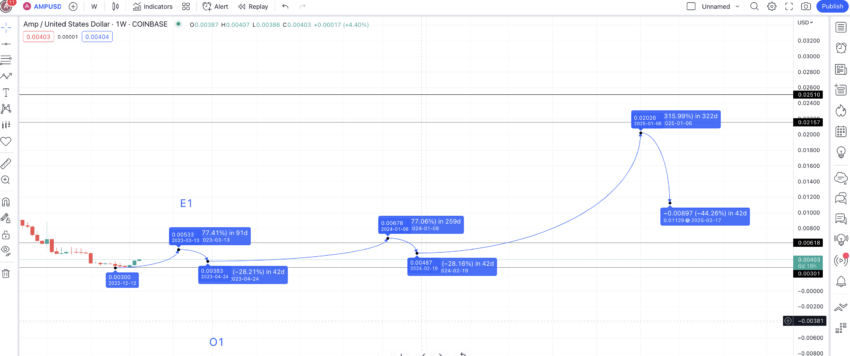
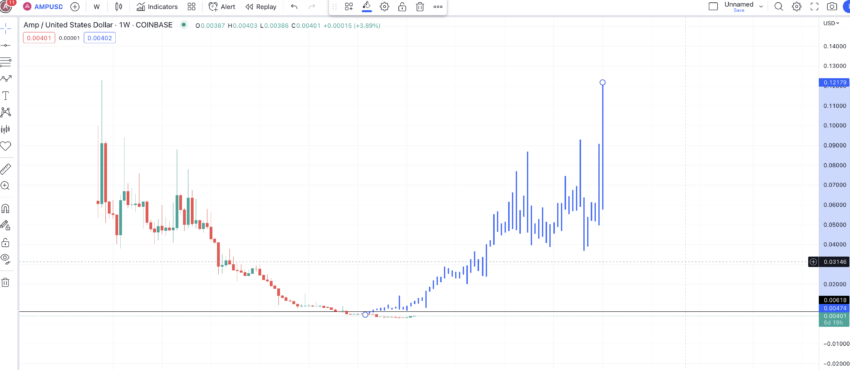
By mid-2025, we can see AMP forming higher highs and higher lows, finalizing the uptrend. Therefore, the next high could adhere to the average low-to-high formation peak of 316.86%. The timeframe could be higher than 259 days, depending on the current state of the crypto market. Overall, the 316.86% growth might as well appear by early 2025.
Therefore, the AMP price prediction for 2025 is high at $0.0206. The low price prediction for 2025 can also adhere to the average percentage drop of 44.147% — as there might be some profit booking post the 2025 highs. Therefore, the minimum price prediction for 2025 surfaces is $0.01129.
Projected ROI from the current level: 436%
Amp (AMP) price prediction 2030
Outlook: Bullish
After a rallying year of price gain, there is usually a cool-off year in sight. Therefore, for 2026, we expect AMP to increase by a minimum percentage of 225.23% — the second-lowest percentage spike from Table 1. Just like the price prediction for 2025, we can expect this price prediction level to surface in 2026 for the sake of better calculations.
This level surfaces at $0.0367, somewhere in early 2026. Now, if we use the Fibonacci indicator, with the 2026 high and 2025 low, we can project the path to 2030.
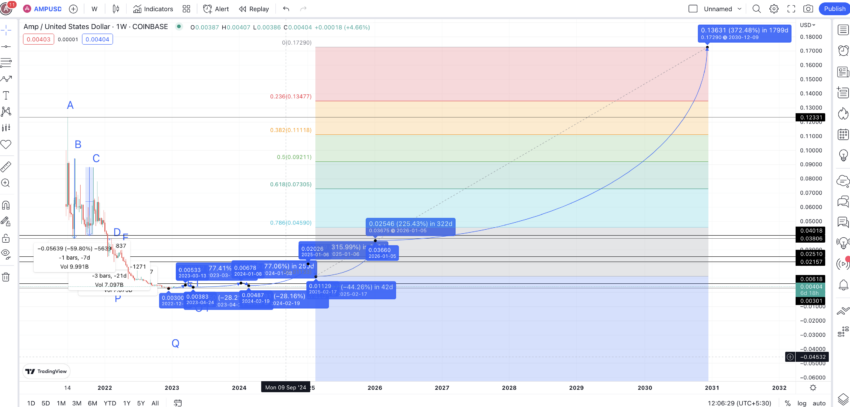
Assuming that the price of AMP keeps growing as per the forecast, we can expect it to go as high as $0.1729 by the end of 2030. However, for this, AMP may have to breach its previous all-time high price of $0.1211 by late 2029 or, at the latest, by mid-2030.
The previous all-time high could act as the support line for AMP if you are looking at the minimum price prediction level for 2030.
Amp fundamental analysis
Amp offers “Collateral-as-a-Service.” It does nothing fancy and promises nothing that’s far-reaching. Instead, by guaranteeing value, it helps you collateralize any asset exchange — fiat, crypto, property, and more. At present, users can collateralize the likes of DOGE, LINK, DAI, USDC, XTZ, BCH, and more using AMP — the native token of the Amp ecosystem.
Did you know? AMP was initially designed to work as a collateral token, for instant, verifiable assurances of value transfer.
But that’s not all you need to know about Amp.
- Flexa — a popular payments network — is already using Amp for loan collateralization via a “Capacity Contract.”
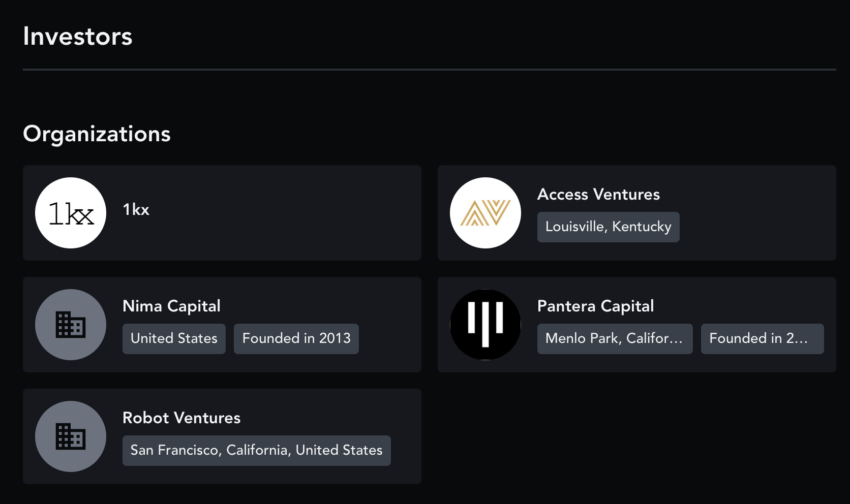
- Pantera Capital is one of the project’s lead investors.
- Users can stake AMP — the native token for lending assurance to the concerned projects.
- Once it grows, the AMP token can act as collateral for DeFi projects, payment networks, and individual requirements.
Tokenomics
As a user, you can deploy AMP for collateral verification via staking. The ERC-20 compatibility shows that it is built on Ethereum. The token comes with a supply cap of 100 billion.
The allocation only assigns 20% of the fixed supply to the token sales, which has been unlocked. Here is the supply curve that gives a fair idea about the allocation:
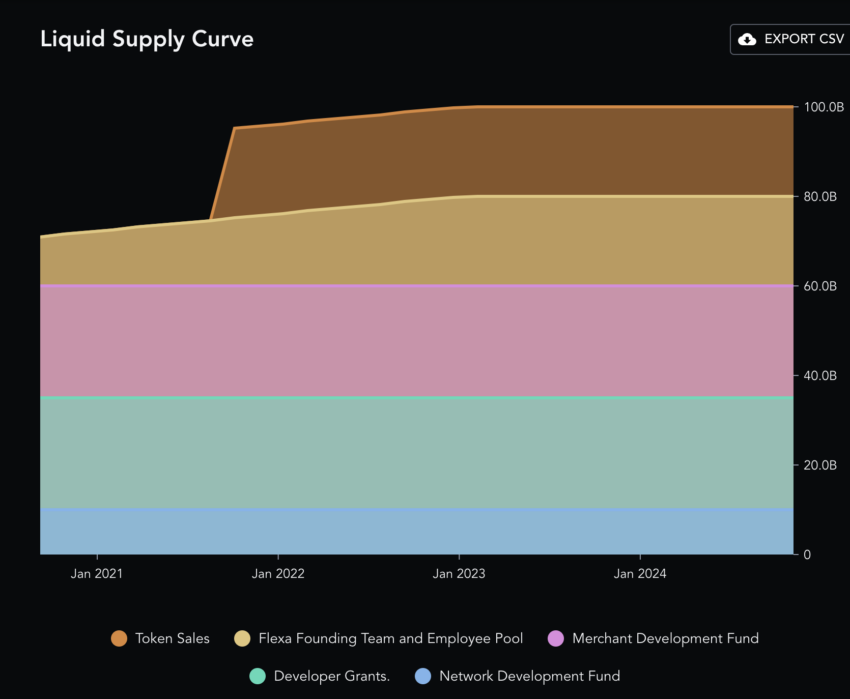
Also, with the overall supply being 100 billion, Amp’s only chance at scarcity would be rocketing network adoption. Once more people start using Amp, they will lock more AMP and help put a tab on the overall supply.
Is the AMP price prediction accurate?
This AMP price prediction model considers both long-term and short-term technical analysis. Plus, we have analyzed fundamentals and key on-chain and social metrics to draw projections. We do still urge potential investors to look closely at AMP’s market cap and trading volume at every given instant before making investment decisions. A spike or a dip in trading activity and market cap can have a surprising impact on the prices of digital assets, AMP included.
Disclaimer: This analysis pertains to AMP and is for informational purposes only. Cryptocurrency investments, including AMP, are volatile and involve risks. Always DYOR and consult a financial advisor before investing.
Frequently asked questions
What will AMP be worth in 2025?
Does Amp crypto have a future?
Can an AMP reach 1 dollar?
How high can AMP coin go?
Who owns AMP crypto?
Disclaimer
In line with the Trust Project guidelines, the educational content on this website is offered in good faith and for general information purposes only. BeInCrypto prioritizes providing high-quality information, taking the time to research and create informative content for readers. While partners may reward the company with commissions for placements in articles, these commissions do not influence the unbiased, honest, and helpful content creation process. Any action taken by the reader based on this information is strictly at their own risk. Please note that our Terms and Conditions, Privacy Policy, and Disclaimers have been updated.


