
KAITO’s recent airdrop surprised many, sparking initial excitement. However, the token is now struggling to maintain user interest—a common issue seen with other airdrops. The altcoin is down 7% in the last 24 hours, highlighting short-term selling pressure, but it remains up 60% since launch.
Currently, KAITO BBTrend is negative at -10.7, signaling persistent bearish momentum, while its ADX at 13.49 shows a lack of clear trend direction. With price movements fluctuating between potential support at $1.35 and resistance above $2, KAITO faces a critical moment to either consolidate gains or continue its downward correction.
KAITO BBTrend Is Stable, But Negative
KAITO BBTrend is currently at -10.7, reflecting a sharp reversal after reaching an all-time high of 10.8 just yesterday.
This dramatic decline marks a shift from strong bullish momentum to negative territory in less than 24 hours, indicating increasing selling pressure.
The rapid change suggests a bearish sentiment is taking over, as BBTrend turning negative often signals the start of a downtrend.
With KAITO BBTrend hovering around -10 and -11 for the last several hours, it highlights persistent weakness and a potential continuation of the bearish trend.
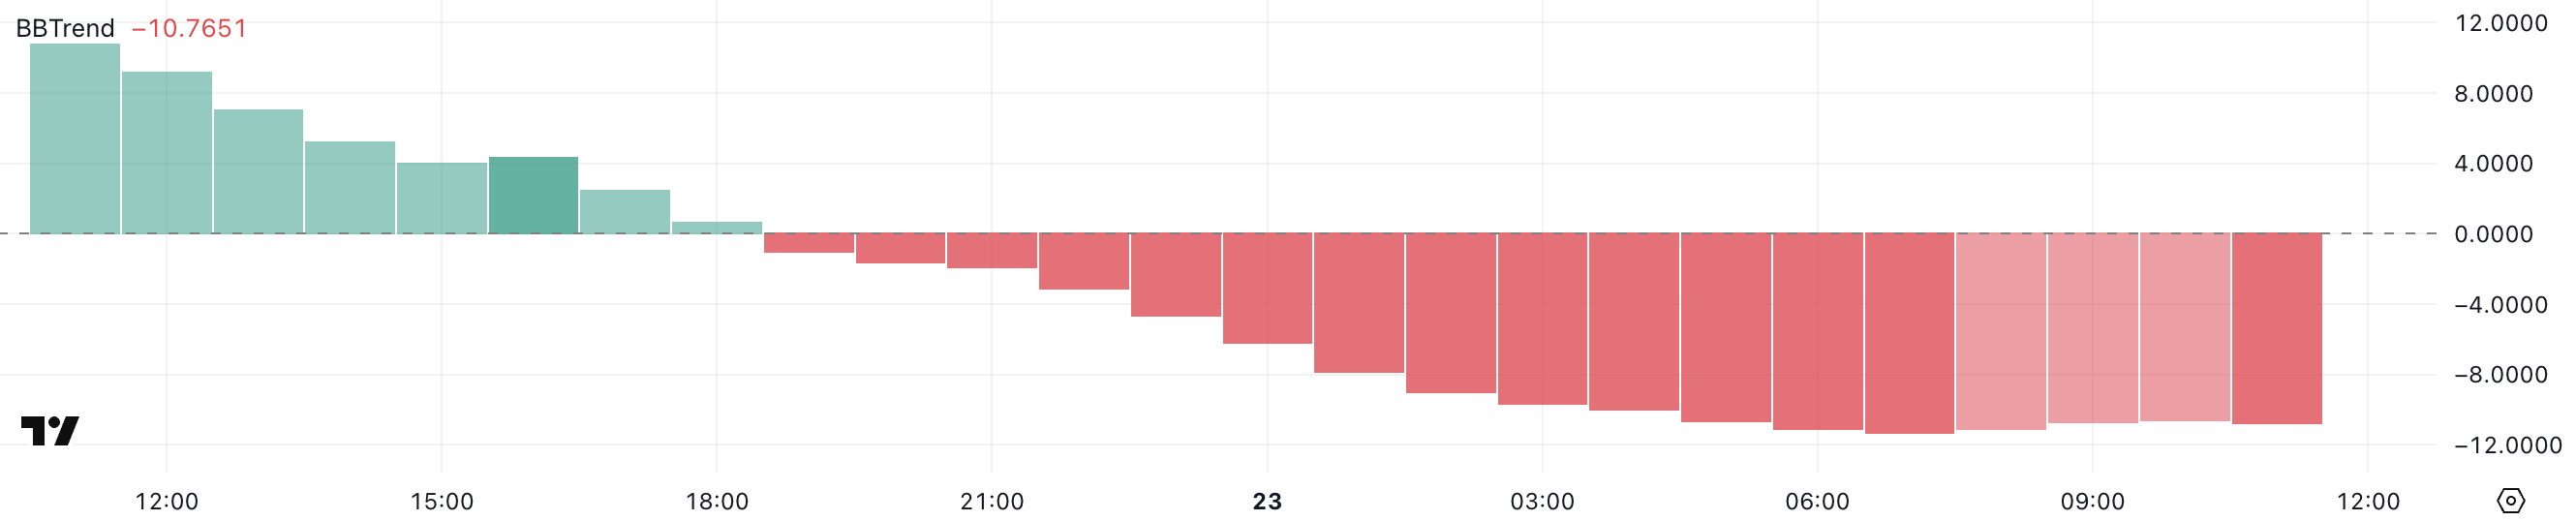
BBTrend, or Bollinger Band Trend, is an indicator used to measure market momentum and trend direction by analyzing the position and movement of prices within Bollinger Bands.
It fluctuates between positive and negative values, with positive readings indicating bullish momentum and negative readings signaling bearish momentum. With KAITO BBTrend currently at -10.7, the negative value suggests that selling pressure is dominant and downward momentum is likely to continue.
This bearish signal raises concerns about KAITO price stability, as the persistent negative trend could lead to further price declines if buying interest does not return to counter the selling pressure.
KAITO ADX Shows the Lack of Trend Direction
KAITO ADX is currently at 13.49, showing a sharp decline from 60 just two days ago and 45 yesterday. This rapid decrease indicates a significant loss of trend strength, suggesting that the previous momentum has faded.
ADX measures the strength of a trend regardless of its direction, and a drop of this magnitude points to weakening momentum and a potential shift to a neutral or undefined trend.
The current ADX level reflects a market lacking clear direction, which is consistent with the observation that KAITO’s EMA lines are very close to each other, indicating indecision among traders.
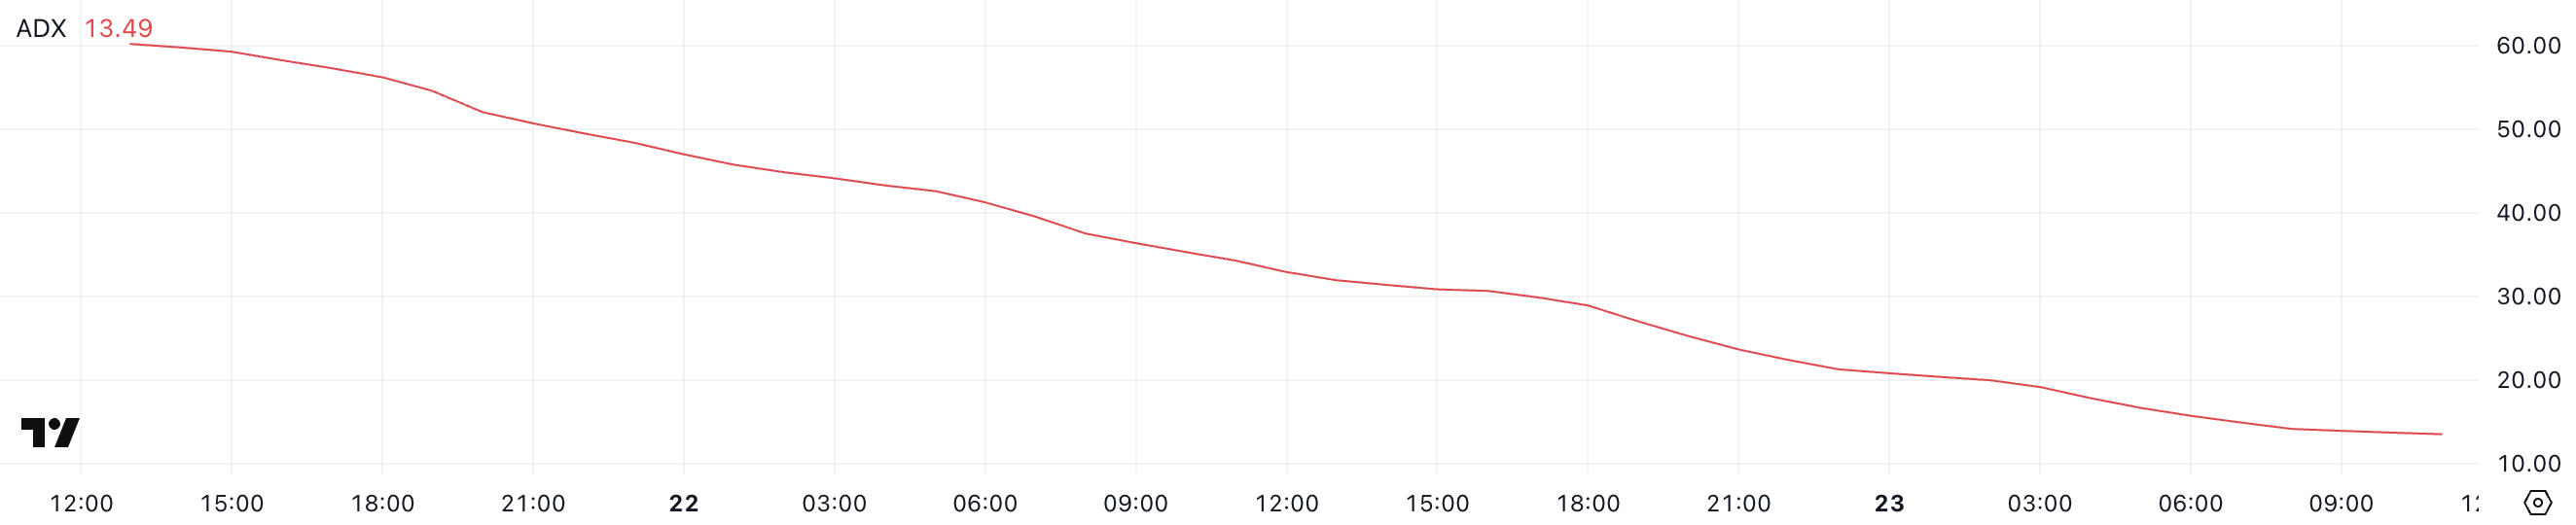
ADX, or Average Directional Index, is a technical indicator used to measure the strength of a trend rather than its direction. It ranges from 0 to 100, with values above 25 typically indicating a strong trend and values below 20 suggesting a weak or non-existent trend.
With KAITO ADX at 13.49, it signals that the current trend is extremely weak and lacks conviction. This low ADX value suggests that KAITO price movement may remain range-bound or choppy until a stronger trend emerges.
The absence of a clear trend direction, combined with closely aligned EMA lines, points to a period of consolidation or sideways trading for the altcoin.
Will KAITO Price Reach Levels Above $2 Soon?
KAITO reached an all-time high near $2 on February 21, but shortly after, it began to correct downward. This pullback suggests profit-taking or weakening buying pressure after hitting the peak.
If the correction continues, KAITO could test the support level at $1.35, a crucial point to maintain its bullish structure.
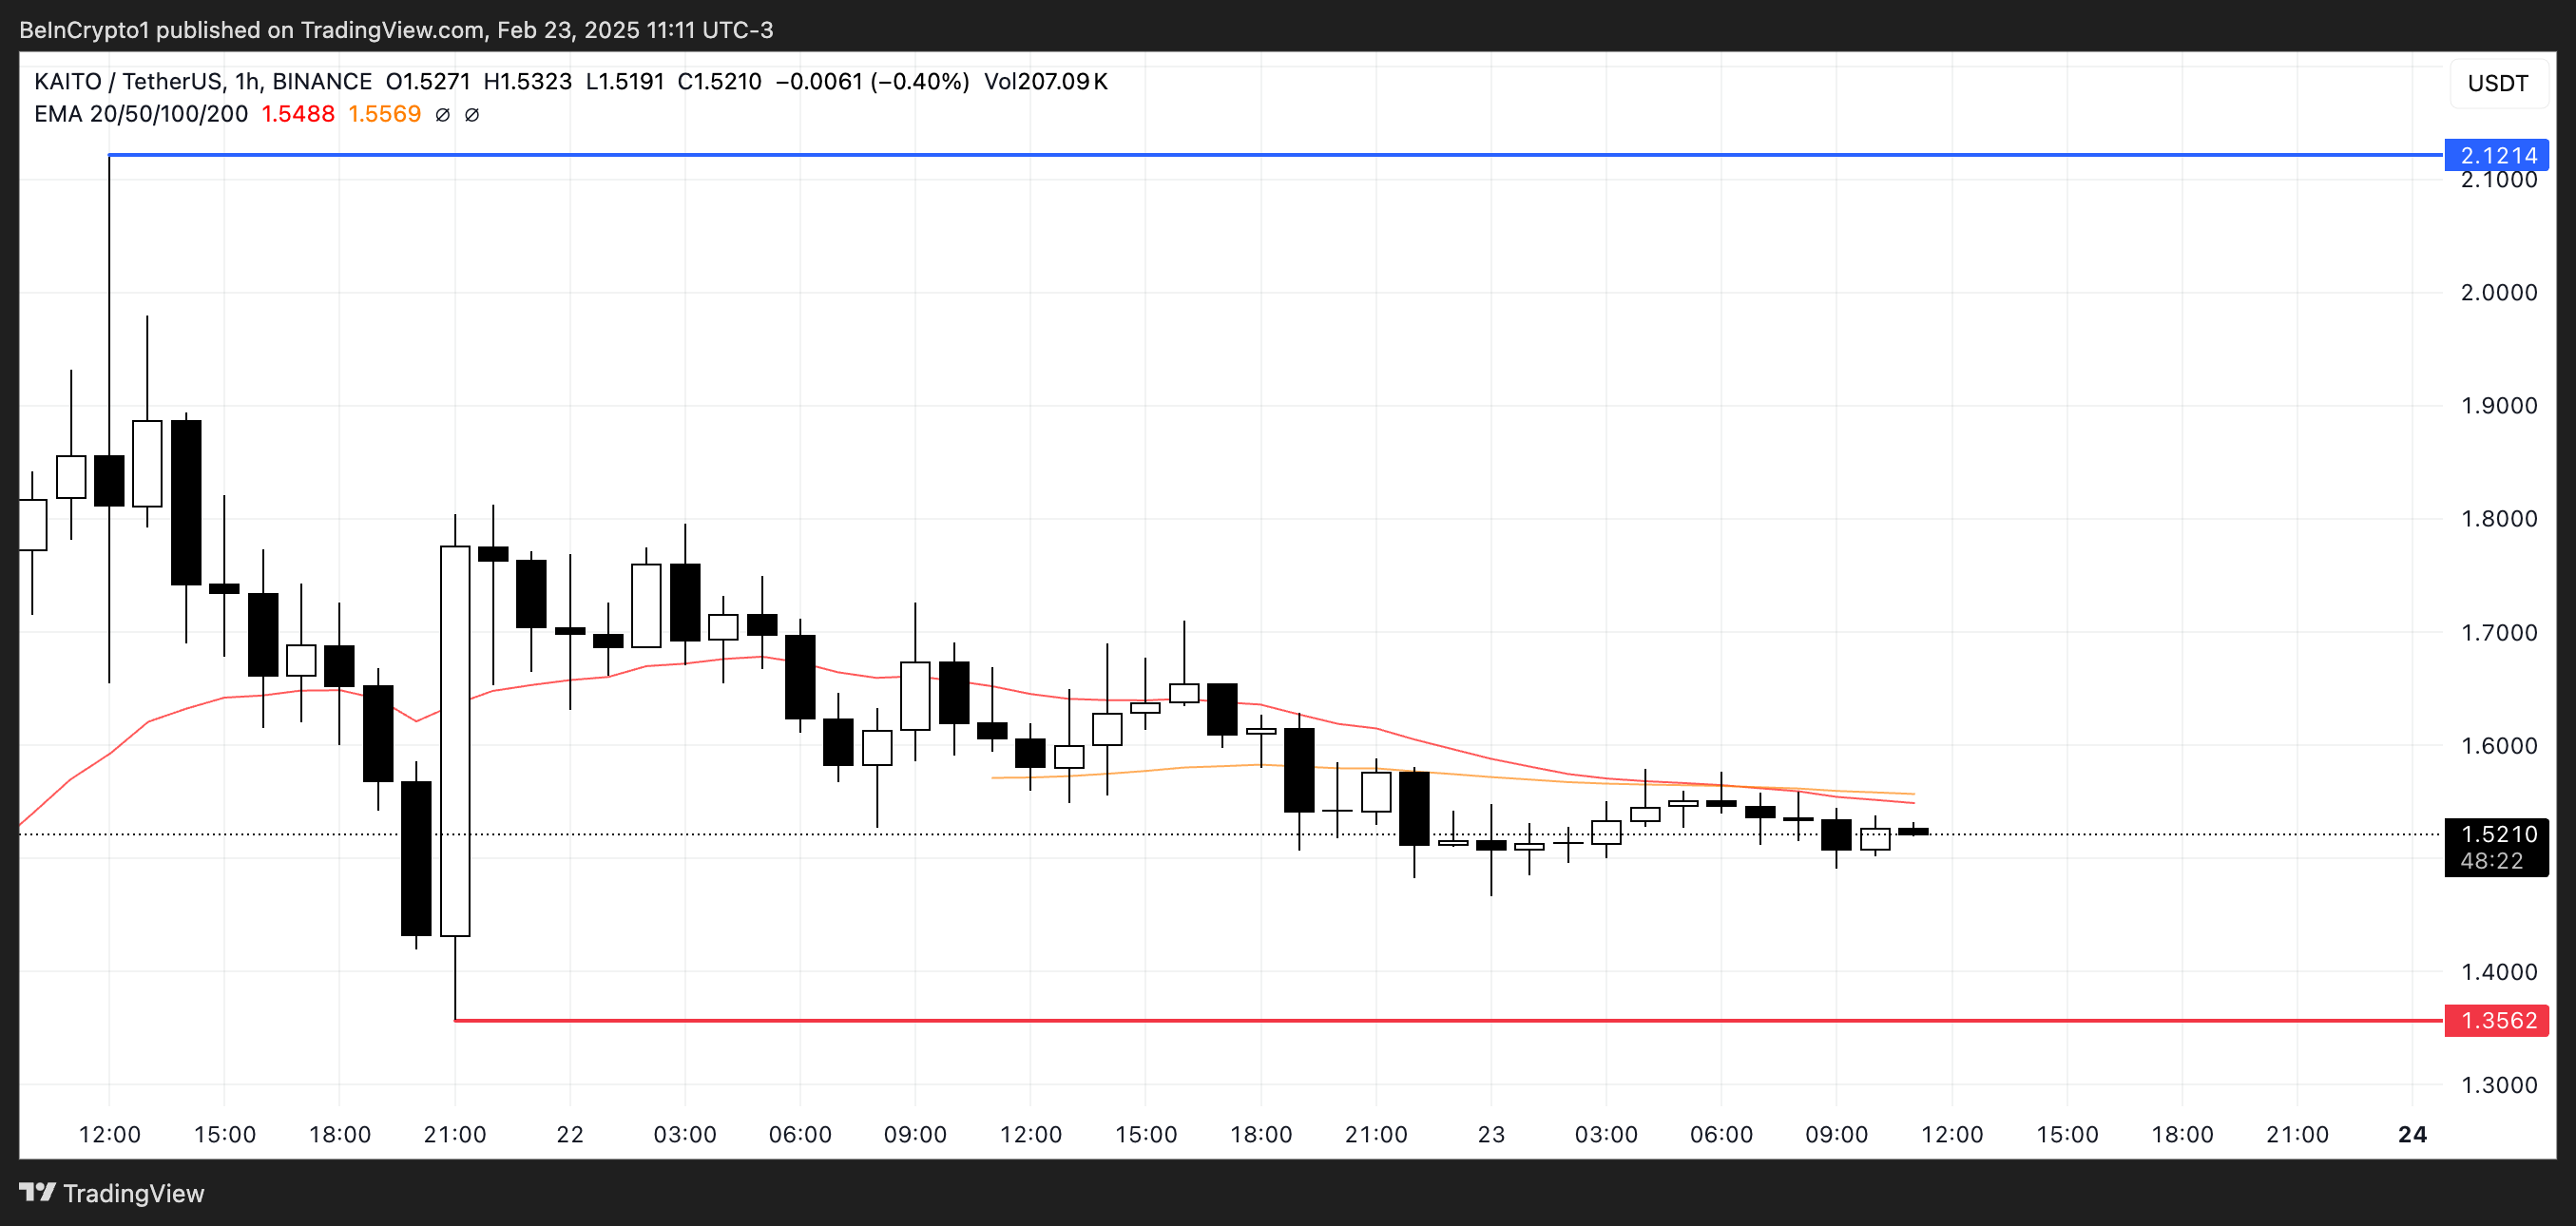
Should this support fail, KAITO could face a deeper decline, potentially dropping below $1.2 or even as low as $1.1, reflecting increased selling pressure and bearish sentiment.
However, if KAITO can establish a strong uptrend, it could reverse the current correction and surge above $2, challenging the resistance at $2.12. Successfully breaking this level could pave the way for a new all-time high, with the next target at $2.2.
