


The Litecoin (LTC) price has fallen since the middle of February but just broke out from a short-term bullish pattern.
The daily close could confirm the breakout, leading to an increase toward the long-term resistance area.
Litecoin Price Regains Footing After Drop
The technical analysis for the weekly time frame gives an undetermined reading for the price of LTC. This is due to conflicting signs from both the price history and the RSI reading.
On the bearish side, LTC created a double top, which is considered a bearish pattern (red icons). Moreover, the pattern was created inside the $100 resistance area, increasing its validity.
Furthermore, it was combined with a bearish divergence in the RSI (green line). This is a type of bearish reading in which a momentum increase does not support a price increase. It often leads to downward movements.
However, there are bullish readings in place, too. After the tops, the LTC price twice created long lower wicks (green icons). These are considered bullish signs since sellers could not push the price down.
Rather, buyers took over and caused the price to close significantly higher than the period low.
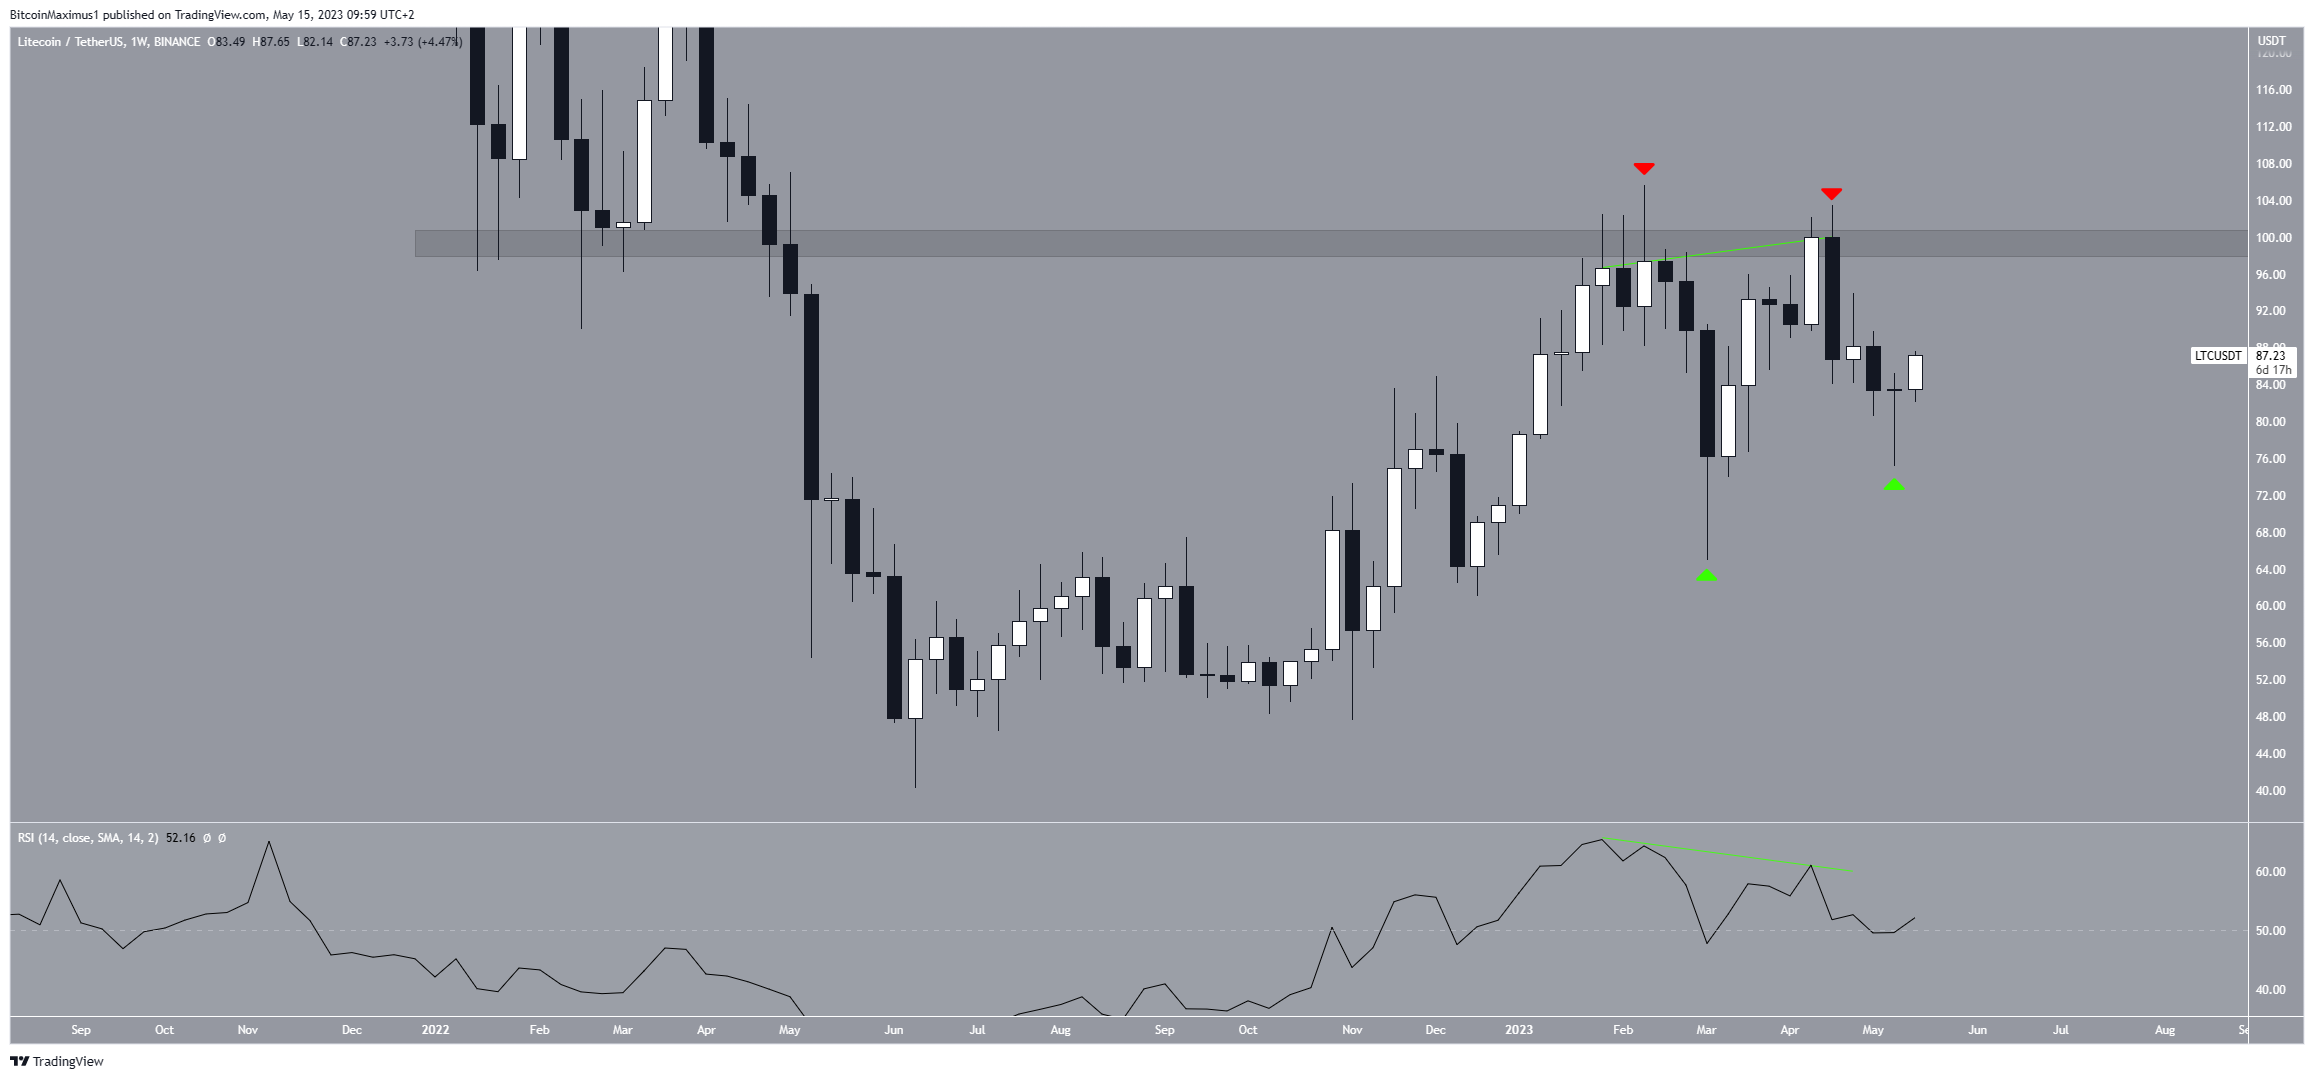
Next, the RSI also provides a bullish angle. Market traders use the RSI as a momentum indicator to identify overbought or oversold conditions, and to decide whether to accumulate or sell an asset.
Readings above 50 and an upward trend indicate that bulls still have an advantage, whereas readings below 50 suggest the opposite. While the preceding bearish divergence is a bearish sign, the fact that the price bounced at the 50 line is bullish.
LTC Price Prediction: Is the Breakout Legitimate?
While the weekly chart provides an undetermined reading, the daily one is heavily leaning bullish. There are numerous reasons for this.
To begin with, the price action has been contained within a descending parallel channel, which typically contains corrective patterns.
As a result, an eventual breakout from this channel is highly probable. Moreover, while a daily close is required to confirm the breakout, the LTC price has already moved above the channel’s resistance line.
Next, Litecoin’s price has managed to recover the support level at an average price of $79 after previously dipping below it (green icon). Upward movements often succeed in such deviations since they indicate that sellers were unable to drive the price lower.
The $79 support level holds significance as it is formed by a combination of a horizontal support area and the 0.618 Fibonacci retracement support level.
According to the Fibonacci retracement levels theory, following a significant price change in one direction, the price is expected to partially return to a previous price level before continuing in the same direction. This convergence makes it a critical support zone.
Lastly, the daily Relative Strength Index (RSI) shows an upward trend. The indicator is currently climbing above 50 (green circle). So, a future price increase to the long-term $100 resistance area seems likely.
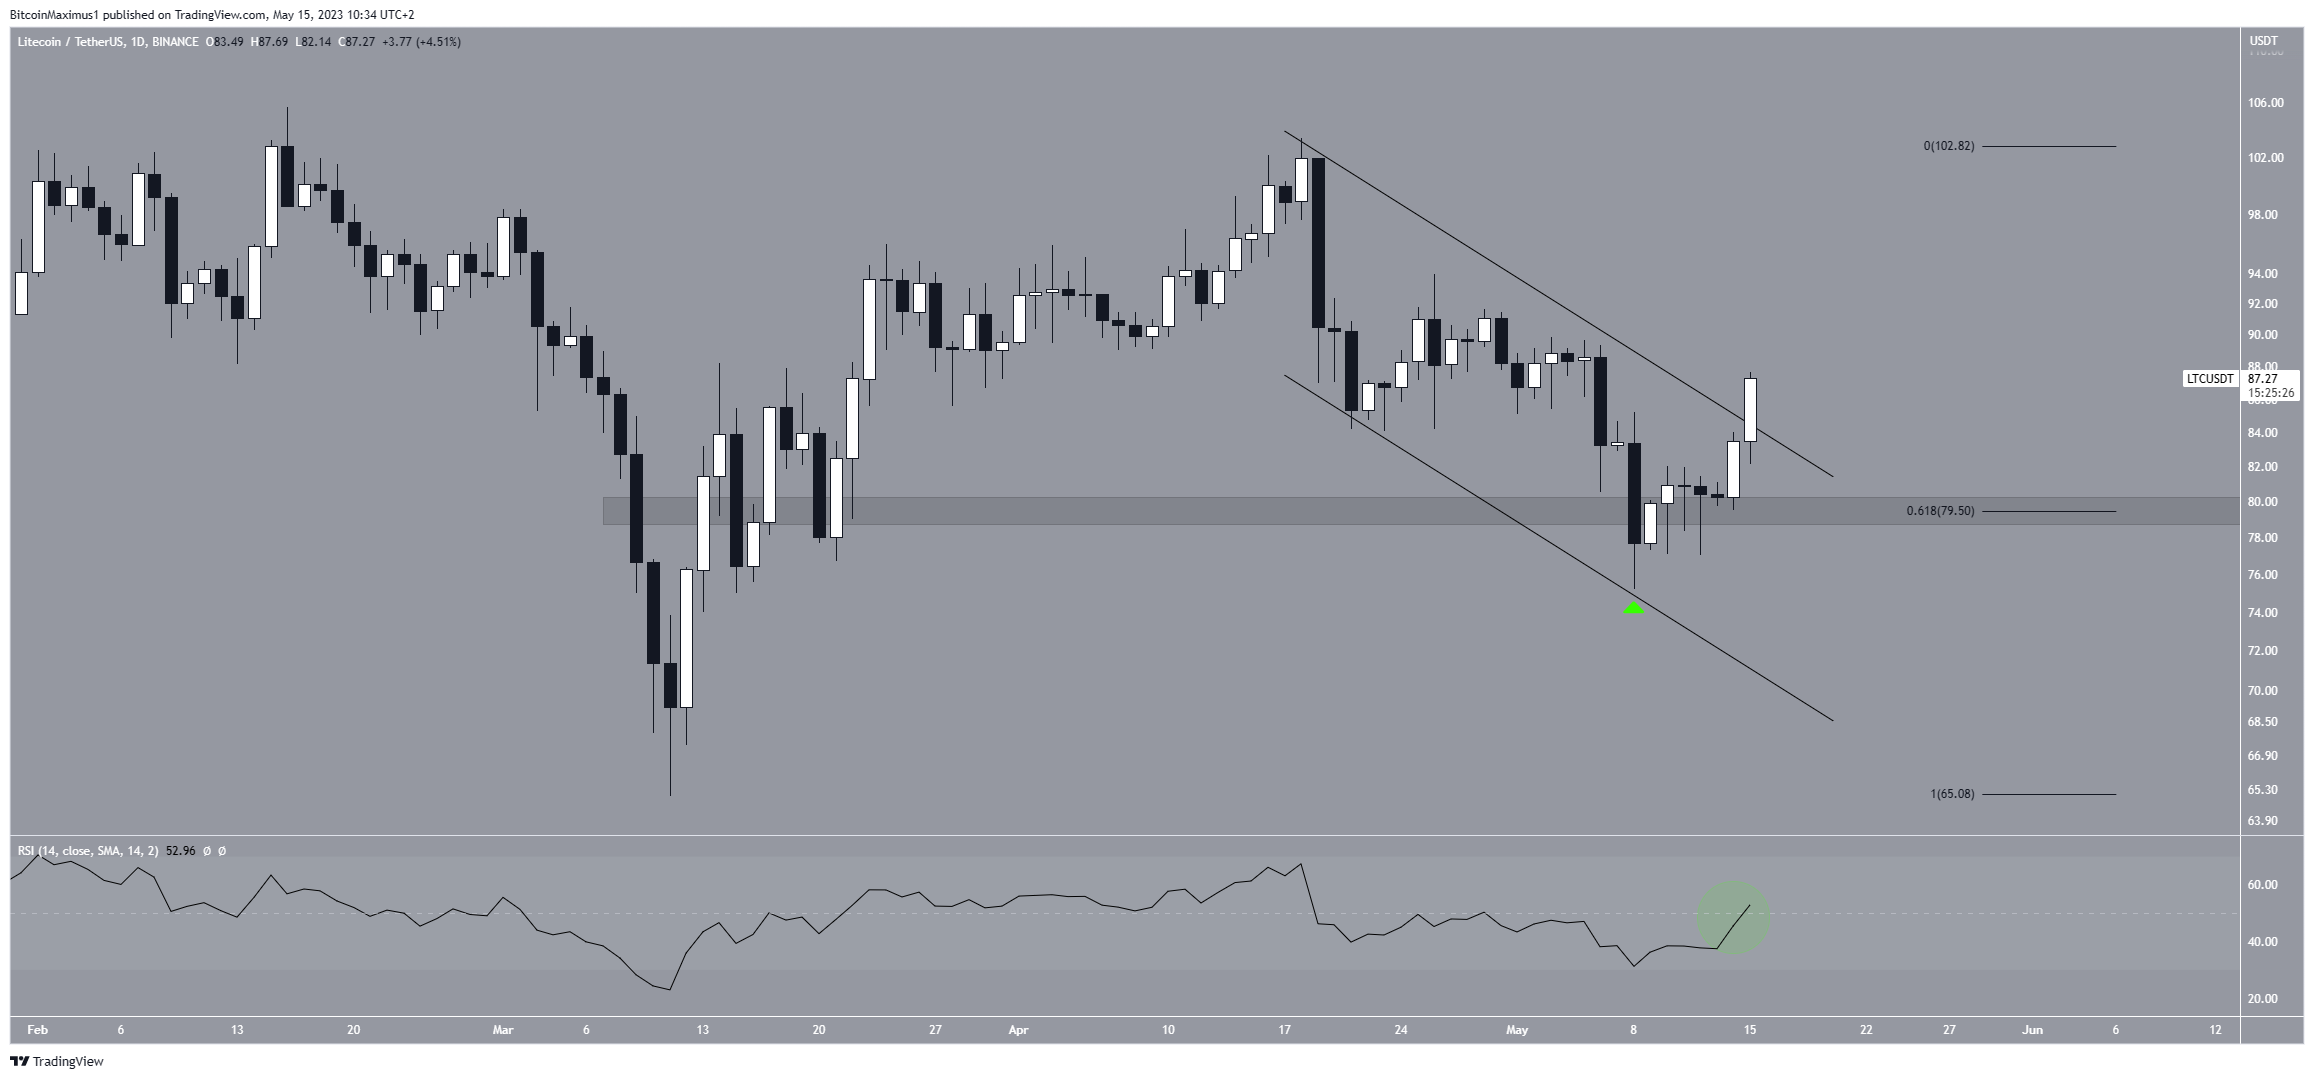
However, if the LTC price closes below the channel’s resistance line, it will invalidate the breakout and the bullish Litecoin forecast.
This will likely cause a drop toward the $68 support area.
For BeInCrypto’s latest crypto market analysis, click here.


