
ICON (ICX) is showing bullish signs in the weekly time frame. But, it is trading inside a corrective pattern in the daily time frame.
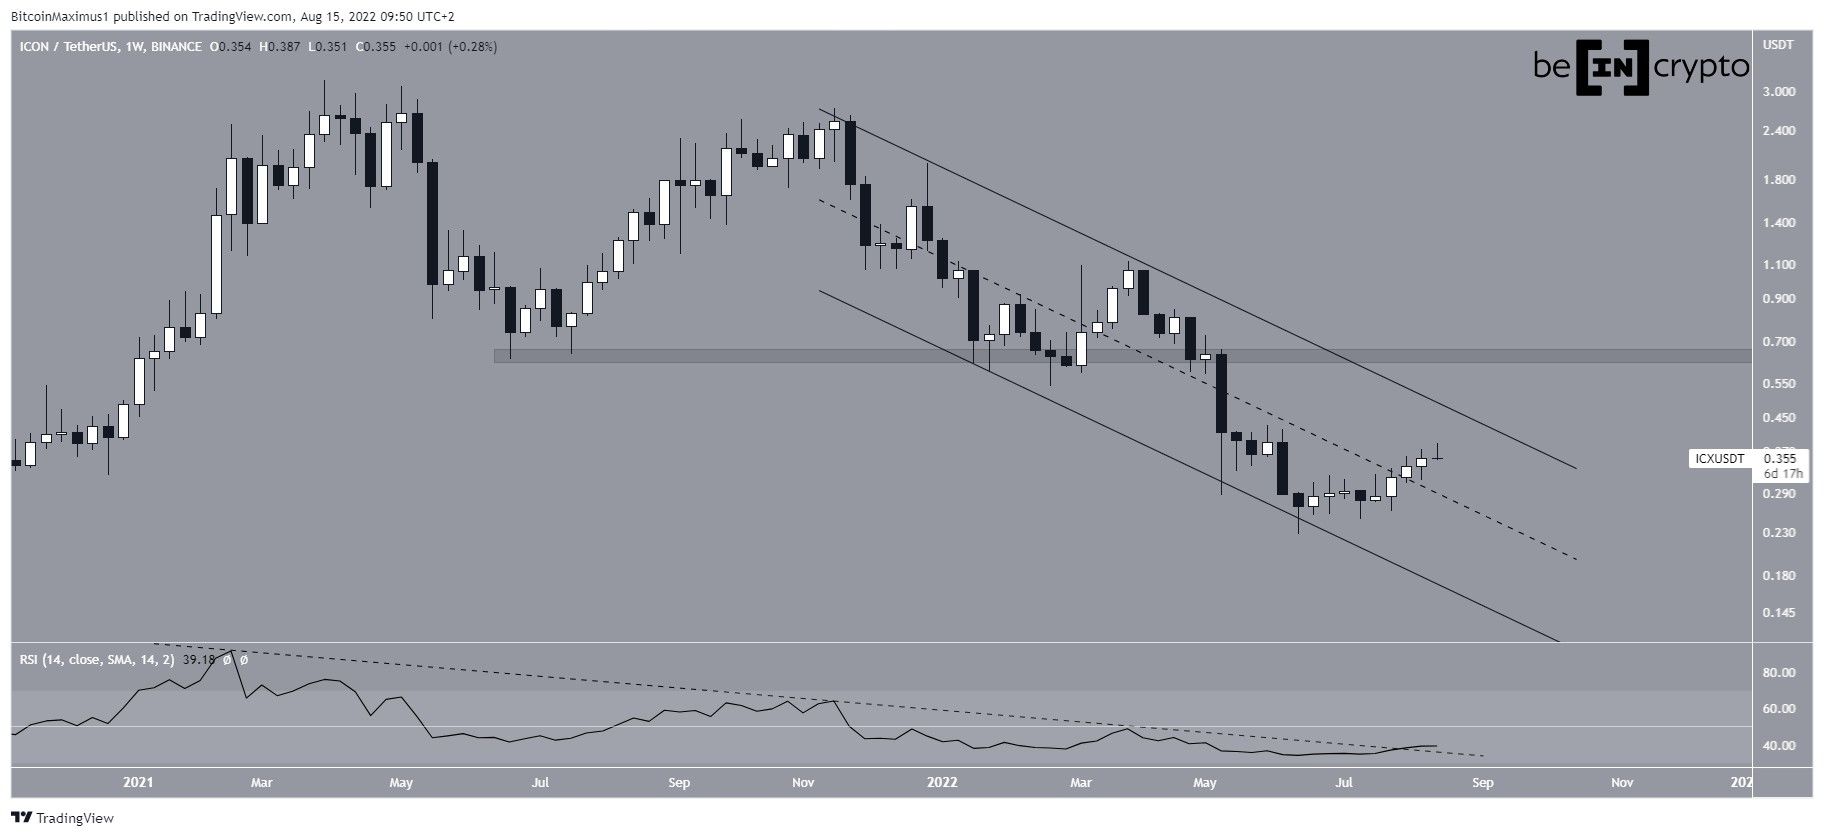
ICX has been decreasing since reaching an all-time high price of $3.20 in March 2021. Afterward, it created a slightly lower high in Nov before resuming its downward movement.
Since then, the decrease has been contained inside a descending parallel channel. Such channels usually contain corrective structures, meaning that a breakout from them would be expected.
The price validated the support line of the channel in June and has been increasing since, reclaiming the midline in Aug.
Interestingly, the weekly RSI also broke out from its descending resistance line, supporting the possibility that a bullish reversal has begun.
The resistance line of the channel is at $0.45. If the price is successful in breaking out, the next resistance would be at $0.65, a horizontal level that had previously acted as support.
*Note: The logarithmic chart is used in the image below in order to better visualize large price fluctuations.
Short-term ICX movement
Technical Analyst @Cryptodude999 tweeted a chart of ICX, stating that the price is trading inside a short-term range with resistance at $0.33.
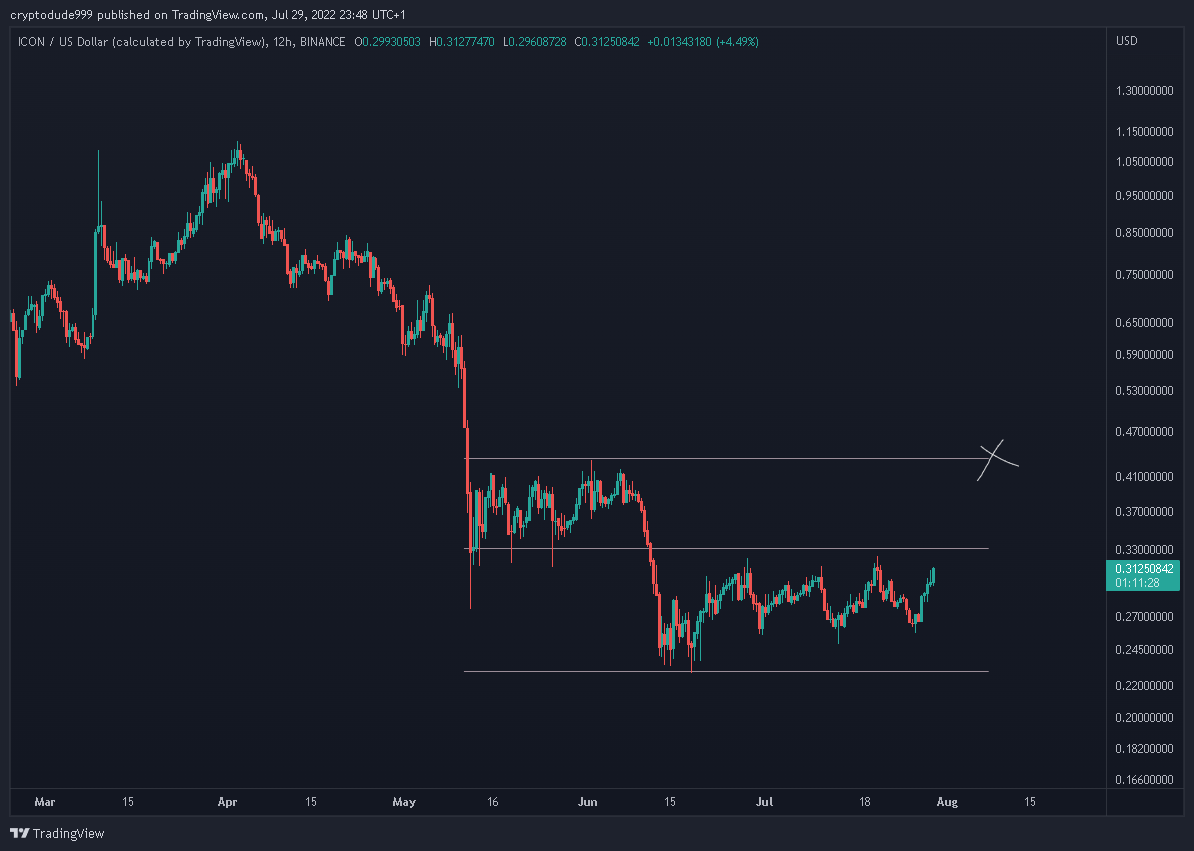
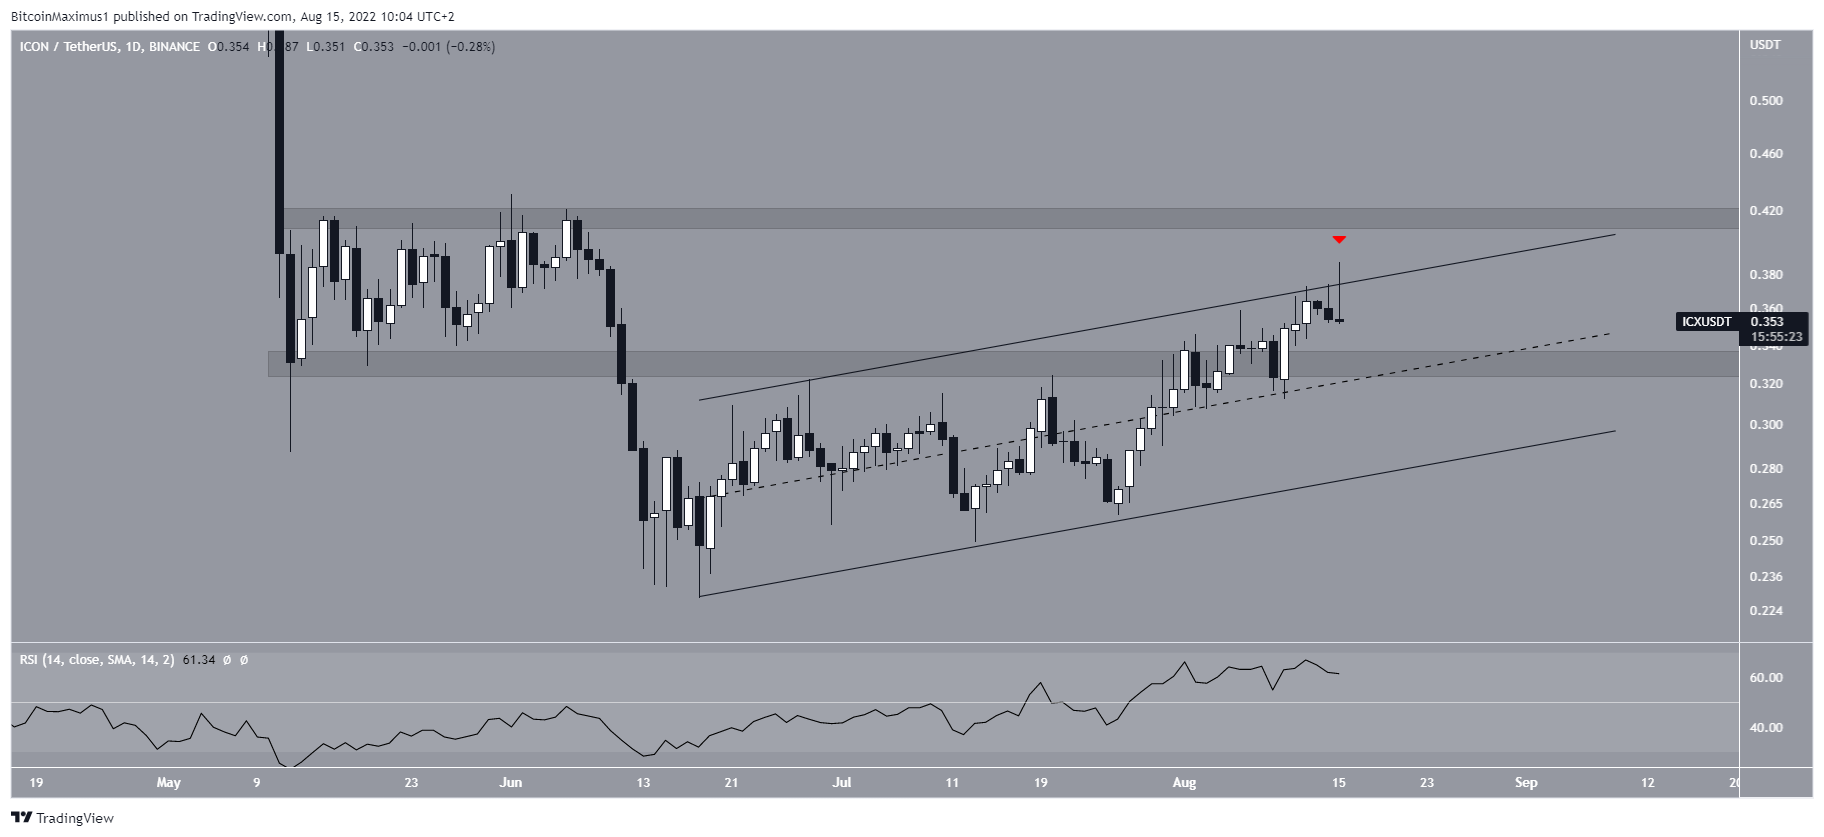
Since the tweet, the price has reclaimed the $0.33 area, breaking out from it at the beginning of Aug. However, has been rejected by the resistance line of an ascending parallel channel (red icon).
As outlined previously, such channels contain corrective movements. ICX was rejected by the resistance line of this channel on Aug 15 (red icon) and created a long upper wick.
Despite this rejection, the daily RSI is above 50, and the price is trading in the upper portion of the channel and above the $0.33 horizontal support area.
A breakout from the channel and the $0.415 resistance area would confirm that the trend is bullish. Conversely, a decrease below $0.33 would lead to lower prices instead.
For Be[in]Crypto’s latest Bitcoin (BTC) analysis, click here
