

This week BeInCrypto examined the price movement for seven cryptocurrencies that increased the most from January 28 to February 4 – with Helium (HNT) reclaiming its previous ATH level.
These cryptocurrencies are:
- Loopring (LRC) : -8.67%
- Waves (WAVES) : -6.87%
- Secret (SCRT) : -5.24%
- Fantom (FTM) : -3.22%
- Helium (HNT) : -3.18%
- Theta Fuel (TFUEL) : -2.81%
- Polygon (MATIC) : -1.64%
LRC
Loopring (LRC) has been decreasing alongside a descending wedge since November 25. The downward movement continued until a low of $0.64 was reached on Jan 22. The low served to validate both the support line of the wedge and the $0.75 horizontal support area.
Currently, LRC is making an attempt at breaking out from the resistance line of the wedge.
If a breakout occurs, the closest resistance would be at $1.65. This is the previous horizontal support area that is now expected to act as resistance.

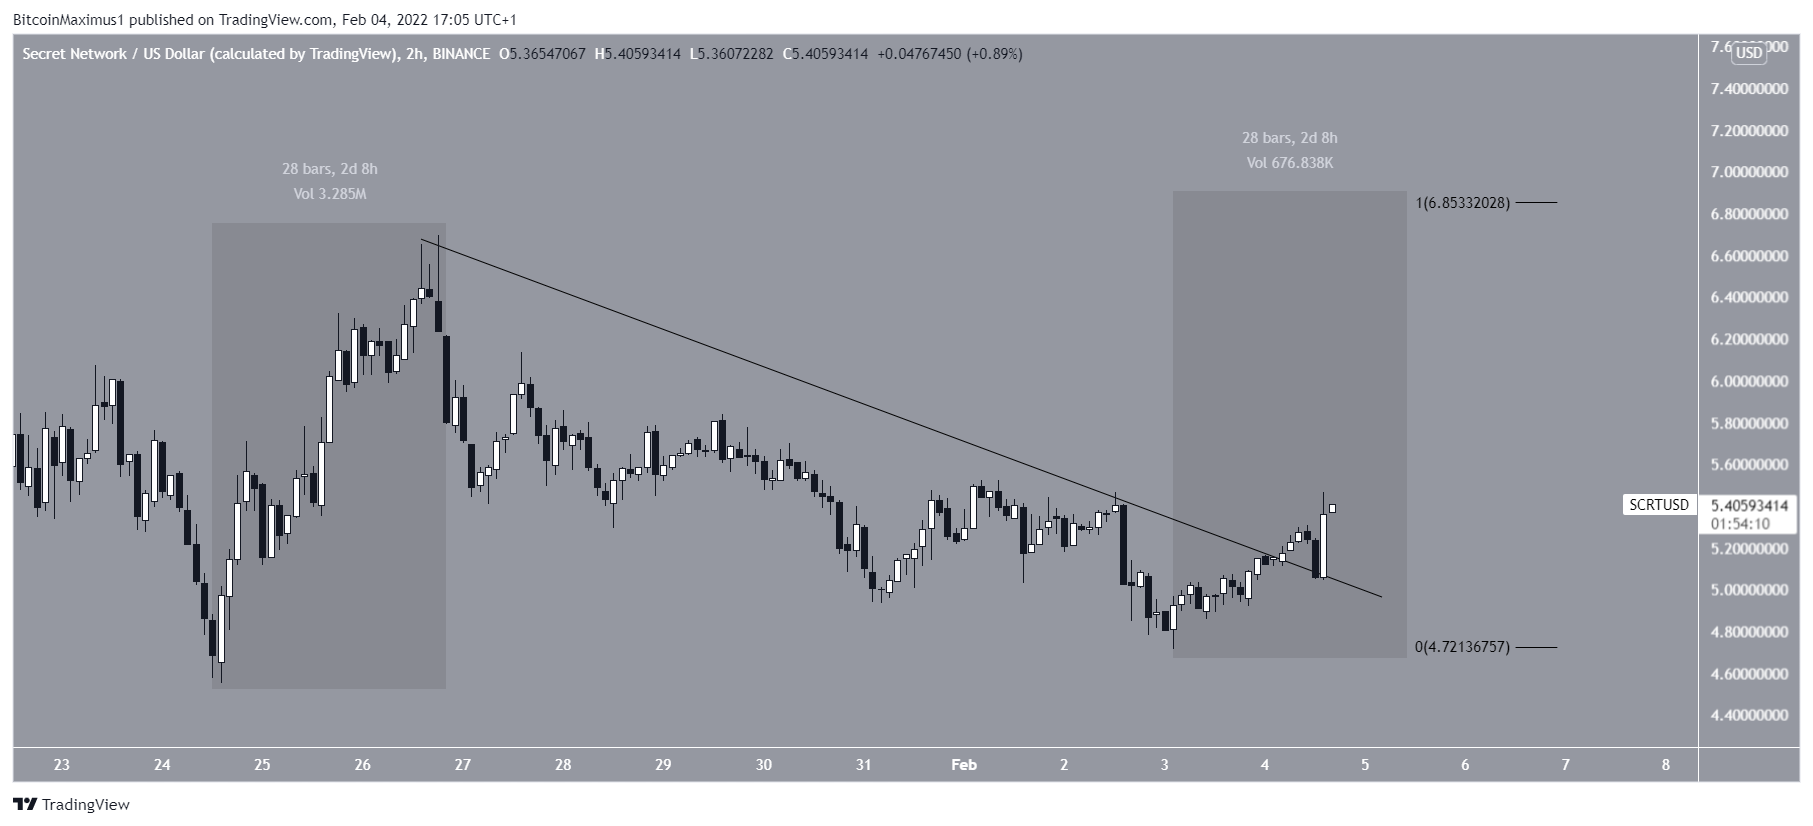
SCRT
Secret (SCRT) had been decreasing alongside a descending resistance line since January 26. On February 4, the token managed to break out and validated the line as support the next day.
If both portions of the upward movement (highlighted) have the same rate of increase, SCRT would reach a high of $6.85.
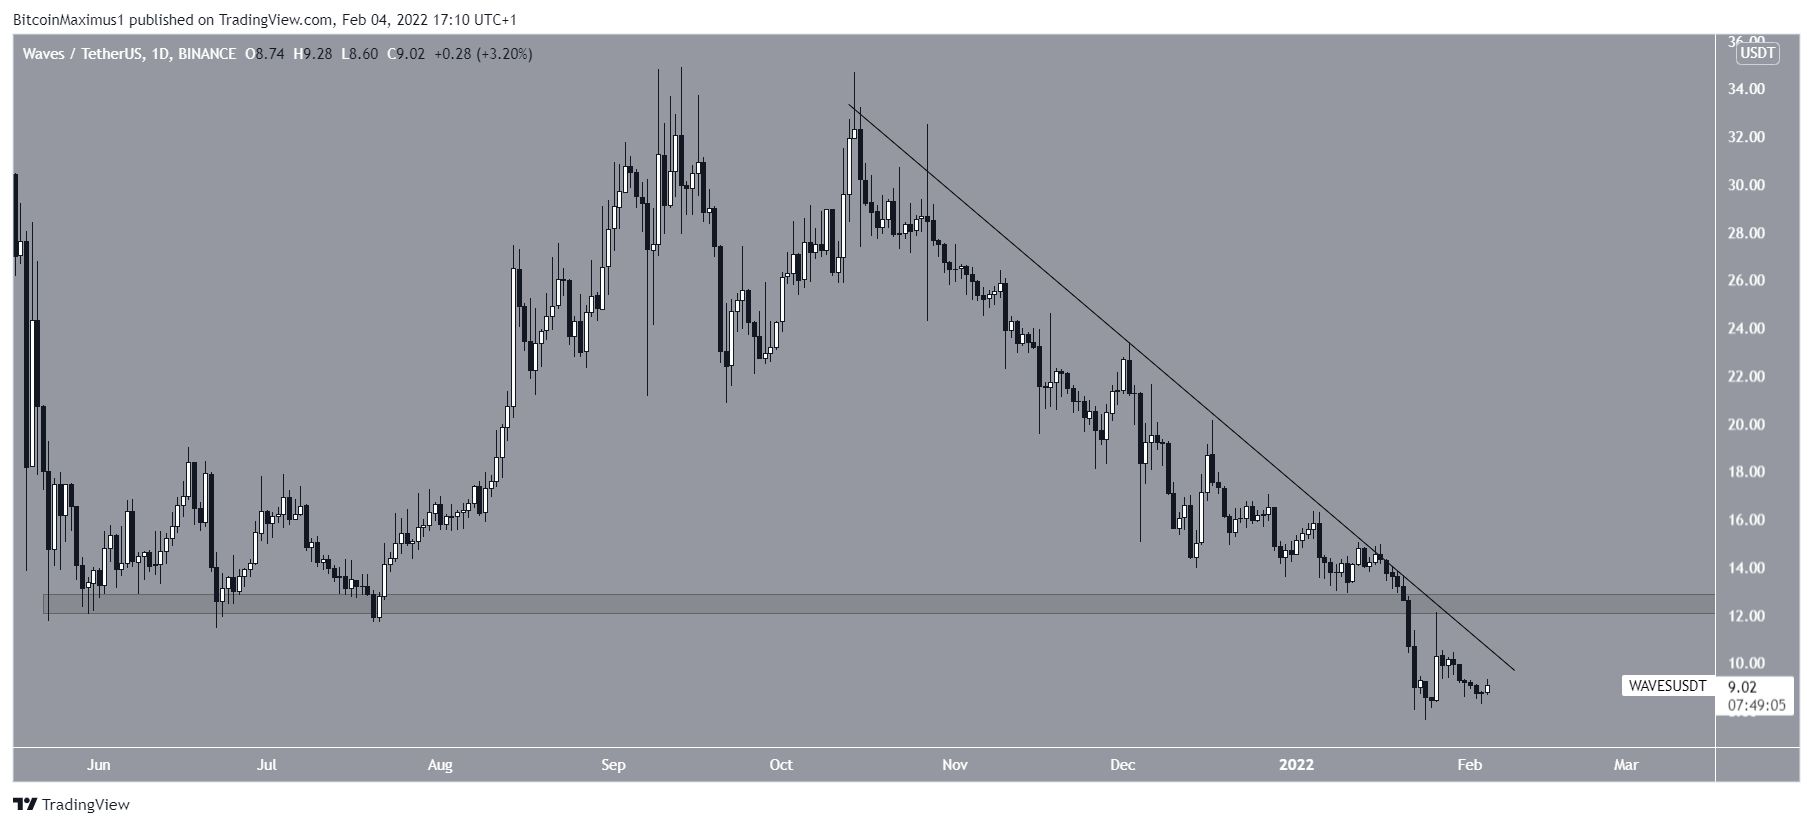
WAVES
WAVES has been decreasing alongside a descending resistance line since October 14. On January 20, it broke down from the $12.20 horizontal area, which had been acting as support since May.
While the token bounced on January 24, it is still trading below both the descending resistance line and the $12.2 horizontal resistance area.
Until it manages to clear both these resistance levels, the trend cannot be considered bullish.
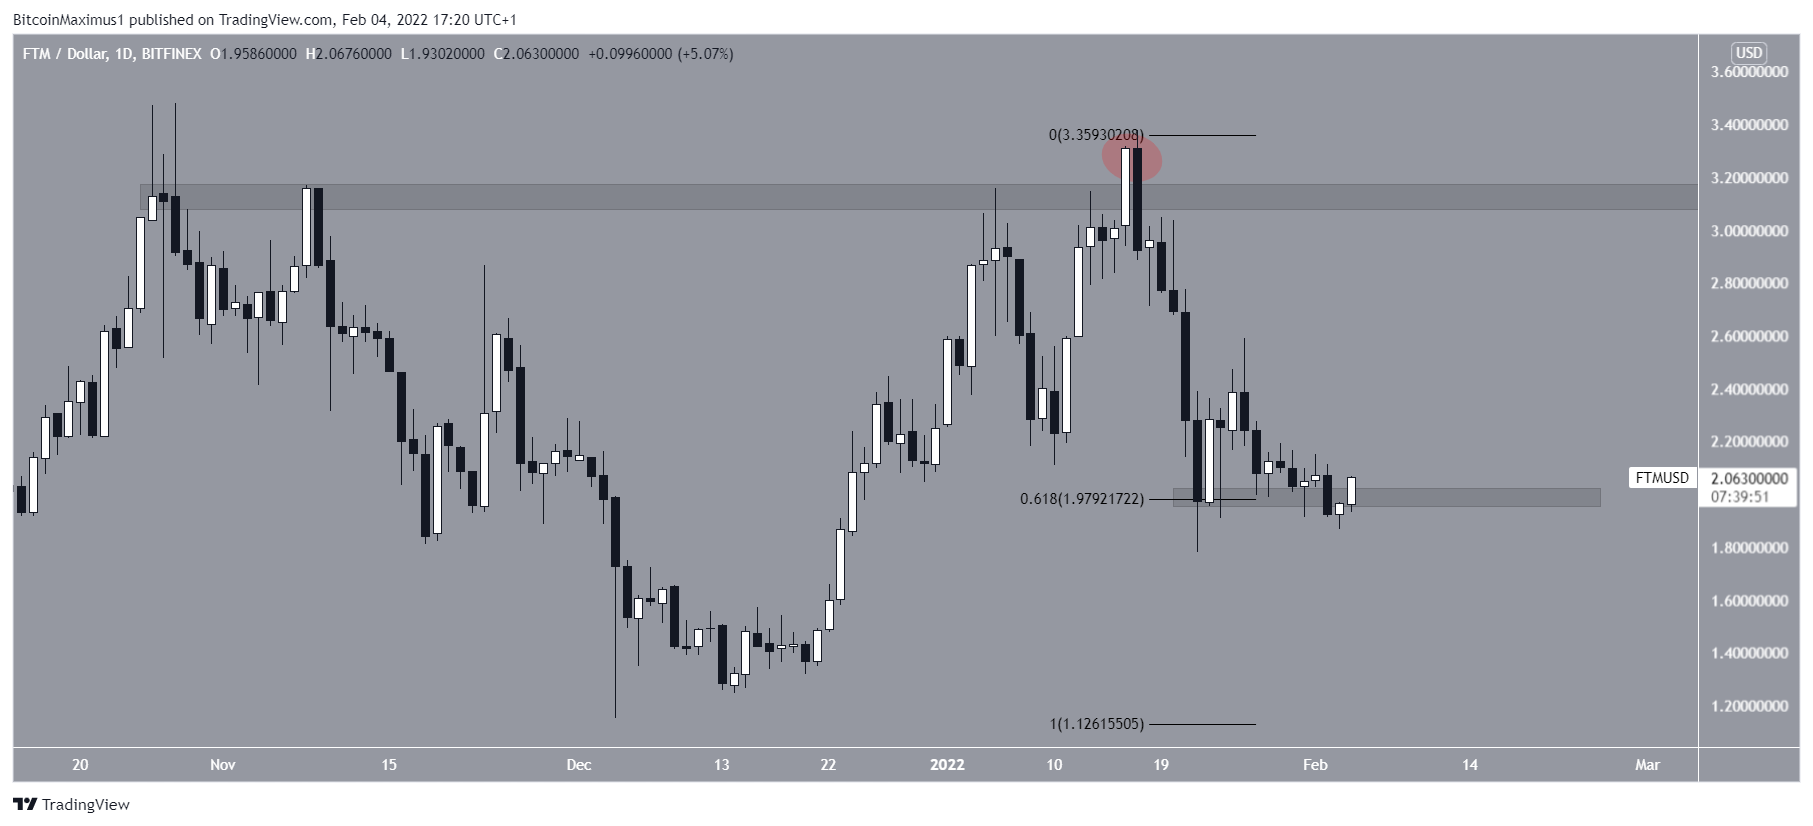
FTM
On January 17, Fantom (FTM) seemingly broke out (red circle) from the $3.10 horizontal resistance area , nearly reaching a new all-time high price in the process.
However, it decreased shortly afterwards, rendering the supposed breakout as only a deviation.
The downward movement continued until the price bounced at the 0.618 Fib retracement support level at $1.98.
As long as this support area holds, the possibility of an upward movement remains valid.
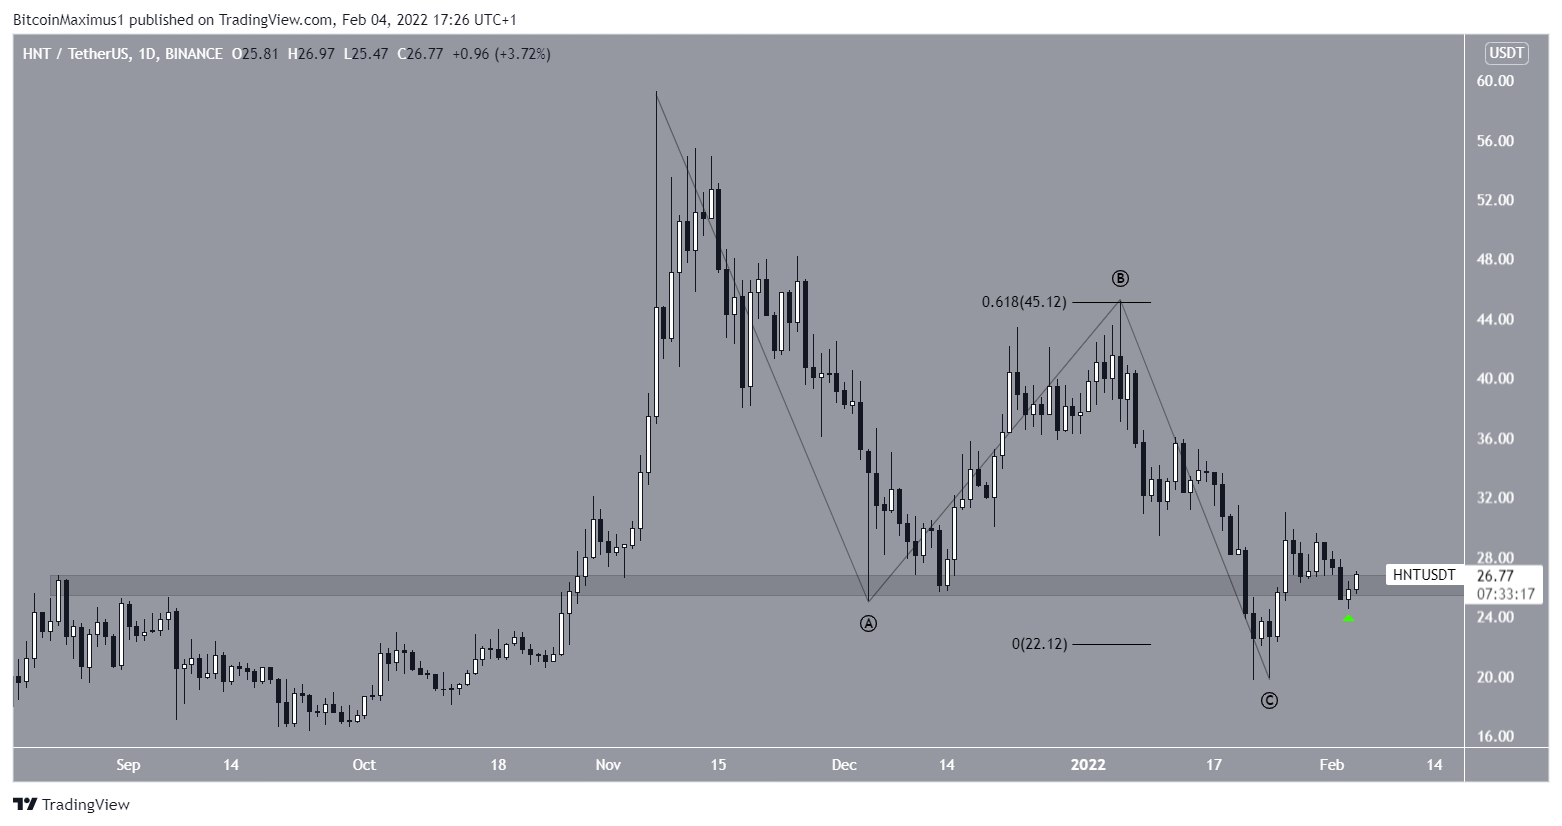
HNT
Helium (HNT) has been falling since reaching an all-time high price on November 7. The downward movement continued until January 22, when the token reached a low of $19.70.
This seemingly caused a breakdown below the $26 horizontal area, which had previously acted as the all-time high resistance level.
However, HNT reclaimed this level shortly afterwards and is now in the process of validating it as support (green icon).
Due to this reclaim and the fact that waves A:C had a 1:0.618 ratio, it is possible that the correction is now complete.
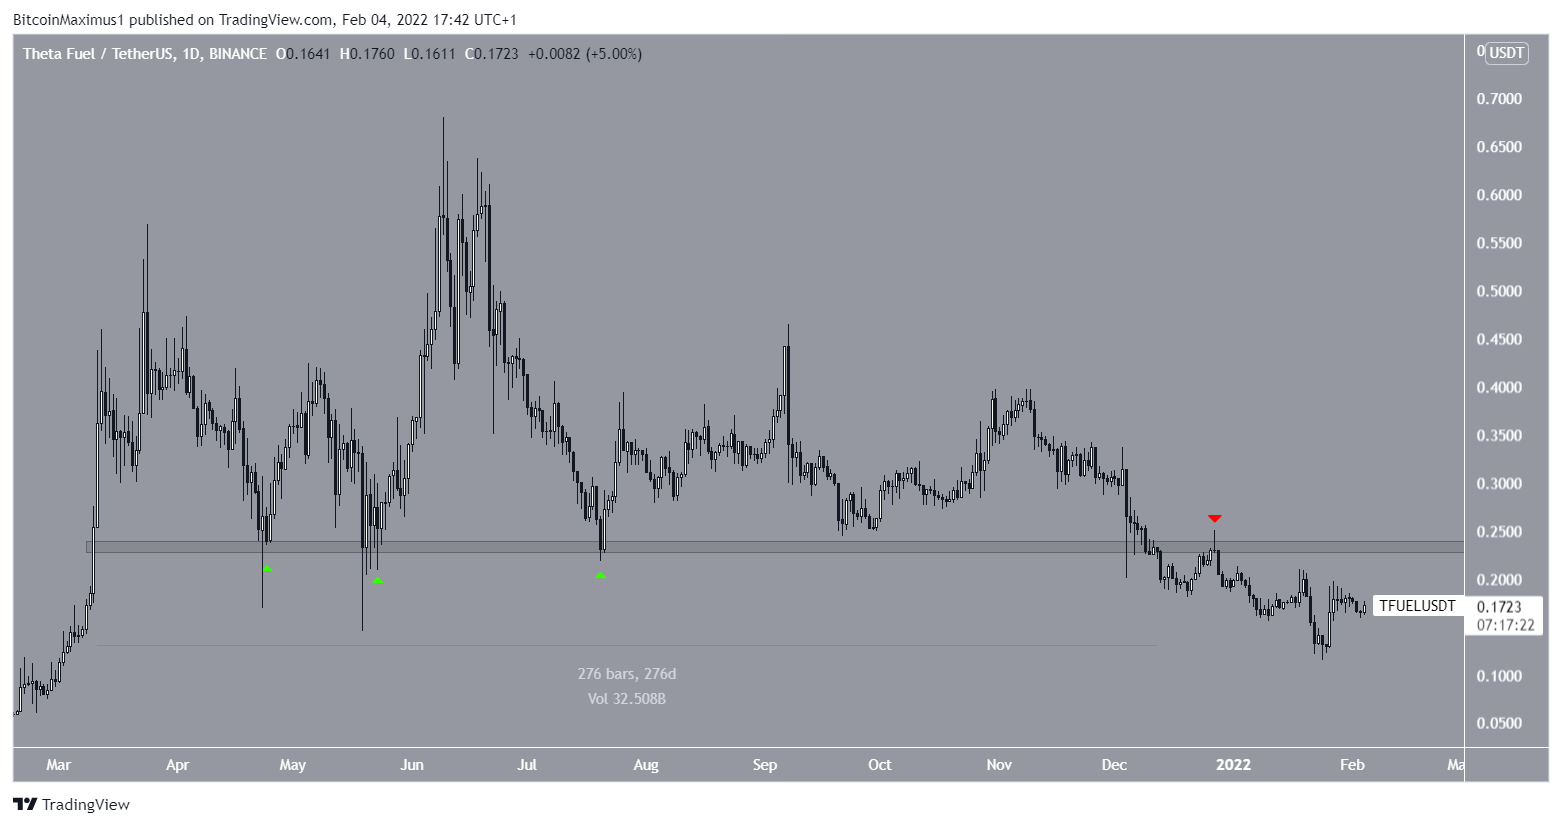
TFUEL
Theta Fuel (TFUEL) has been falling since June 9. On December 13, it broke down from $0.235 area, which had been providing support (green icons) for 276 days. Afterwards, it validated the line as resistance on December 27 (red icon).
While the token bounced considerably on January 24, the trend cannot be considered bullish until this area is reclaimed.
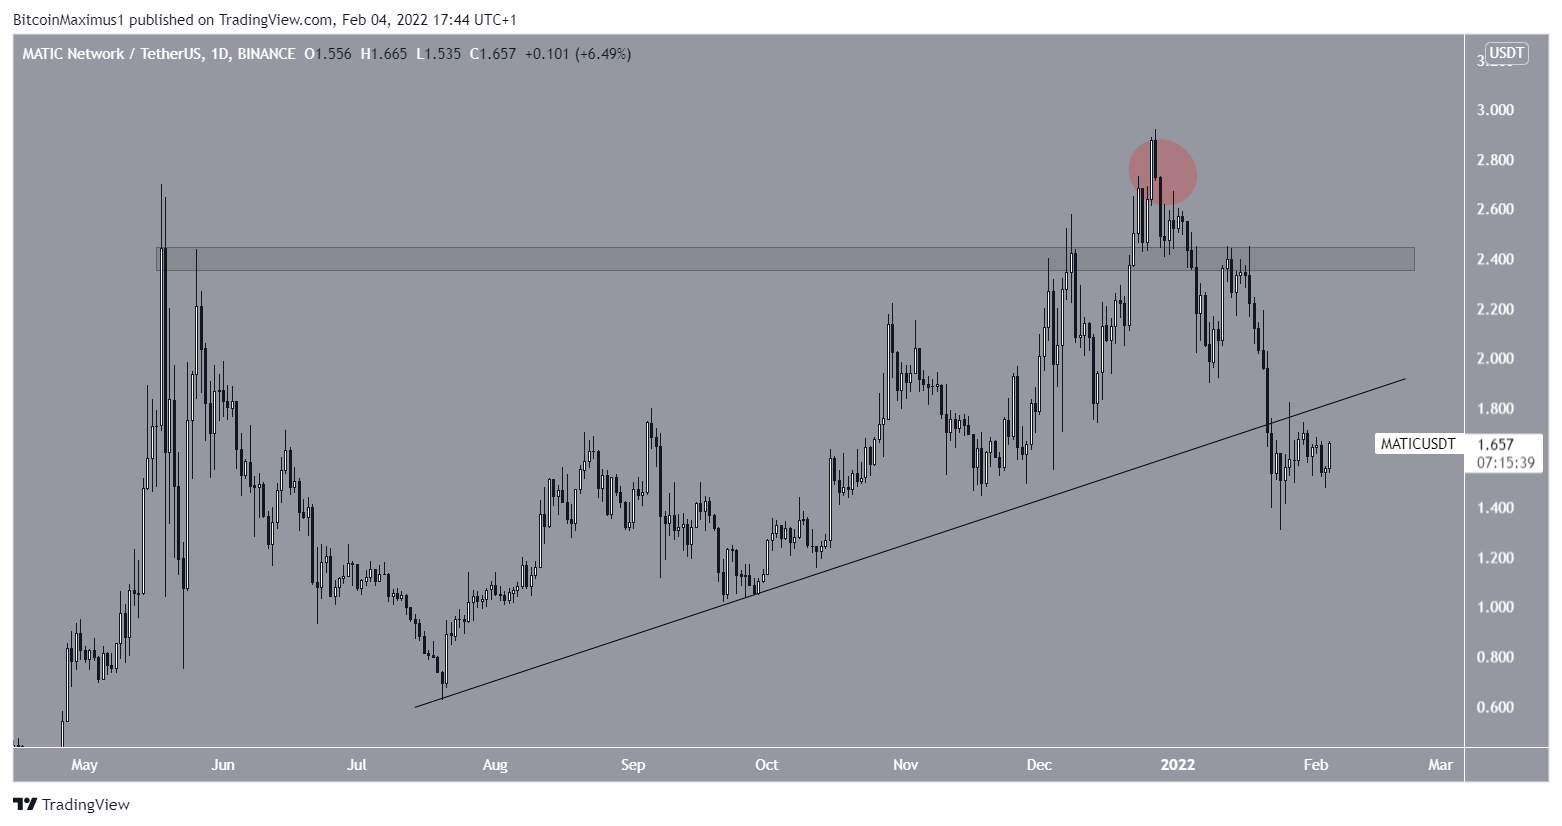
MATIC
Polygon (MATIC) has been decreasing since deviating above the $2.40 horizontal resistance area and reaching a new all-time high price on Dec 27.
On January 21, the token broke down from an ascending support line that had been in place for six months. While MATIC has bounced considerably since, the trend cannot be considered bullish until it reclaims the previous ascending support line.
For BeInCrypto’s previous Bitcoin (BTC) analysis, click here.
What do you think about this subject? Write to us and tell us!
Disclaimer
In line with the Trust Project guidelines, this price analysis article is for informational purposes only and should not be considered financial or investment advice. BeInCrypto is committed to accurate, unbiased reporting, but market conditions are subject to change without notice. Always conduct your own research and consult with a professional before making any financial decisions. Please note that our Terms and Conditions, Privacy Policy, and Disclaimers have been updated.
