


Be[in]Crypto takes a look at the five cryptocurrencies that decreased the most from March 25 to April 1.
These cryptocurrencies are:
- Axie Infinity (AXS) : -13.19%
- Zcash (ZEC) : -5.80%
- Helium (HNT) : -5.31%
- Qtum (QTUM) : -3.97%
- Ethereum Classic (ETC) : -2.72%
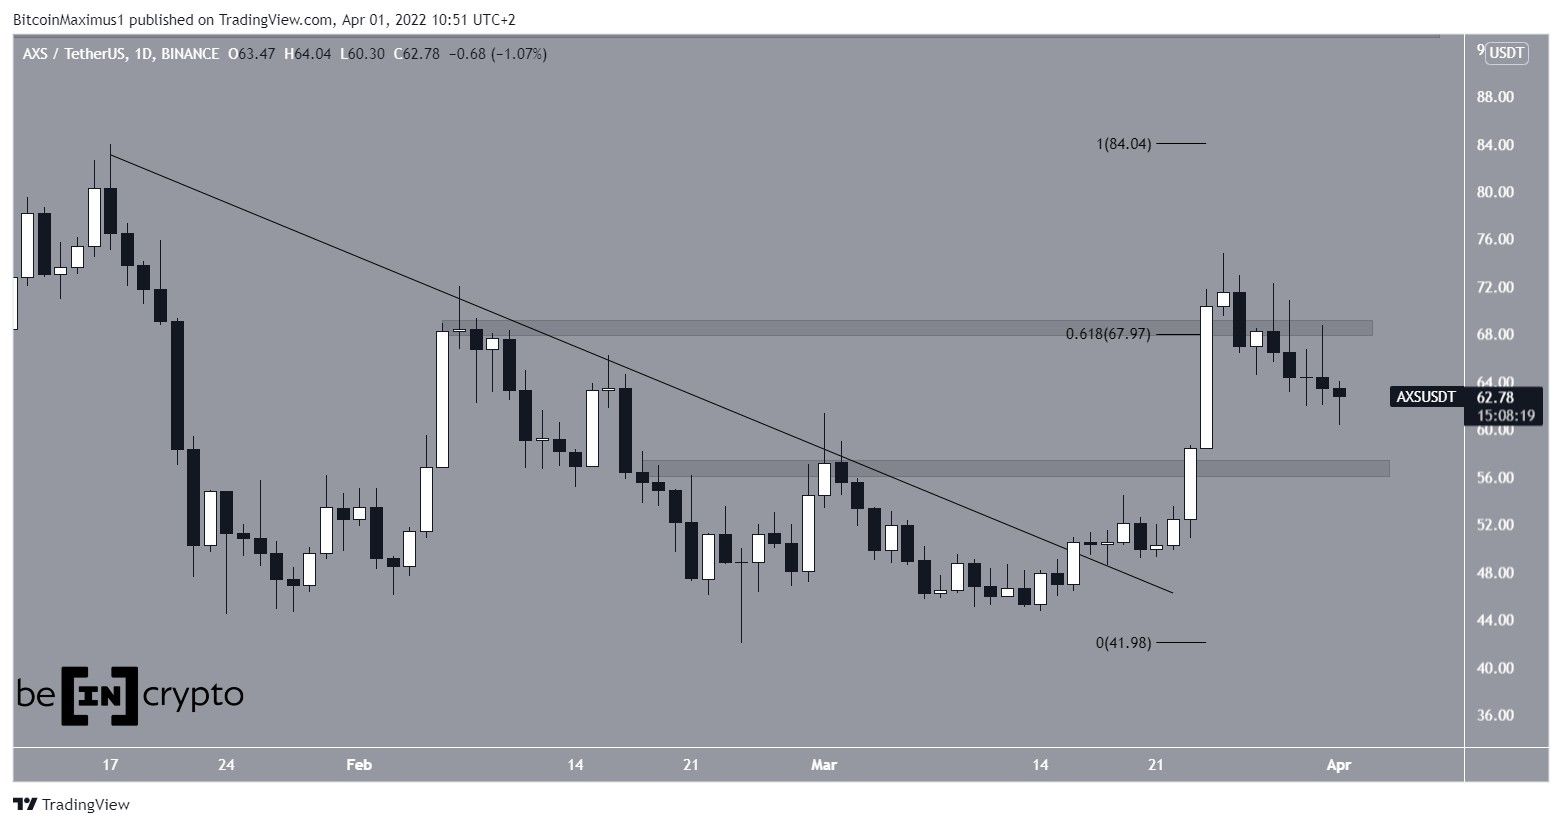
AXS
On March 16, AXS broke out from a descending resistance line and initiated an upward movement, leading to a high of $74.85 on March 25.
However, it failed to break out from the $68 resistance area, which is the 0.618 Fib retracement resistance level, and has been falling ever since. It is possible that the decrease occurred as a result of the March 29 hack.
In any case, the closest support area is $56.50.
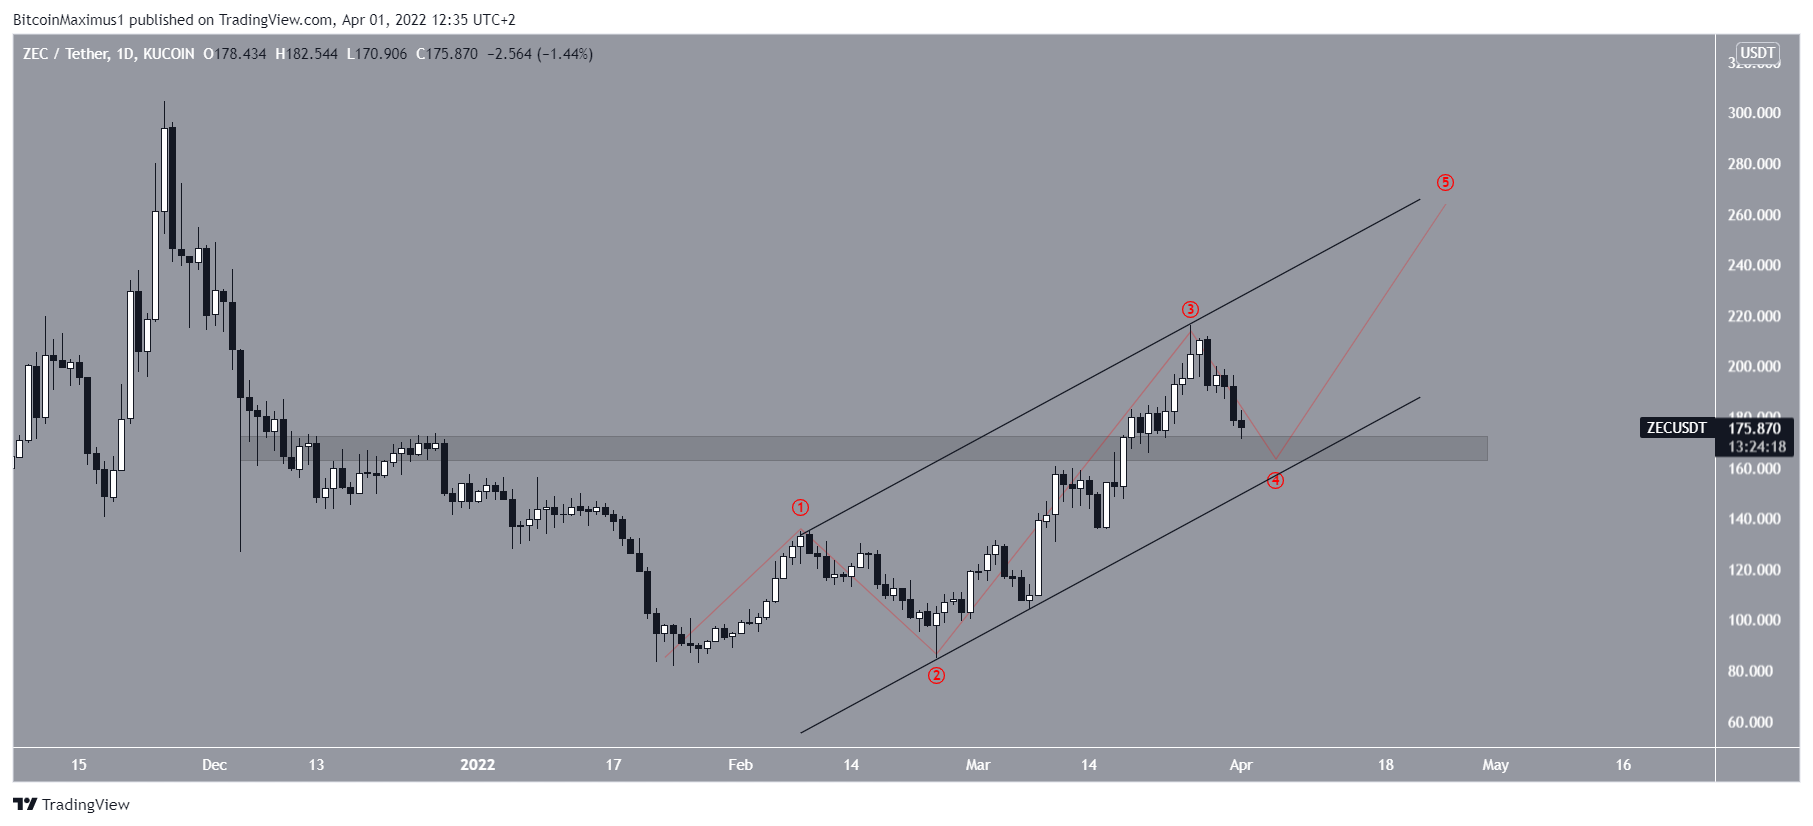
ZEC
ZEC has been moving upwards since Jan 23. The rate of increase accelerated on Feb 24, leading to a high of $216.26 on March 26. The increase caused a breakout above the $160 resistance area.
While ZEC has been falling over the past three days, it seems to be in the process of validating the $160 area as support. It is also likely that this decrease is part of wave four, after which another upward movement would be expected.
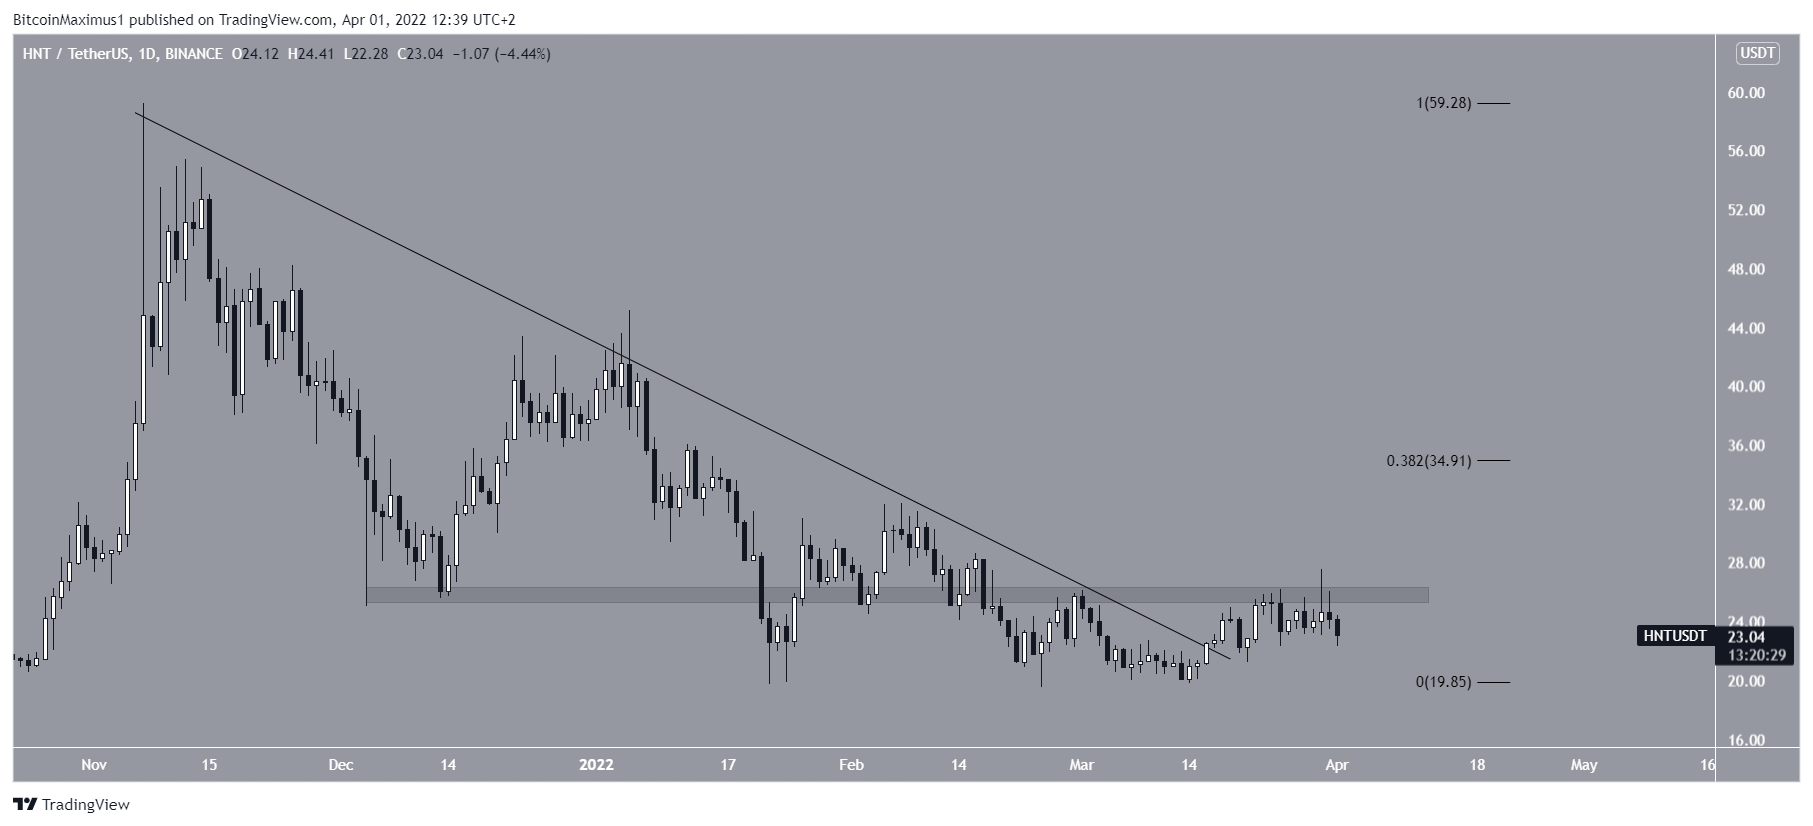
HNT
Similar to AXS, HNT had been decreasing underneath a descending resistance line since Nov 6.
After bouncing on Jan 22, HNT gradually increased and managed to break out from the line on March 16.
Currently, it is attempting to break out from the $24.50 horizontal resistance area.
If successful, the rate of increase would be expected to accelerate with the next closest resistance being at $34.90.
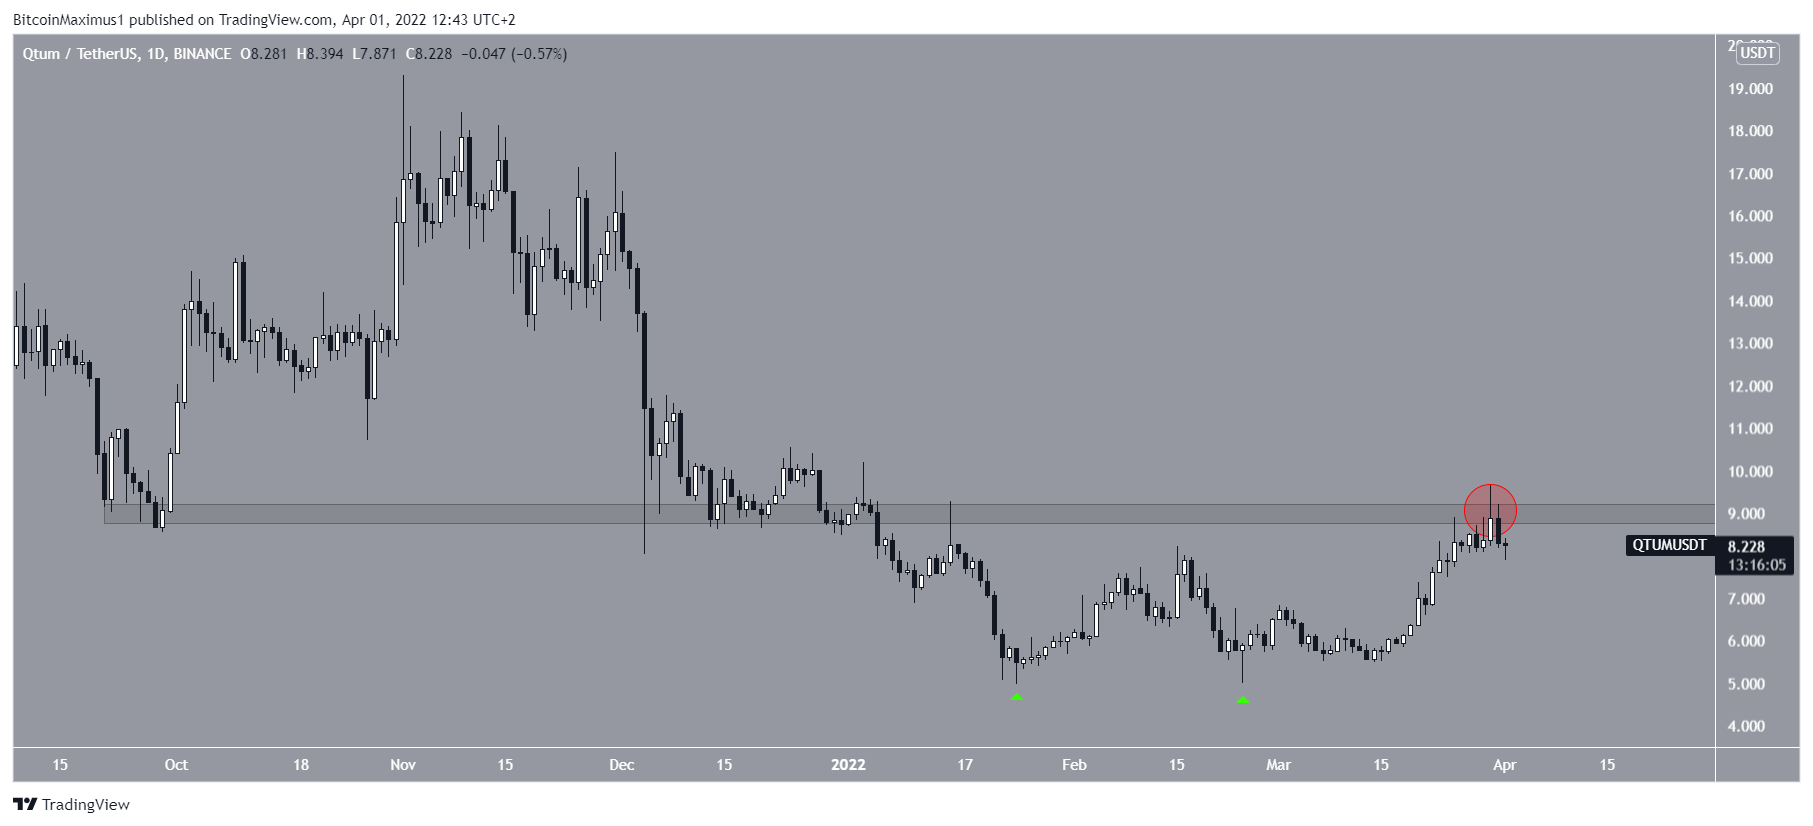
QTUM
QTUM created a double bottom pattern at $5 on Jan and Feb 24 (green icons). The double bottom is considered a bullish pattern, meaning that it usually leads to upward movements.
QTUM has been increasing since Feb 24 and reached a high of $9.64 on March 30.
However, QTUM has been falling since after it was rejected by the $9 horizontal resistance area (red circle). Until it reclaims this area, the trend cannot be considered bullish.
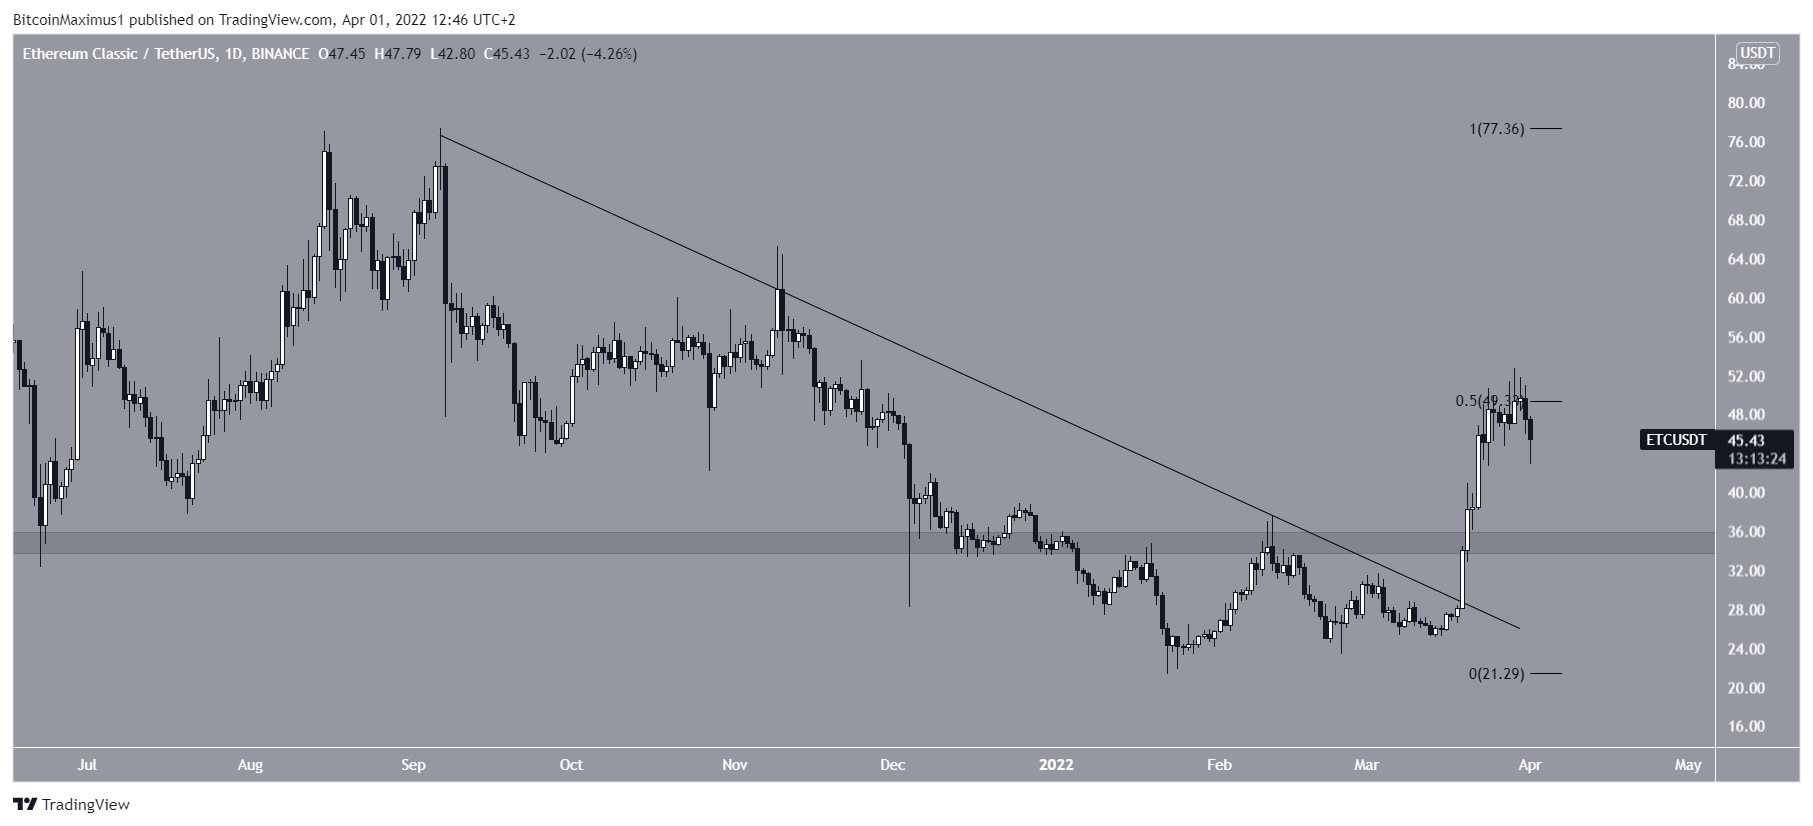
ETC
ETC had been decreasing underneath a descending resistance line since Sept 6. The downward movement led to a low of $21.20 on Jan 22.
ETC reversed trend shortly afterwards and broke out from the resistance line on March 19. It has been increasing at an accelerated rate since and reclaimed the $34.60 area the next day.
On March 29, ETC was rejected by the 0.5 Fib retracement resistance level at $49.40 and has been falling since.
The $34.60 area is now expected to provide support.
For Be[in]Crypto’s latest Bitcoin (BTC) analysis, click here


