
Hedera (HBAR) is up nearly 5% in the last 24 hours as it attempts to break above the $0.20 mark for the first time in 2 weeks. The recent price rally comes amid improving technical signals that hint at a potential shift in trend.
Despite the ongoing recovery, HBAR still faces key resistance levels and a bearish backdrop that has dominated in recent weeks.
Hedera BBTrend Is Recovering, But Still Negative
Hedera’s BBTrend is currently sitting at -1.85, showing a recovery from -3.44 yesterday, though it was recently as high as 0.96 two days ago.
This recent movement suggests some short-term improvement in price momentum after recent downside pressure. However, the overall trend still leans negative as Hedera struggles to sustain any lasting bullish signals.
The indicator highlights how the token is attempting to recover but remains stuck in a broader pattern of weak momentum.
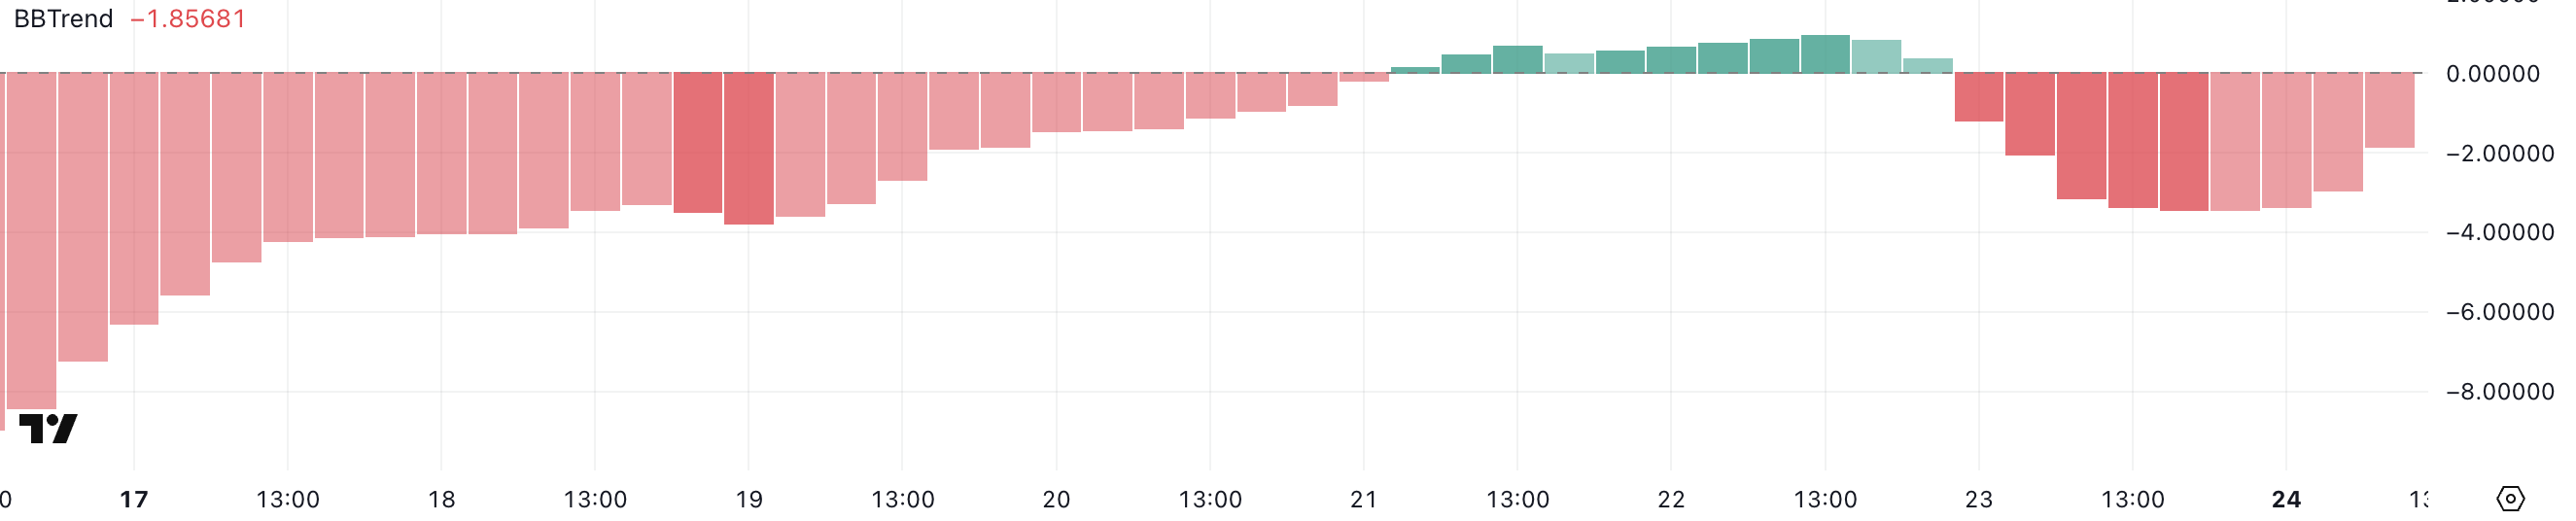
The BBTrend (Bollinger Band Trend) indicator measures how far price action deviates from the center of the Bollinger Bands, helping to assess trend strength and direction.
Typically, values above 0 suggest bullish conditions, while values below 0 point to bearish momentum. With Hedera’s BBTrend currently at -1.85, it suggests bearish pressure is still present, despite the recent bounce.
More importantly, Hedera has shown difficulty sustaining strong positive levels for an extended period – the last time BBTrend crossed above 10 was on March 6, highlighting how fleeting bullish momentum has been in recent weeks.
HBAR Ichimoku Cloud Shows The Trend Could Be Shifting, But There Are Challenges Ahead
Hedera’s Ichimoku Cloud chart is showing some early signs of recovery, as the price has broken above the blue Tenkan-sen line and is now testing the bottom of the red Kumo (cloud).
The price action has moved into the cloud after trading below it for an extended period, which can be seen as a shift from bearish to more neutral conditions.
While the price attempting to climb into the cloud suggests that selling pressure is weakening, it still faces resistance from the thicker part of the Kumo just above current levels.
The cloud’s bearish (red) coloration indicates that the broader trend remains under pressure, despite the recent upside move.
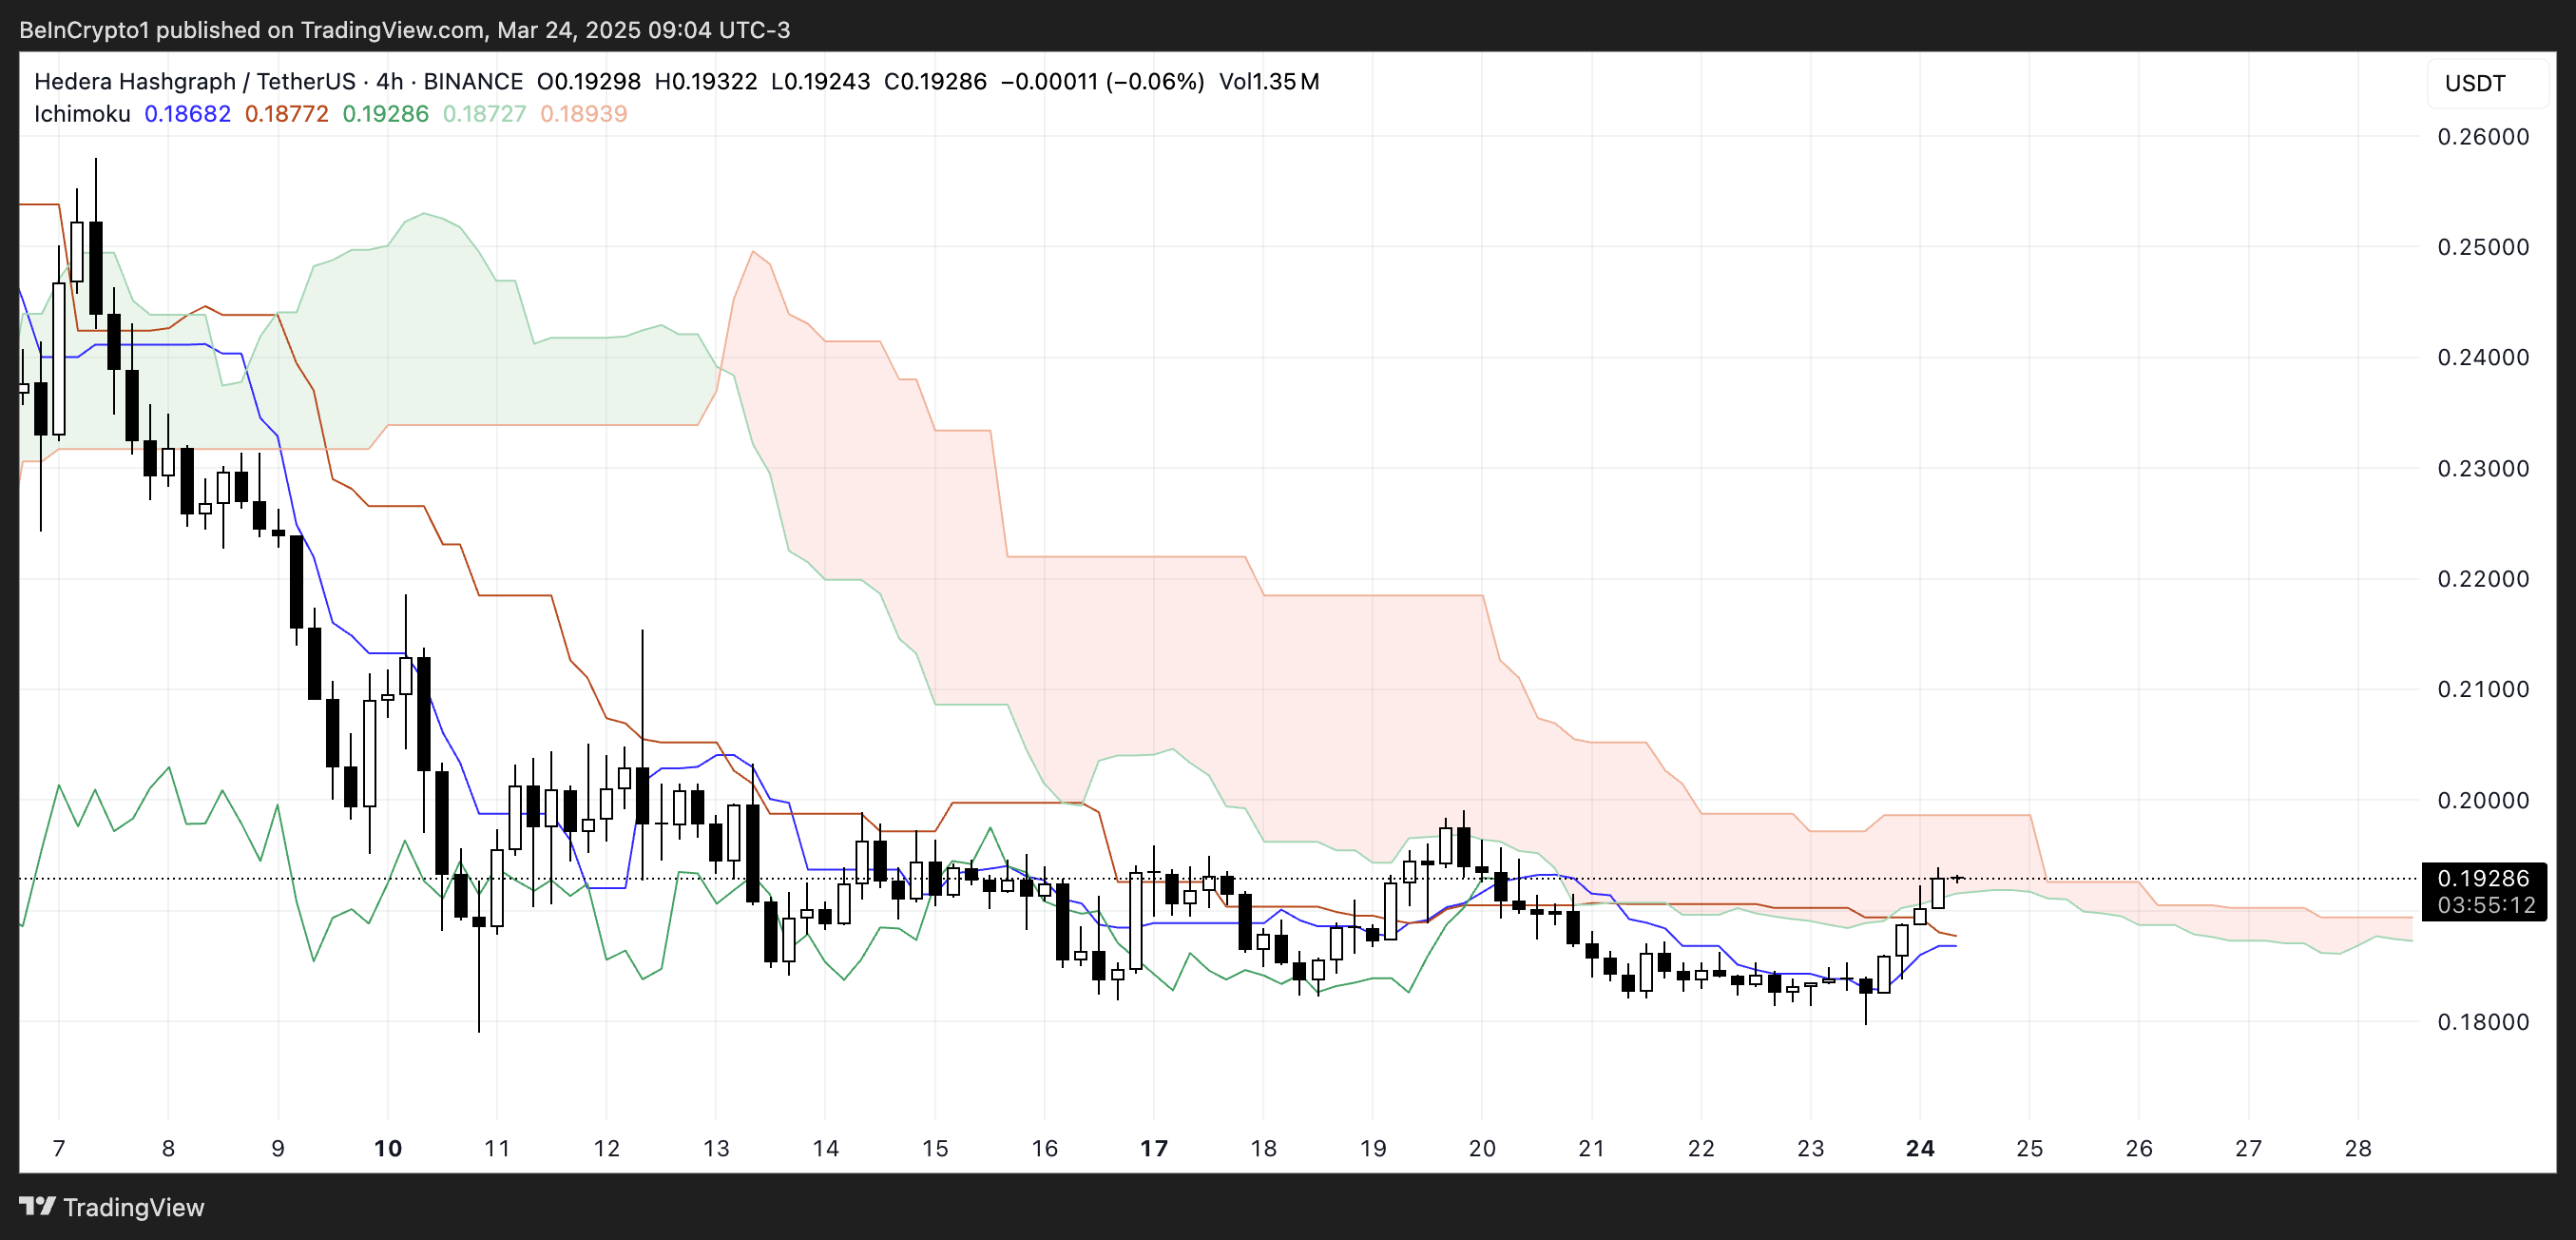
The Ichimoku Cloud, or Kumo, is a multi-component indicator that highlights support, resistance, trend direction, and momentum all in one glance. When prices are below the cloud, it suggests bearish conditions, while prices above the cloud signal bullish sentiment.
Trading inside the cloud typically indicates a consolidation phase or market indecision.
In Hedera’s case, the token’s current positioning within the cloud signals that it is attempting to neutralize the recent bearish momentum but has not yet shifted into a clear bullish trend.
Until HBAR can firmly break above the upper edge of the cloud, upside potential may remain capped by resistance.
Will A Golden Cross Make Hedera Surge?
Hedera’s EMA lines are still showing a bearish setup overall as long-term EMAs continue to trend downward. However, short-term EMAs are beginning to slope upwards and could soon cross above the longer-term averages, potentially forming a golden cross.
If this bullish crossover occurs, it may trigger a stronger upward move, with the first resistance level sitting at $0.199. A break above this level could open the path for further gains toward $0.215, and if the bullish momentum accelerates, Hedera price could even aim for $0.258 in the coming sessions.
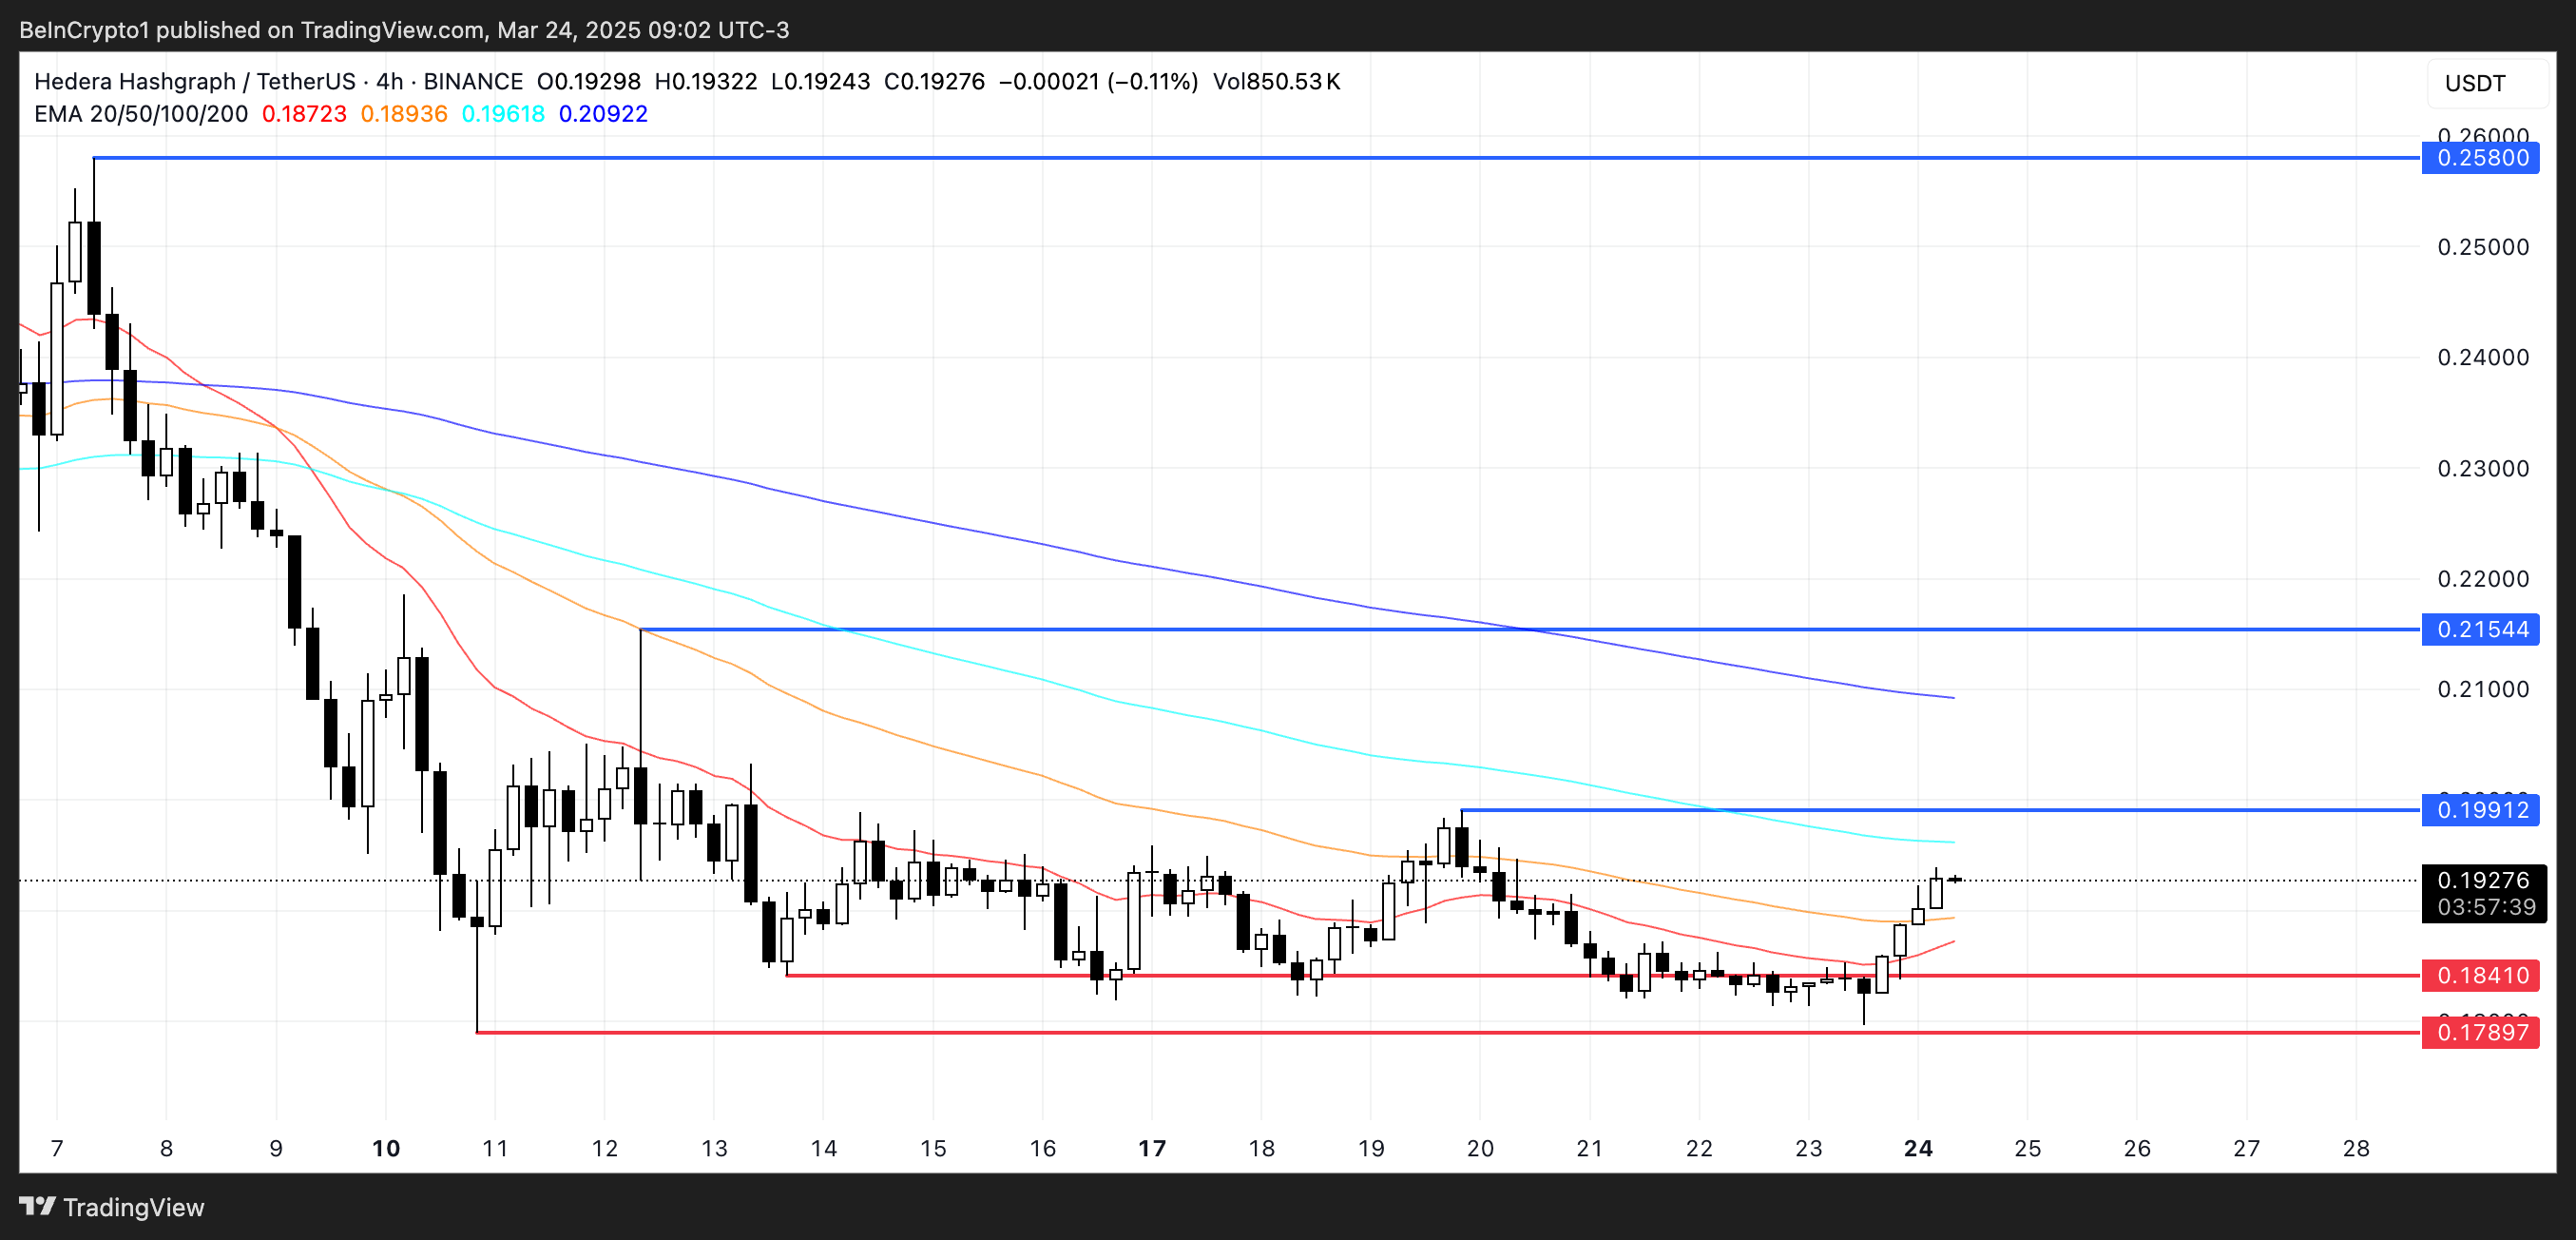
Alternatively, if the short-term upside momentum fades and the golden cross fails to materialize, bearish pressure could resume. In this scenario, HBAR may revisit key support levels at $0.184 and $0.178.
A decisive break below these levels could lead the token back under $0.17, reinforcing the bearish structure.
