


The price of Hedera’s HBAR has been on a downtrend since reaching its year-to-date (YTD) high of $0.40 on January 17. The altcoin has now dropped to $0.19, marking a 52% decline as bearish pressure continues to dominate the market.
Technical indicators suggest the downturn may not be over, as selling pressure remains high.
HBAR’s Price Woes Continue as Indicators Show No Relief
The sustained dip in HBAR’s Relative Strength Index (RSI) confirms the surging selling pressure among its spot traders. As of this writing, this is at 40.62.
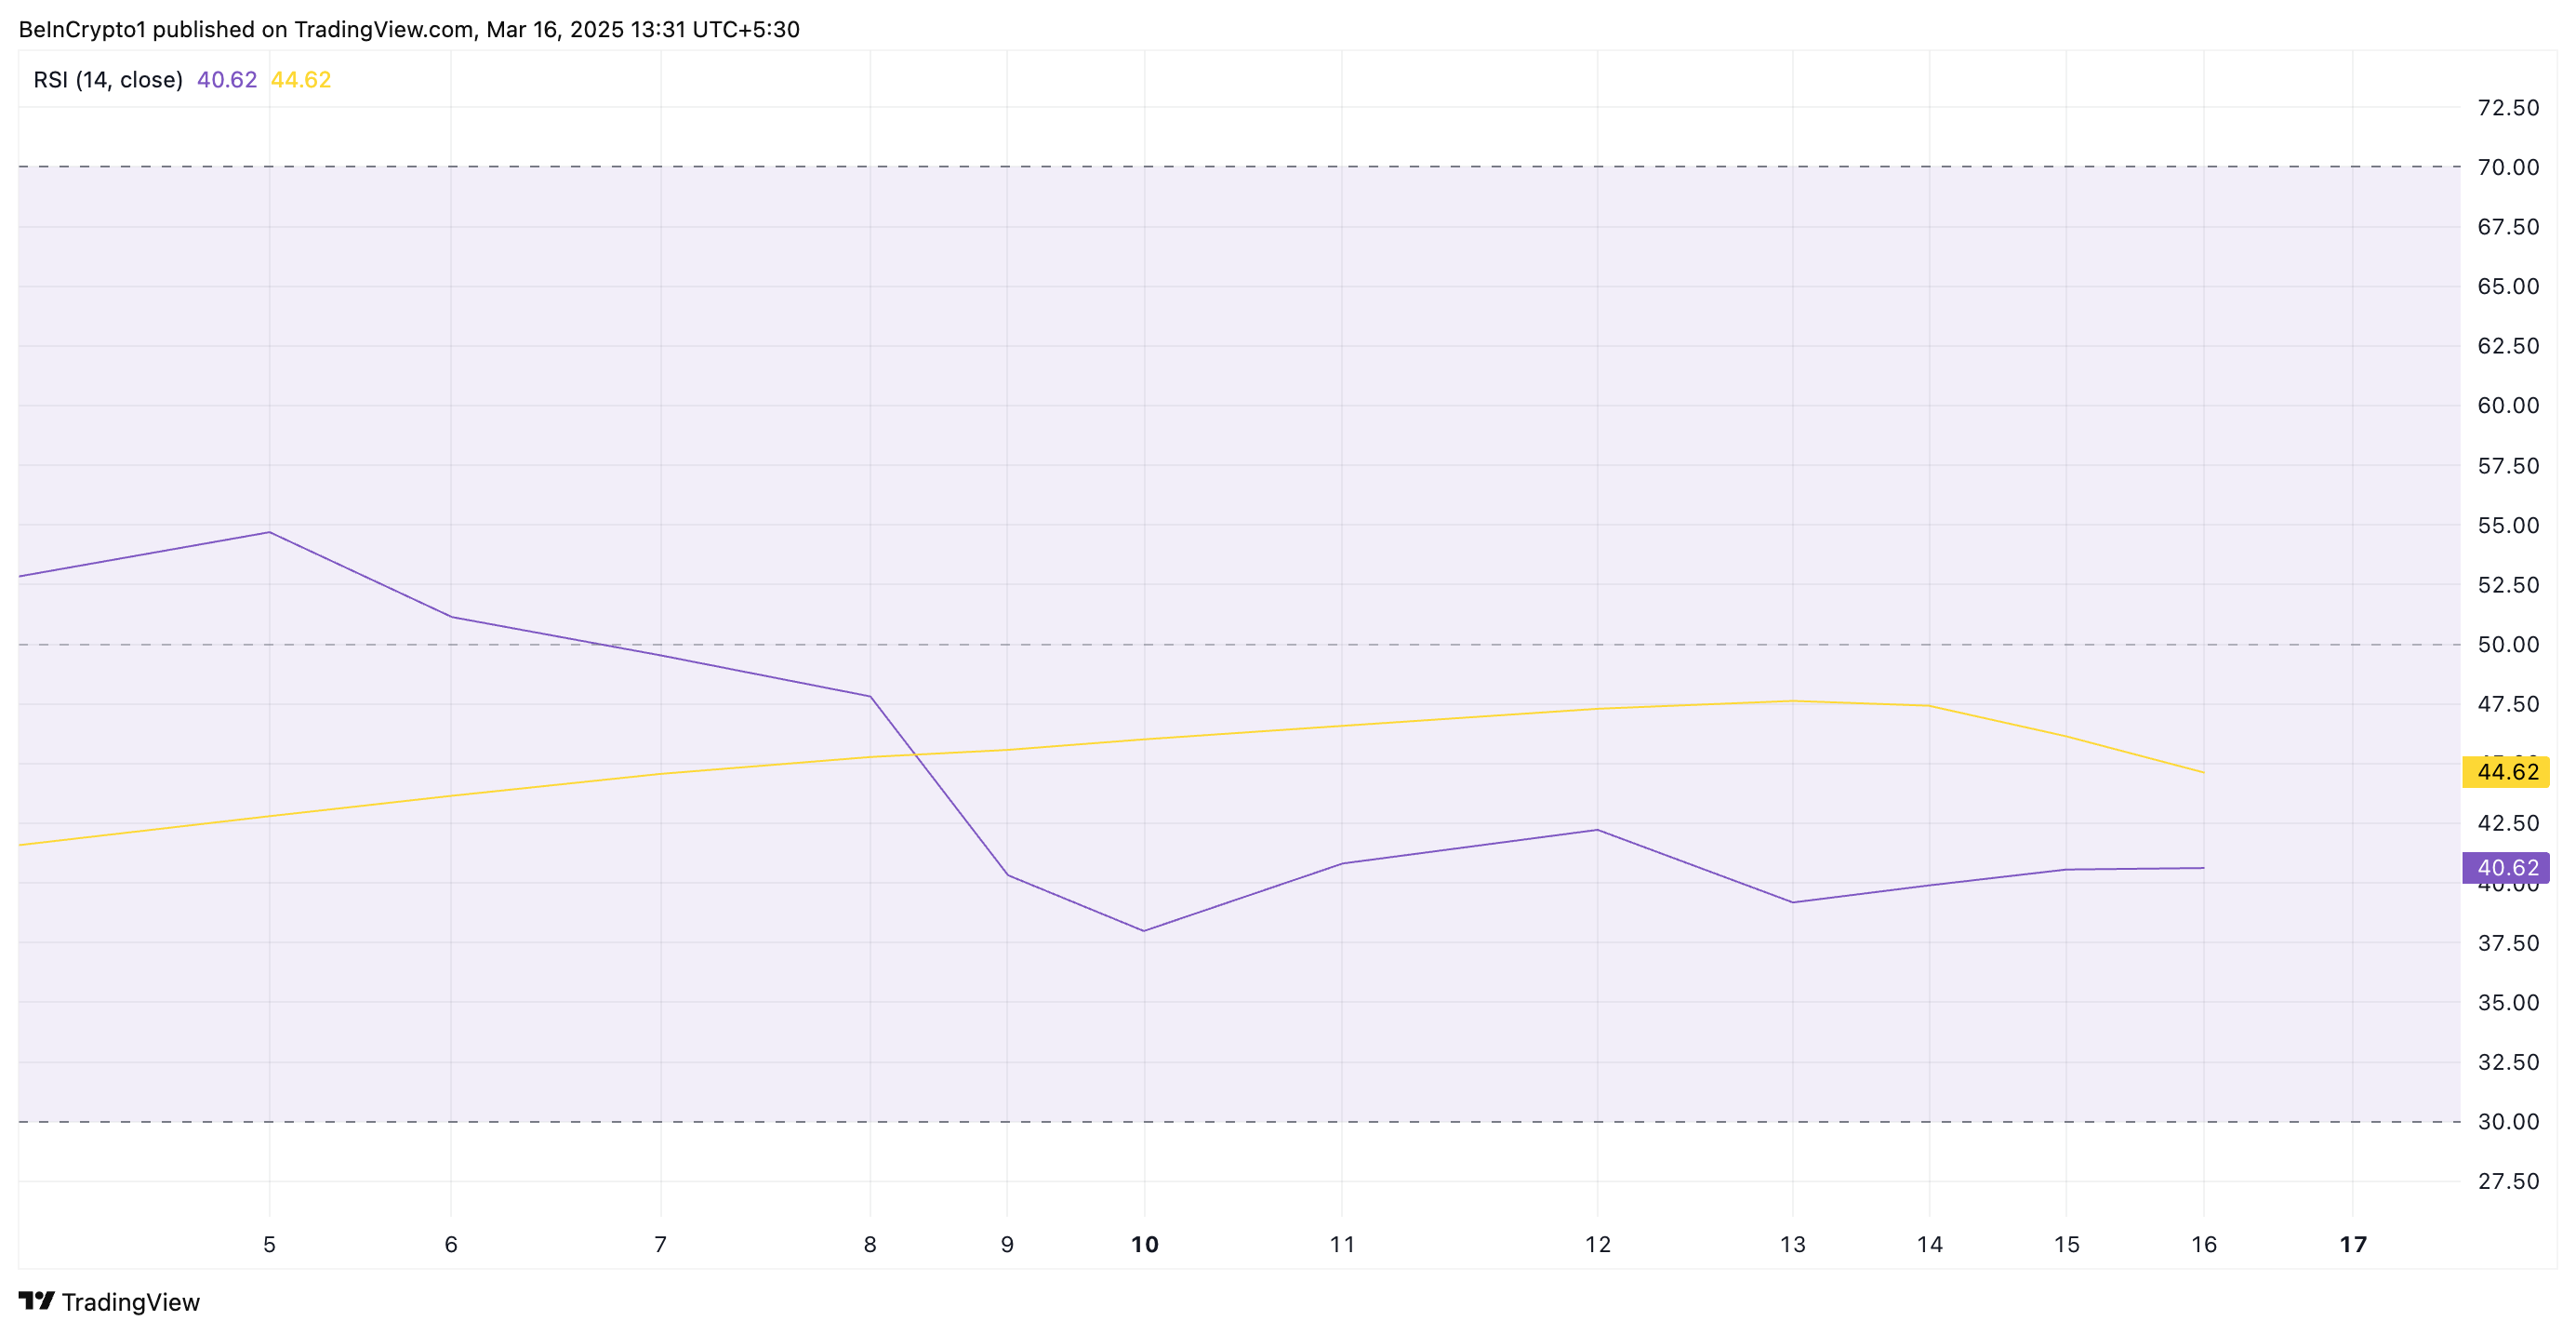
The RSI indicator measures an asset’s overbought and oversold market conditions. It ranges from 0 to 100, with values above 70 suggesting the asset is overbought and potentially due for a correction.
Conversely, RSI values below 30 signal the asset is oversold and may be primed for a rebound.
An RSI of 40.62 suggests that HBAR is in bearish territory but not yet oversold. This indicates that selling pressure is stronger than buying momentum, but there is still room for further decline before the token becomes undervalued.
Additionally, readings from HBAR’s Elder-Ray Index support the bearish outlook. It currently sits at -0.02, marking its seventh consecutive day in negative territory.
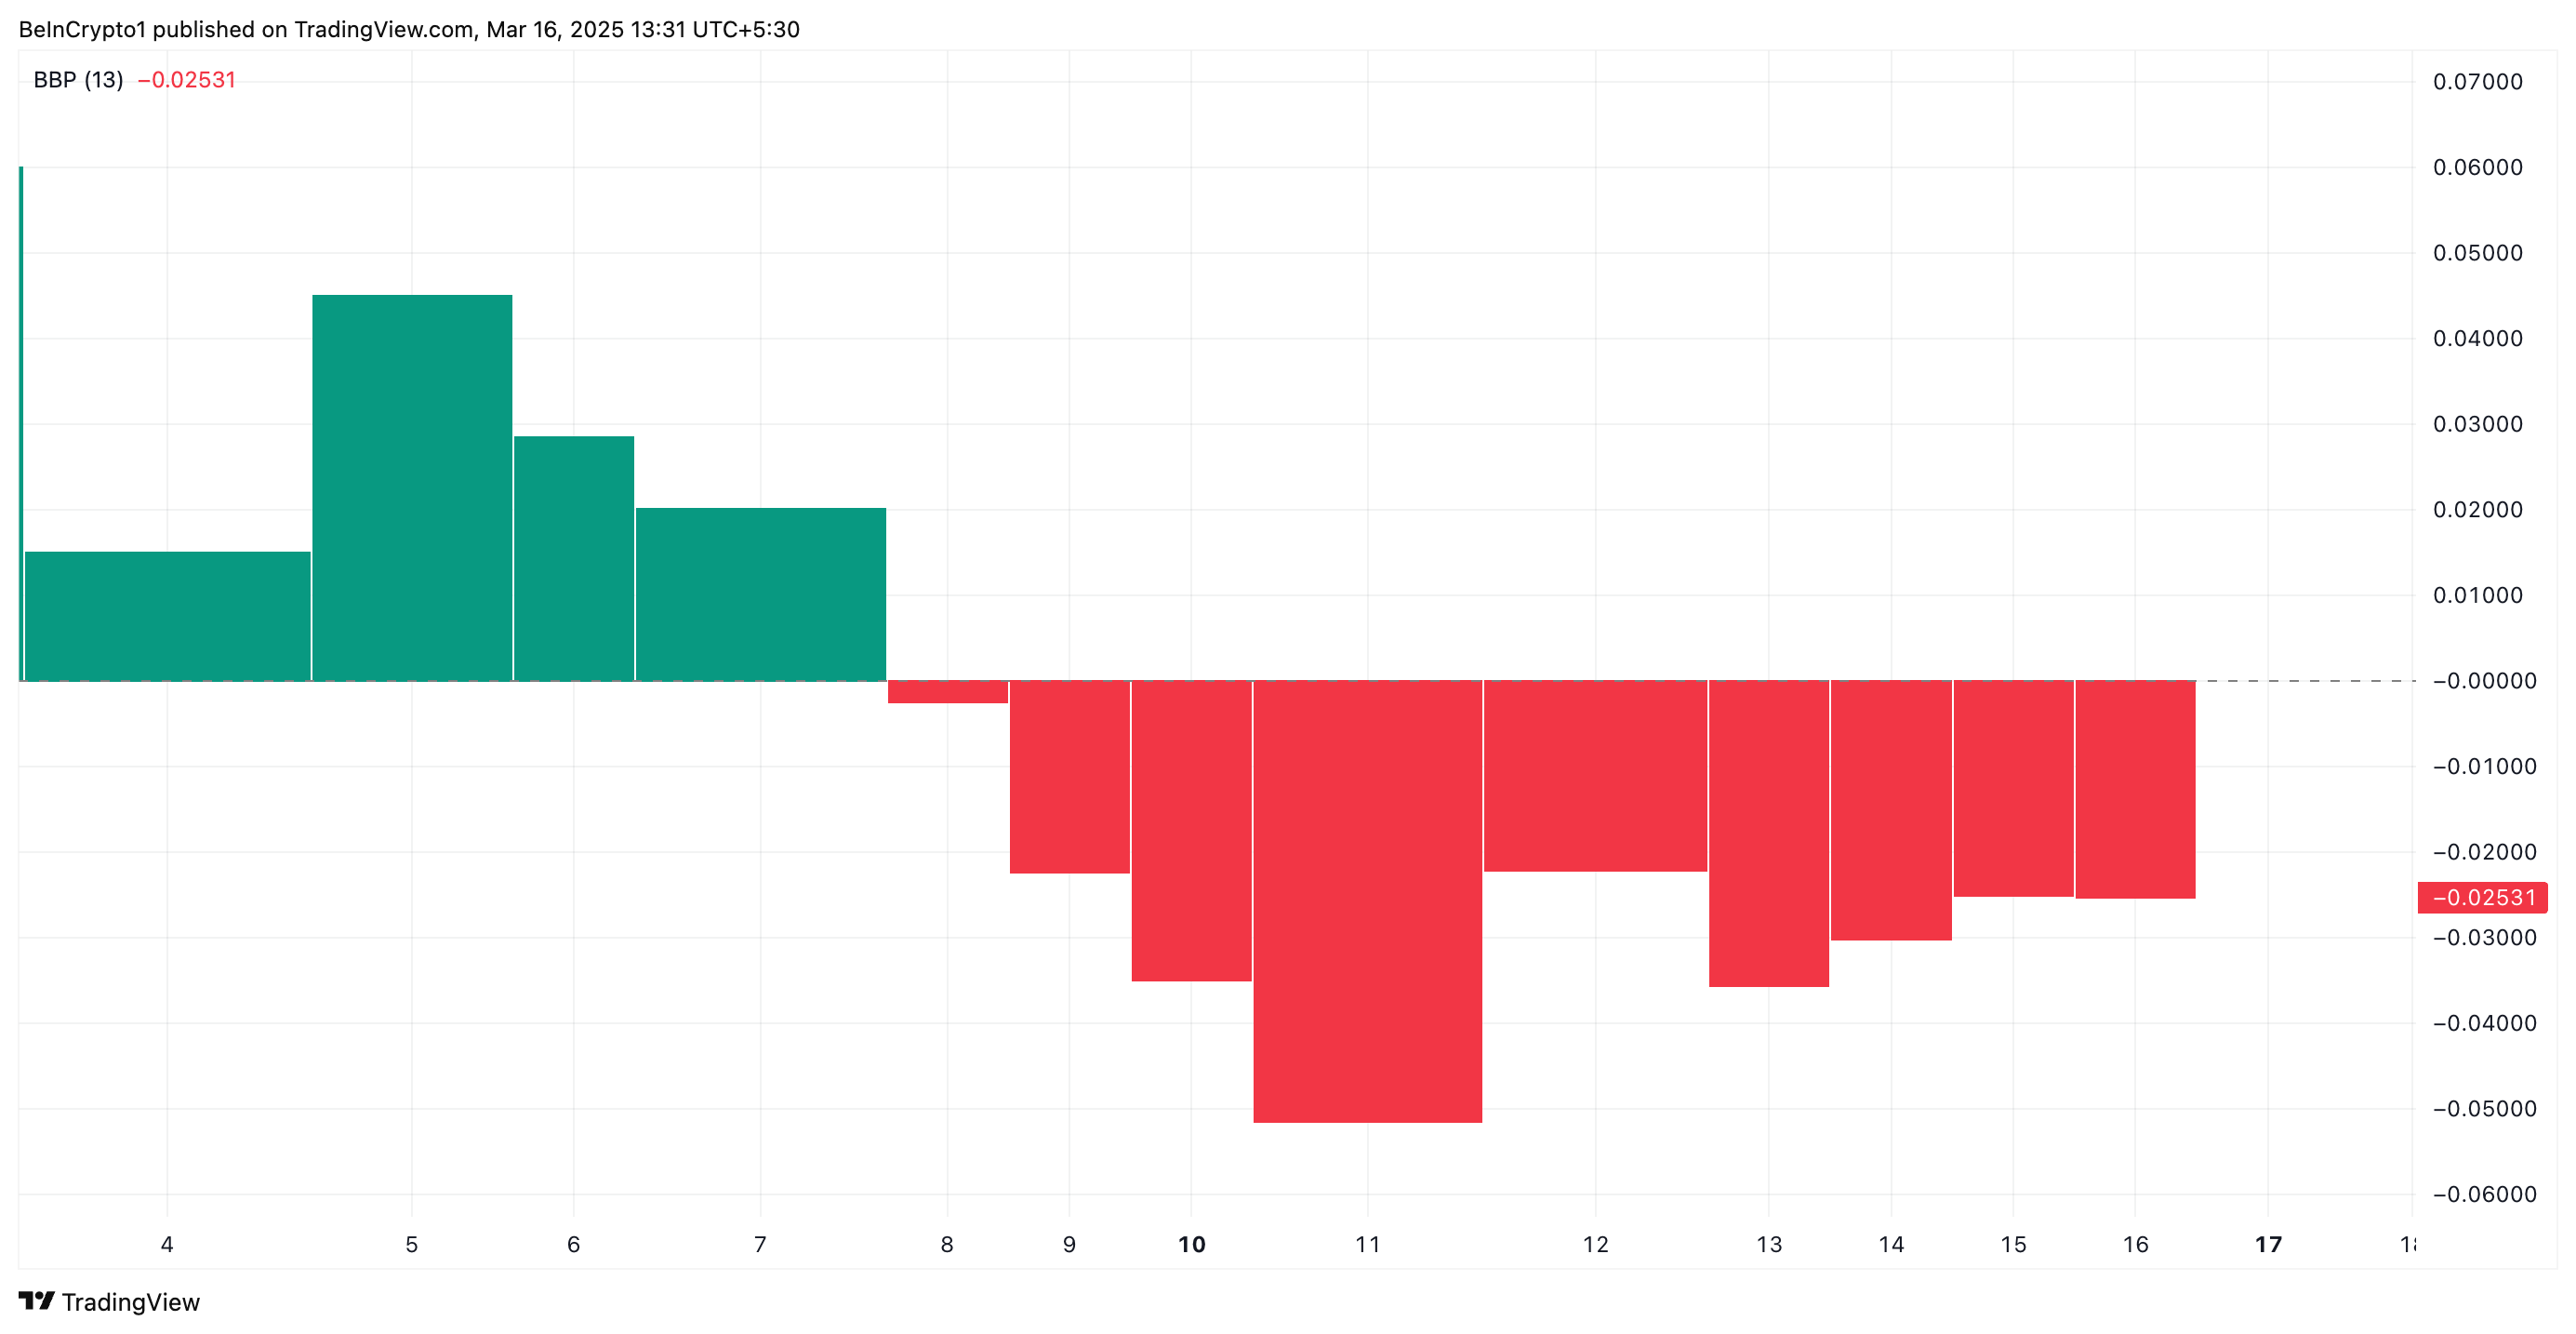
The Elder-Ray Index measures the balance of power between bulls and bears by analyzing the strength of buyers (Bull Power) and sellers (Bear Power).
When the index is negative, it indicates that sellers are in control, pushing prices lower and signaling a bearish trend. HBAR’s consistent negative Elder-Ray Index suggests sustained downward pressure, making a price recovery less likely in the short term.
HBAR Bears Dominate as Descending Channel Points to More Losses
Since it reached its YTD high of $0.40, HBAR has traded within a descending parallel channel, confirming the price decline.
This bearish pattern is formed when an asset’s price moves between two downward-sloping, parallel trendlines, indicating a consistent bearish trend. It suggests that HBAR sellers are dominant, which could lower its price even more.
If demand weakens further, HBAR could fall toward support formed at $0.16, a low it last reached in November.
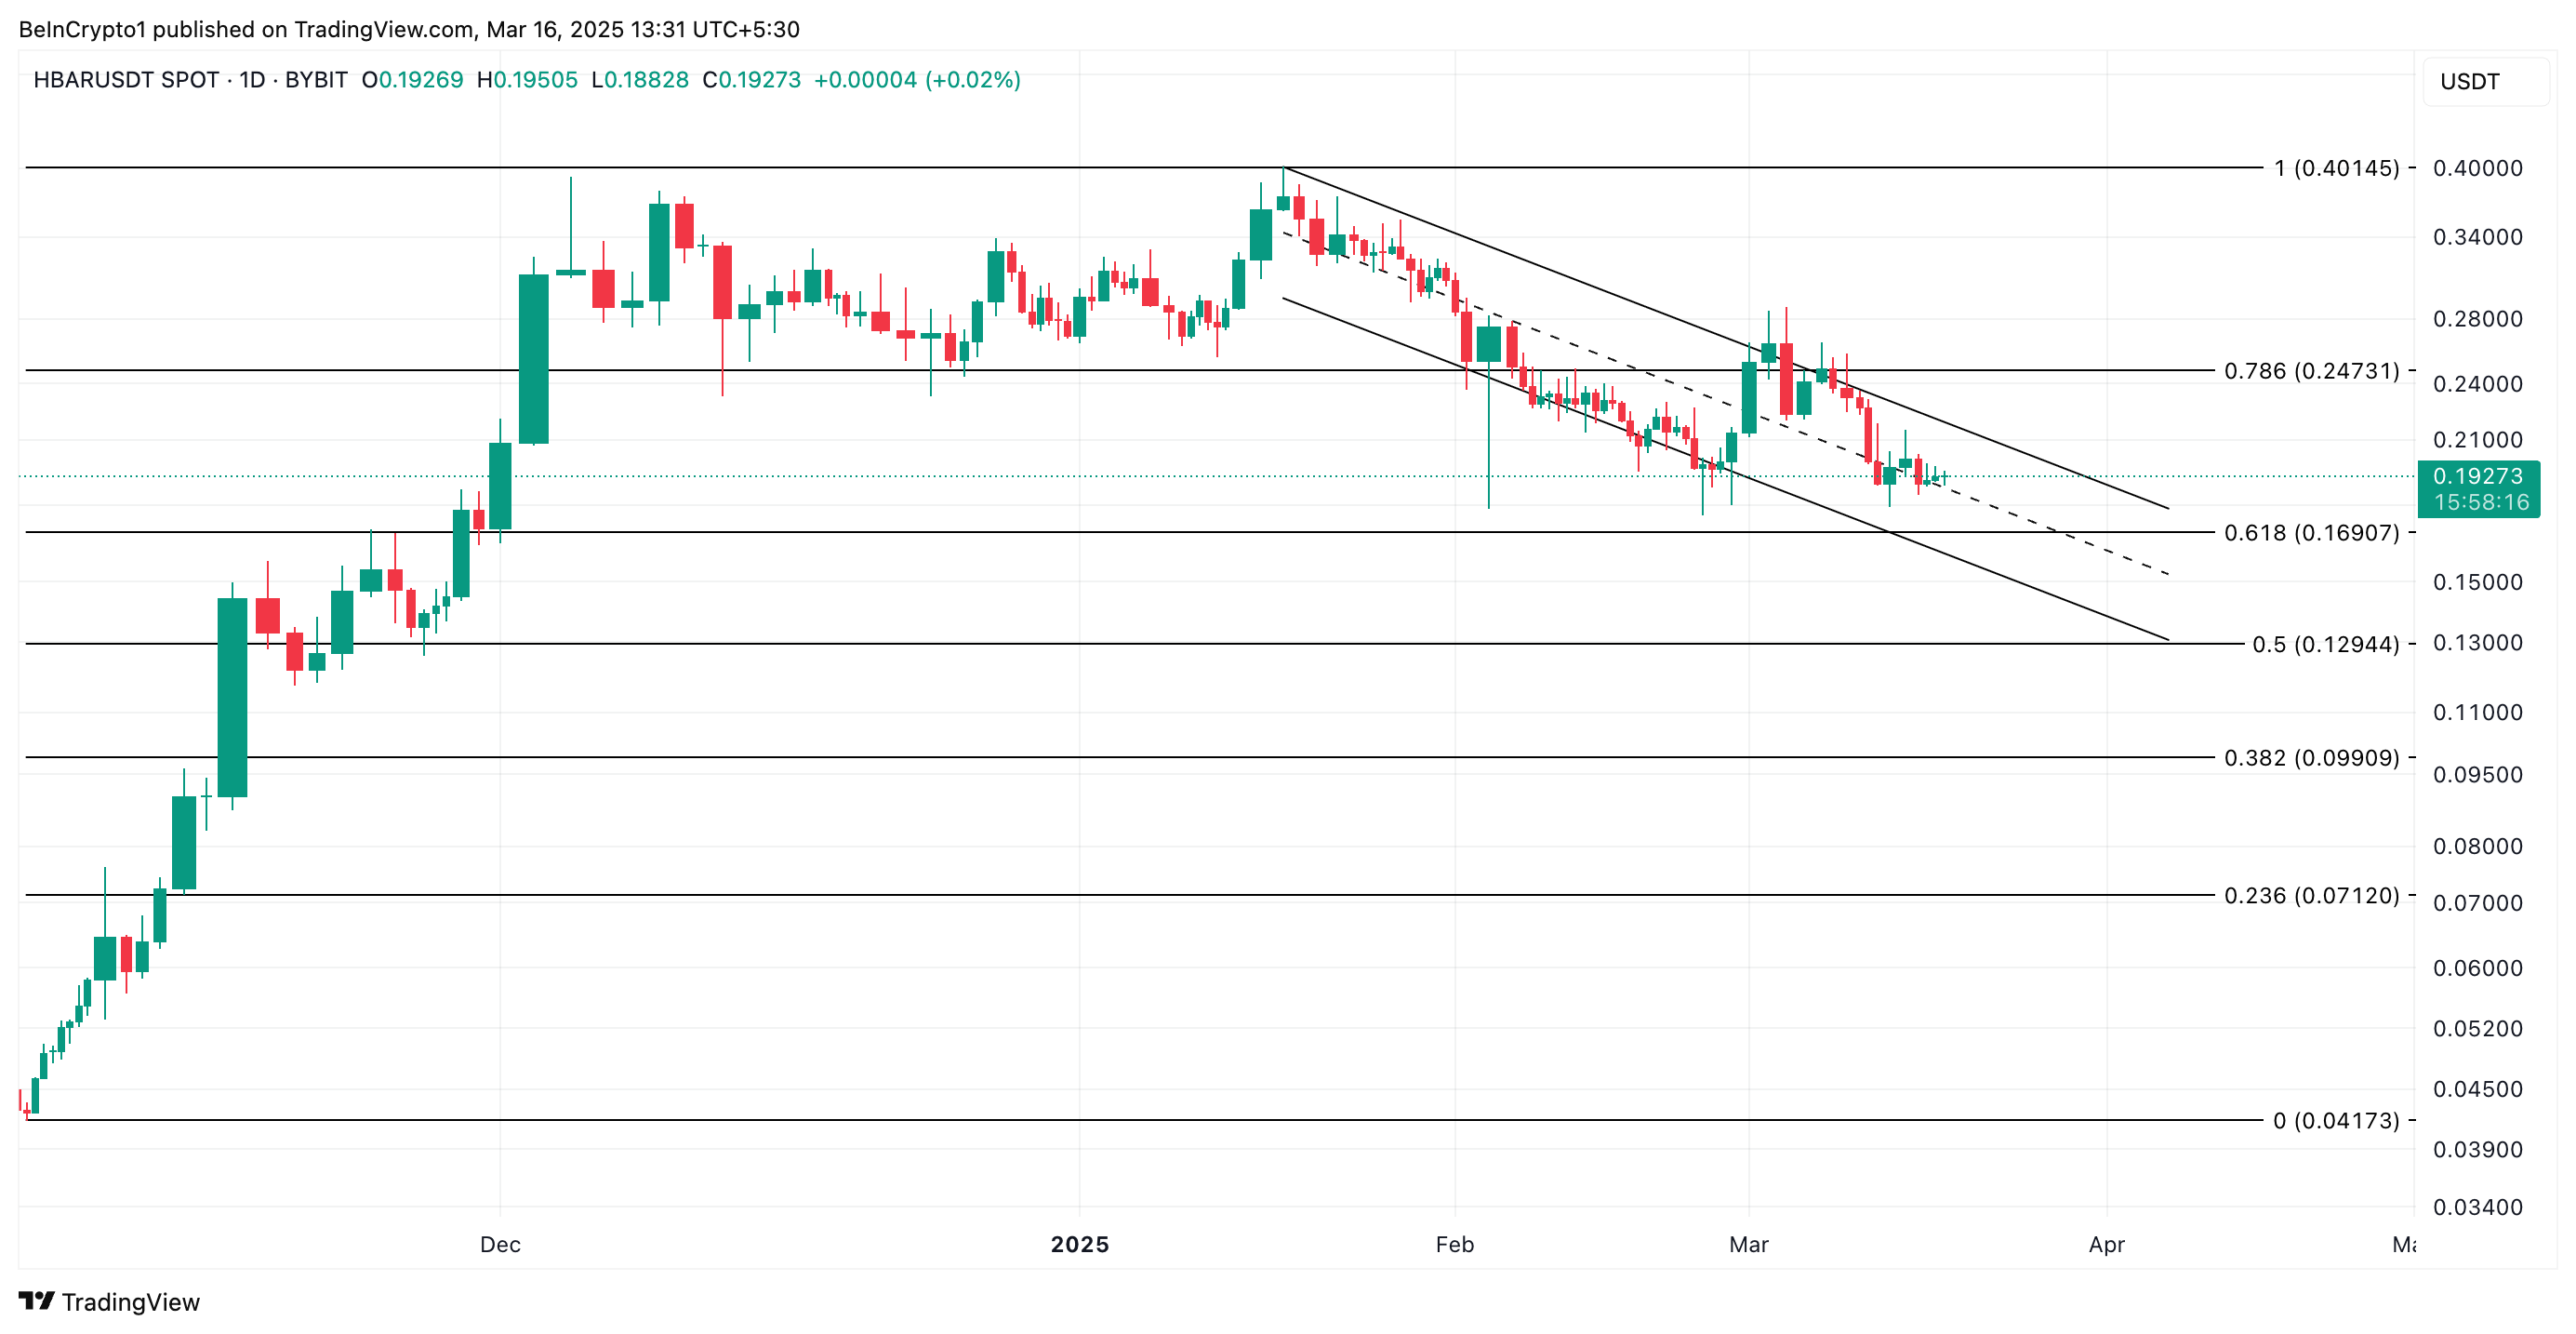
However, a positive shift in market sentiment would prevent this. If HBAR sees a surge in new demand, it could drive its price up to $0.24.



