

HBAR, the native token of the Hedera ecosystem, made a high of $0.1563 in 2024, a few clicks down from our 2024 prediction level. While the broader crypto market rally had much to do with this price rise, we shall consider the wider picture herein. This HBAR price prediction discussion will focus on the Hedera network’s current state and future price action. We delve into the fundamental, on-chain, and price analysis of HBAR to prepare an exhaustive and practical price prediction model.
KEY TAKEAWAYS
➤Hedera Hashgraph’s unique Hashgraph consensus mechanism and enterprise-grade applications position HBAR for significant long-term growth, with a projected high of $13.28 by 2029 and $5.31 by 2028, driven by increasing adoption and strong fundamentals.
➤HBAR powers the Hedera ecosystem with staking, transaction fees, and micropayments, bolstering its utility.
➤While HBAR’s 50 billion supply cap and vesting schedules ensure stability, the founders’ large token share warrants close monitoring.
- Hedera Hashgraph (HBAR’s) long-term price prediction
- HBAR price prediction and technical analysis
- Hedera Hashgraph (HBAR) price prediction 2024 (concluded)
- Hedera Hashgraph (HBAR) price prediction 2025
- Hedera Hashgraph (HBAR) price prediction 2026
- Hedera Hashgraph (HBAR) Price Prediction 2027
- Hedera Hashgraph (HBAR) Price Prediction 2028
- Hedera Hashgraph (HBAR) Price Prediction 2029
- Hedera Hashgraph (HBAR) price prediction 2030
- Hedera fundamentals
- HBAR price forecast and the involved tokenomics
- Is the HBAR model accurate?
- Frequently asked questions
Hedera Hashgraph (HBAR’s) long-term price prediction
If you want to check the HBAR price forecast levels till 2035, the below table sets out the figures.
Year |
Maximum price of HBAR |
Minimum price of HBAR |
2024 |
$0.2696 |
$0.0998 |
2025 |
$0.4187 |
$0.2595 |
2026 |
$1.35 |
$0.57 |
2027 |
$2.36 |
$1.46 |
2028 |
$5.31 |
$4.14 |
2029 |
$13.28 |
$10.35 |
2030 |
$20.71 |
$10.354 |
2031 |
$34.17 |
$26.65 |
2032 |
$46.13 |
$28.60 |
2033 |
$57.66 |
$44.97 |
2034 |
$86.49 |
$67.46 |
2035 |
108.11 |
$84.32 |
Note the average trading price, regardless of the year you choose, can vary from the maximum prices or even the minimum price levels.
HBAR price prediction and technical analysis
Now we have covered the Hedera fundamentals, including the state of the proof-of-stake ecosystem and other insights, it’s time to focus on locating the patterns.
Price changes and patterns
We have plotted the historical chart points related to HBAR, taking insights from 2023 when a discernable pattern showed up. Now that we have all levels from A to C3 of the said pattern, our immediate task is to locate the C3. For that, we will create three tables that trace the average price percentage moves and days taken by HBAR to complete the three A-B-C paths.
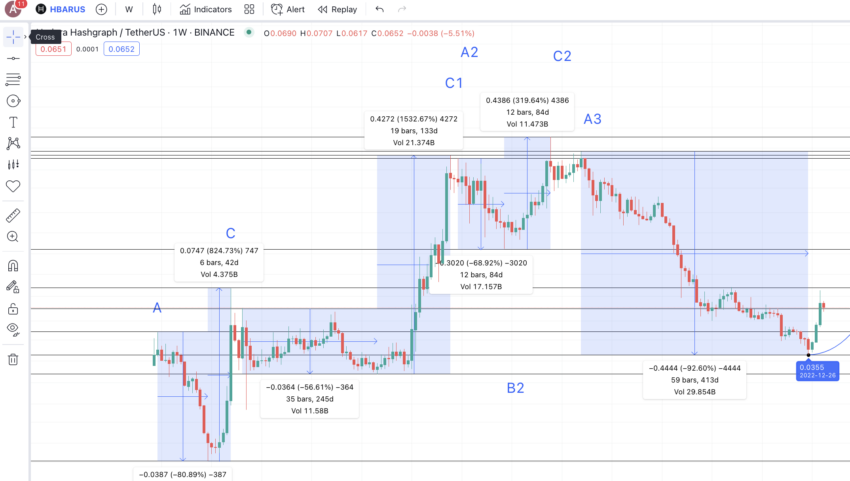
Parameters |
A to B |
B to C |
Days |
91 |
42 |
% change |
-80.89 |
824.73 |
A1 to C1
Parameters |
A1 to B1 |
B1 to C1 |
Days |
245 |
133 |
% change |
-56.61 |
1532.67 |
A2 to C2
Parameters |
A2 to B2 |
B2 to C2 |
Days |
84 |
84 |
% change |
-68.92 |
319.64 |
Finally, the A3 to B3 values are 413 days and -92.60% for calculation purposes. Thus, the average high-to-low percentage drop and time taken are calculated as 74.75% and 208 days, respectively, using all A to B levels up to B3.
Similarly, the average low-to-high hike and time taken are 892.35% and 86 days, respectively. However, in scenarios where the crypto market shows weaker trends, we can consider the minimum percentage hike of 319.64% and the maximum duration of 133 days.
Hedera Hashgraph (HBAR) price prediction 2024 (concluded)
With B4 at $0.0643, the next high, or C4, followed the minimal gain percentage of 319.64% and surfaced in 133 days. This put the 2024 high at $0.2696, aligning with our 2024 price prediction.
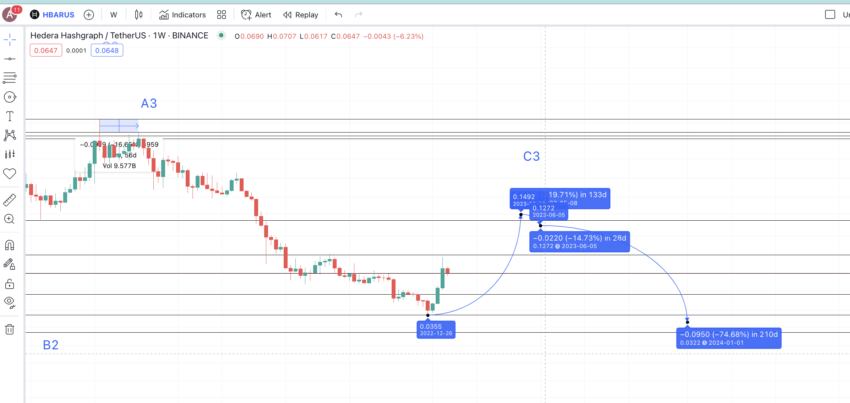
The next level surfaced at a drop of 14.81%, using table 4. This level surfaced at $0.2299, which was the immediate low post the 2024 high.
Hedera Hashgraph (HBAR) price prediction 2025
Outlook: Bullish
From this level or A5, we can use locate the next low or B5 in 208 days and at a minimum drop percentage of 56.61% — using table 2. This puts the minimum price of HBAR in 2024 at $0.0998. The next high or the price of HBAR in 2025 could be at $0.4187 — using the minimum percentage hike and 133 days as the maximum timeframe.
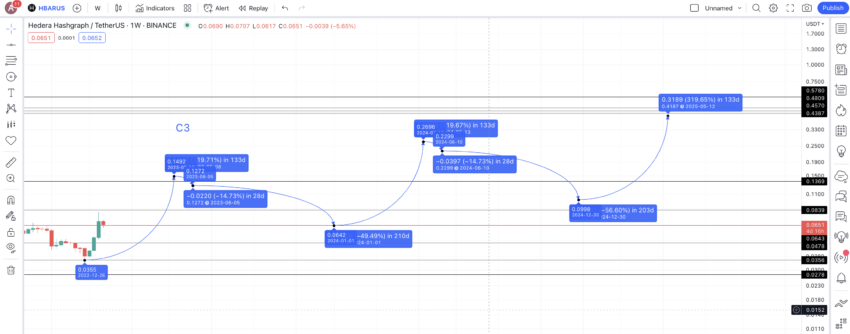
Projected ROI from the current level: 382%
Hedera Hashgraph (HBAR) price prediction 2026
Outlook: Bullish
With the foundation laid by the significant growth observed in 2025, 2026 is expected to see continued expansion. The predicted high of $1.35 is based on historical patterns where substantial gains follow market consolidation phases.
If the market conditions remain favorable and Hedera’s ecosystem developments keep pace, the price could steadily rise. The minimal predicted price drop to $0.57 suggests strong support levels formed from previous highs and increased institutional adoption.
Hedera Hashgraph (HBAR) Price Prediction 2027
Outlook: Bullish
The growth trajectory for 2027 builds on the momentum from 2026. With further advancements in blockchain technology and broader adoption, the HBAR token could reach a high of $2.36.
This price level takes into account the historical price movements and the expected increase in transaction volumes and network usage. The minimum price of $1.46 reflects a strong bullish trend, supported by continued investor confidence and strategic partnerships within the blockchain space.
Hedera Hashgraph (HBAR) Price Prediction 2028
Outlook: Bullish
By 2028, Hedera Hashgraph is expected to benefit from the maturity of its platform and increased integration across various industries. The predicted high of $5.31 aligns with the long-term growth patterns observed in similar blockchain projects.
This period might see Hedera reaching new technological milestones and expanding its user base. The minimum price of $4.14 indicates market support and resilience, driven by consistent network improvements and broader market adoption.
Hedera Hashgraph (HBAR) Price Prediction 2029
Outlook: Bullish
The outlook for 2029 suggests a period of significant growth, potentially driven by the widespread adoption of decentralized applications on the Hedera network.
The predicted high of $13.28 considers the cumulative effects of technological advancements, regulatory clarity, and increased market penetration. The projected minimum price of $10.35 highlights the sustained demand and strong foundational support, reflecting the token’s increasing utility and acceptance.
Hedera Hashgraph (HBAR) price prediction 2030
Outlook: Bullish
We can mark this point as C5. And from C5, we can plot the next A or A6 using the 30-day timeframe and a drop of 14.81%. The drop from A6 can take support at $0.1369 in 208 days.
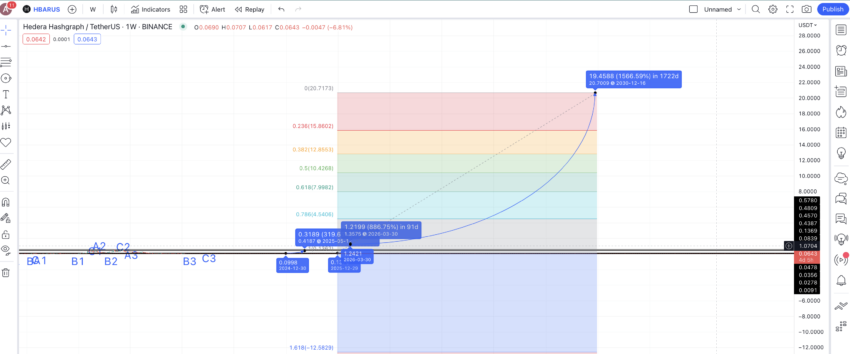
Projected ROI from the current level: 23759%
Hedera fundamentals
For starters, Hedera is an enterprise-grade ecosystem for businesses and individuals. Focused on smart contracts, this decentralized network can power DApps for enterprises and businesses — making it highly relevant and fundamentally strong.
“Our developer tools are designed to empower you. We provide the platform; you bring the vision to life.
Hedera is more than technology; it’s a vibrant community of thinkers and creators shaping the future.”
Charles Adkins, President of Hedera: X
Coming to the consensus, the Hedera network features the proprietary Hashgraph consensus. This proof-of-stake-inspired novel consensus mechanism eliminates slowness whilst keeping the security quotient intact. But that’s not all that the proof-of-stake-based Hashgraph consensus promises. It also:
- Supports high-volume transactions and processes.
- Supports micropayments and tokenization — making it a good bet for enterprises.
- This public network has an exhaustive list of investors.
HBAR, its native token, is primarily meant for powering the entire ecosystem. Using HBAR, participants can pay for micropayments and transaction fees. Plus, network participants can use the HBAR tokens for staking, which adds a thing or two to the overall network security. And finally, HBAR is also used for paying staking rewards to the nodes.
Did you know? Hedera is based on the novel Hashgraph technology that can process transactions securely and quickly. This technology can handle thousands of transactions at once.
Inference: As a project, Hedera Hashgraph looks resilient enough. And its native token comes with a host of utilities, making us more optimistic about the future price of the same.
HBAR price forecast and the involved tokenomics
HBAR, the native token of this public network, has a 50 billion supply cap. The initial supply breakdown chart shows that only 17.45% went to the investors, whereas over 80% of the fixed supply belongs to the founders/project.
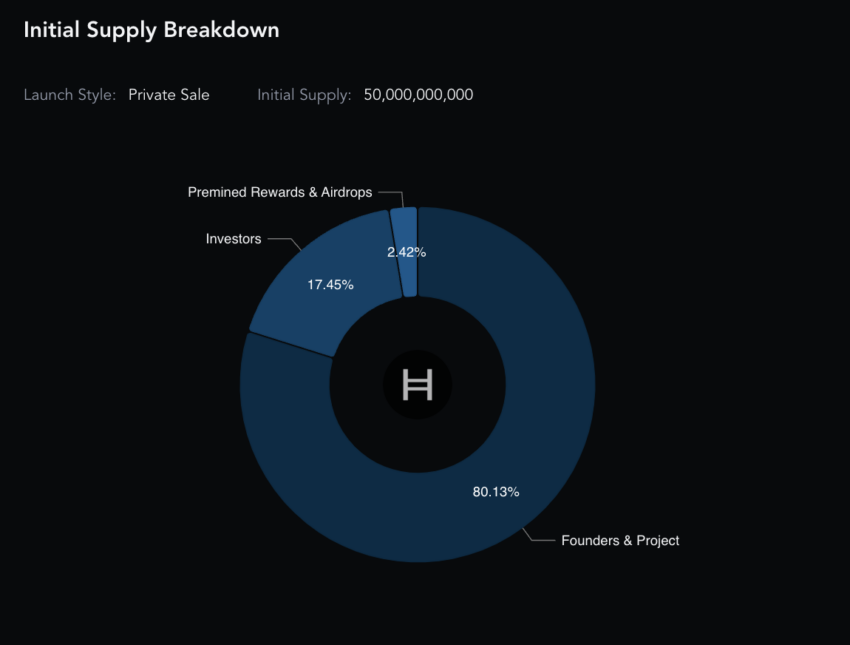
While the supply cap looks promising, founders holding most of the supply is slightly disconcerting. However, a defined vesting period is in place to avoid market-wide sell-offs.
“Hedera’s implementation of a distributed ledger technology, utilizing the Hashgraph algorithm, allows for a high level of network transparency by maintaining a tamper-evident record of transactions on the network.”
Charliexfi, Crypto Analyst: X
More about the HBAR ecosystem:
Is the HBAR model accurate?
Hedera Hashgraph involves many technical elements. These include smart contracts for improving the public network and a novel hashgraph consensus. This HBAR price prediction model considers all these elements whilst forming a detailed technical analysis to ascertain the future price of the HBAR token. Therefore, this price forecast model is practical and realistic. Plus, as it is based on a lot of historical data, the price prediction model even aligns with the market sentiments.
Disclaimer: This analysis is specific to Hedera Hashgraph (HBAR) and is intended for informational purposes only. Predictions are based on historical data, technical analysis, and current market conditions, which are subject to fluctuations. The value of HBAR is influenced by market trends, adoption of its unique consensus mechanism, and the growth of its ecosystem. Cryptocurrency investments, including HBAR, involve significant risk and potential volatility. Always conduct your own research (DYOR) and consult a financial advisor before making any investment decisions.
Frequently asked questions
What is HBAR worth in 2025?
What was HBAR’s highest price?
Will Hedera reach $1?
Who is invested in HBAR?
Why is HBAR unique?
Disclaimer
In line with the Trust Project guidelines, the educational content on this website is offered in good faith and for general information purposes only. BeInCrypto prioritizes providing high-quality information, taking the time to research and create informative content for readers. While partners may reward the company with commissions for placements in articles, these commissions do not influence the unbiased, honest, and helpful content creation process. Any action taken by the reader based on this information is strictly at their own risk. Please note that our Terms and Conditions, Privacy Policy, and Disclaimers have been updated.


