


After months of upward movement, the U.S. dollar index (DXY) may have peaked and initiated a downtrend. In early August, the DXY broke down from its long-term, exponential upward curve, while yesterday it lost another support line that extends to March 2022.
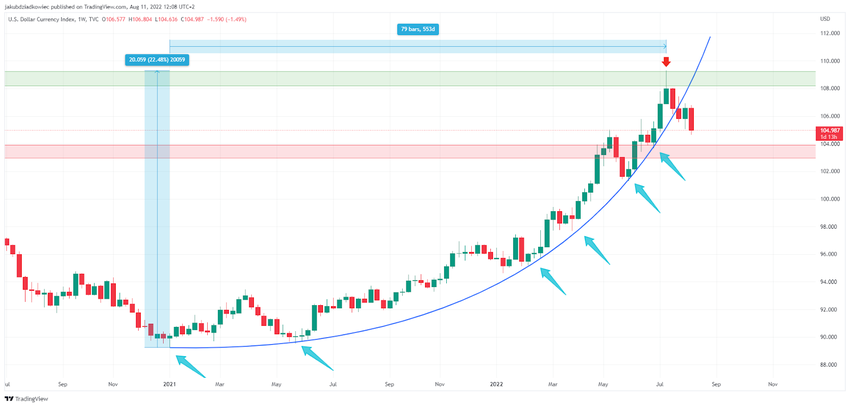
The U.S. dollar index bottomed at 89 on January 6, 2021. Since then, it has generated a bullish double-bottom pattern once again hitting the 89.5 level on May 25, 2021.
The DXY then initiated a long-term uptrend that took it to the 109 level on July 14, 2022. The upward movement lasted for 553 days and led to an increase of 22.5%. Moreover, it appears to have run along a parabolic uptrend line, which has been repeatedly validated (blue arrows).
Initially, it seemed that the parabola was broken back in May 2022, when the U.S. dollar index reached an important resistance level in the 103-104 range (red area). However, after a small correction, the DXY continued to rise, reaching another resistance area in the 108-109 range (green area).
The peak was reached with the formation of an inverted hammer candle (red arrow), which often signals a bearish trend reversal. Subsequent weeks led to declines and currently, the U.S. dollar index sits at 105. The break from the exponential uptrend line occurred in early August. If the declines cannot be stopped and a higher-order parabola will not be formed, it is possible that the DXY has already reached a long-term peak.
Technical indicators
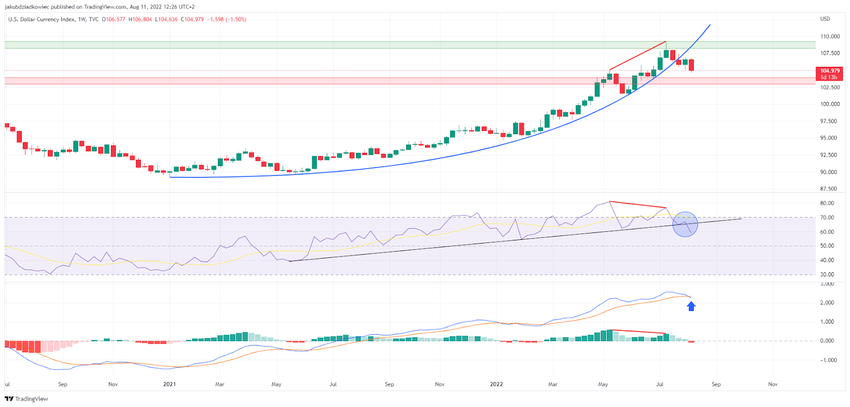
Weekly technical indicators seem to confirm the possibility of the start of a downtrend. The RSI has broken down from a long-term support line (blue circle) that dates back to May 2021, when the U.S. dollar index began its uptrend.
Moreover, the RSI generated a clear bearish divergence between May-July 2022 (red line). Such divergence usually precedes a trend reversal, especially since it occurs on a high interval.
The same bearish divergence can also be seen on the MACD. In addition, this indicator is in the process of generating a bearish cross (blue arrow) and the first red momentum bar since February.
DXY loses yet another support line
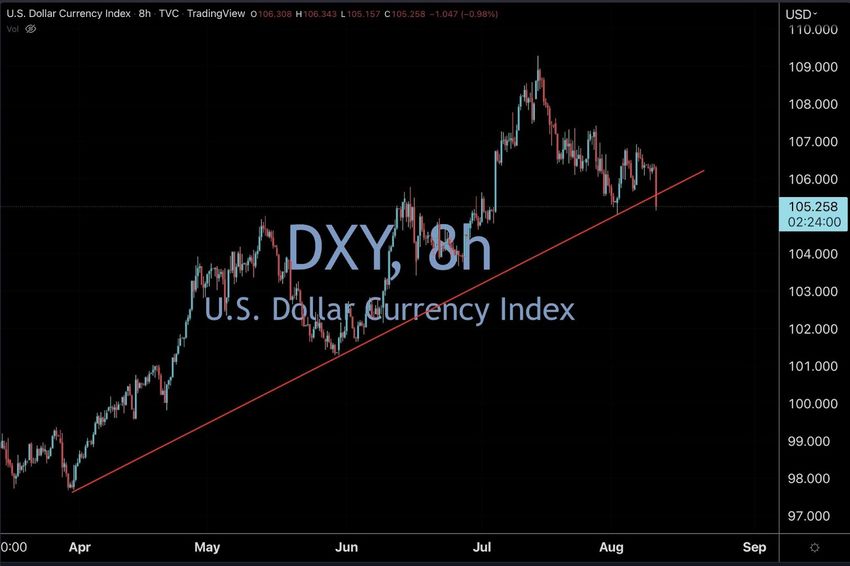
Technical analyst @jclcapital published an 8-hour chart of the DXY yesterday, in which he drew another support line. This straight line goes back to the end of March 2022 and has provided support since then. However, it seems that yesterday the U.S. dollar index clearly collapsed below this line, thus losing another line of support.
One of the reasons the DXY has fallen so sharply over the past 24 hours is the moderately positive inflation data in the United States. According to the CPI report released yesterday, July’s CPI was lower than the month before, with inflation falling from 9.1% to 8.5%. This, in turn, lowers market expectations for interest rate increases and ultimately weakens the dollar.
Moreover, the U.S. dollar index has a long-term negative correlation with Bitcoin (BTC). Therefore, it can be expected that if the bullish trend of the DXY has come to an end, a recovery in the cryptocurrency market will soon follow.
For Be[In]Crypto’s latest Bitcoin (BTC) analysis, click here.


