

Bitcoin (BTC) has bounced at a confluence of support levels and potentially completed its short-term drop.
BTC has been increasing inside an ascending parallel channel since Jan 24. The increase has so far led to a high of $48,189 on March 28.
While the price has been decreasing since, it bounced at a confluence of support levels on April 1 (green icon). The support is found at $44,450, an area that previously had acted as resistance four times (red icons). It is likely that the area has now turned to support.
In addition to this, the area coincides with the middle of the ascending parallel channel.
If the BTC upward movement continues after this bounce, the closest resistance would be at $51,000. This is the 0.5 Fib retracement resistance level when measuring from the all-time high price. Furthermore, it is a horizontal resistance area and coincides with the resistance line of the parallel channel.

Short-term BTC movement
The two-hour chart shows that BTC has bounced at the 0.382 Fib retracement support level when measuring the most recent portion of the upward movement.
This is also a short-term horizontal support area.
Furthermore, the two-hour RSI has fallen to 25. This is an oversold value, and the last time it was reached was on March 14 (green circle).
At the time, the price initiated a significant upward movement that led to the current highs.

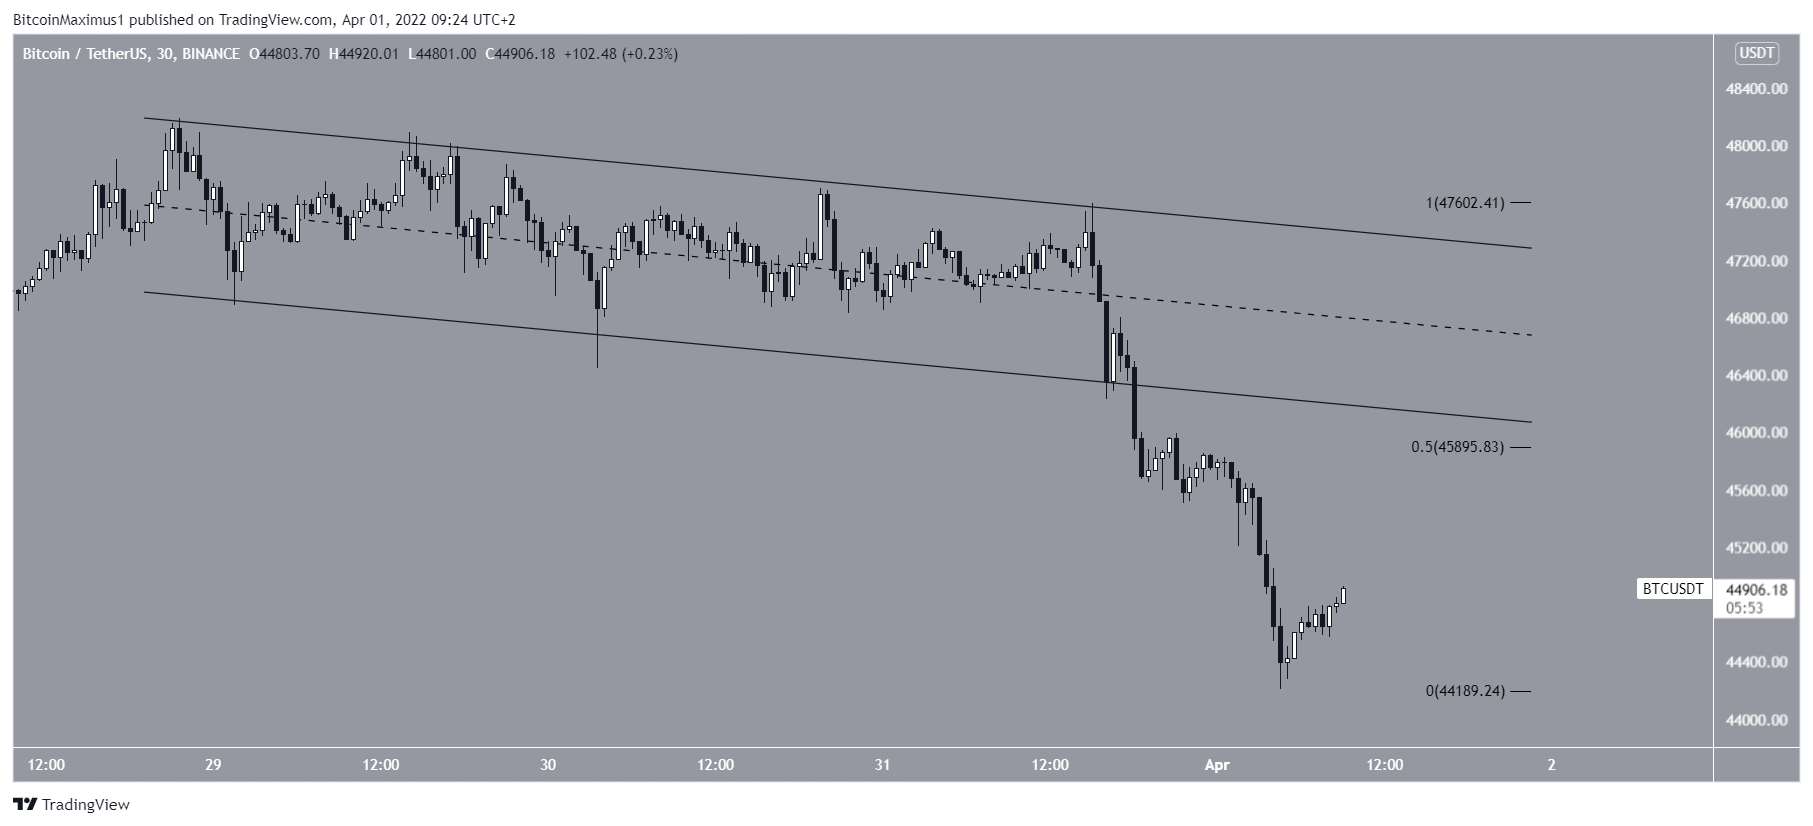
If BTC bounces, there would be resistance at $45,900. This is the 0.5 Fib retracement resistance level and coincides with the support line of the previous descending parallel channel.
If reclaimed it would go a long way in confirming that the correction is complete.
Wave count analysis
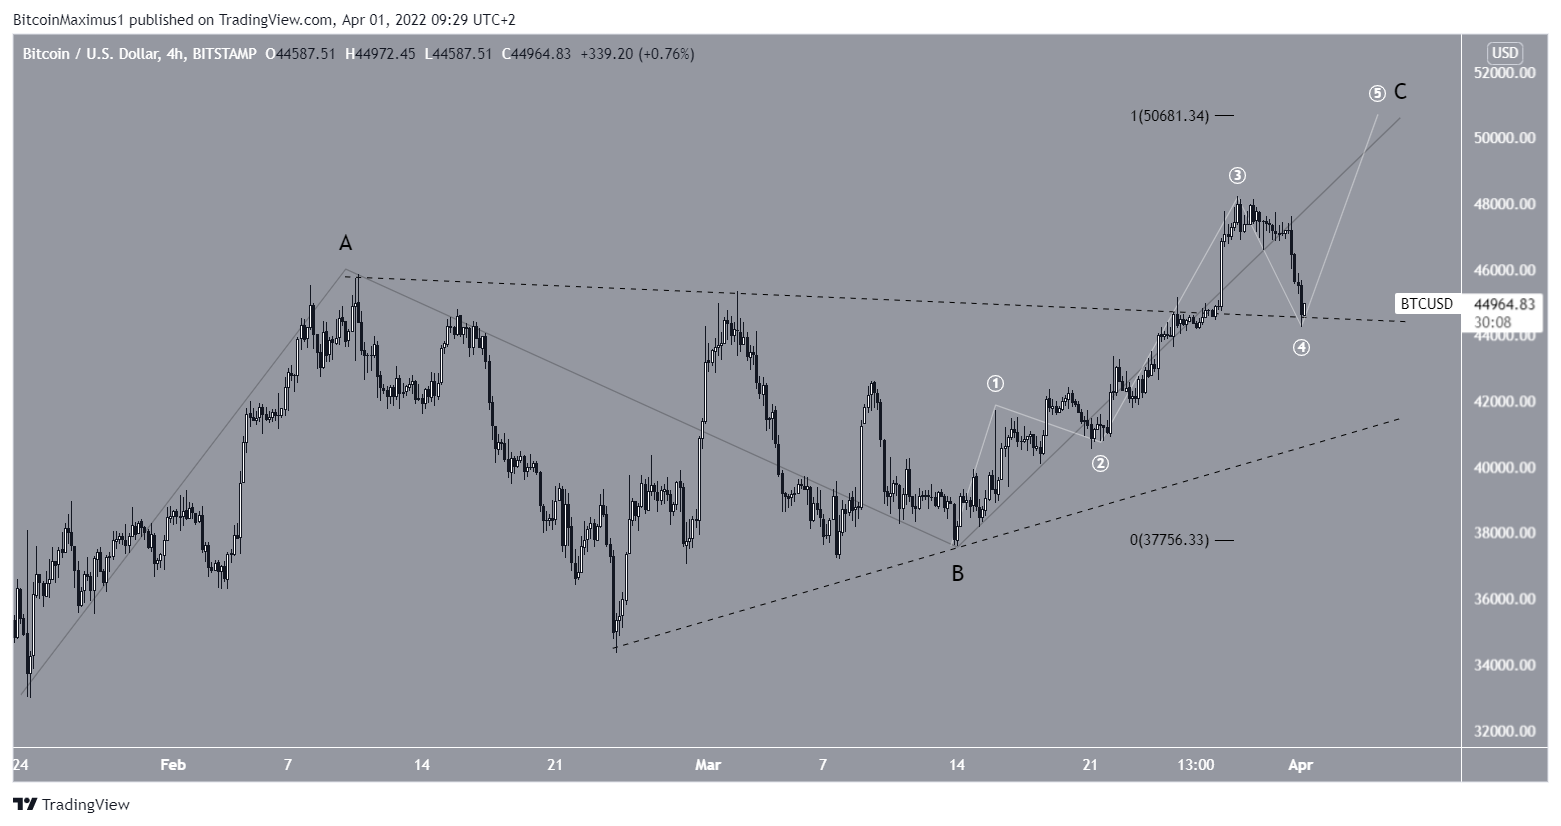
The wave count suggests that BTC is in wave C of an A-B-C structure (black).
The sub-wave count is given in white and indicates that the price has just completed sub-wave four.
Therefore, wave five is expected to take the price all the way to $50,600. This would give waves A:C a 1:1 ratio and would be very close to the previously outlined $51,000 resistance area.
For Be[in]Crypto’s previous Bitcoin (BTC) analysis, click here
Trusted
Disclaimer
In line with the Trust Project guidelines, this price analysis article is for informational purposes only and should not be considered financial or investment advice. BeInCrypto is committed to accurate, unbiased reporting, but market conditions are subject to change without notice. Always conduct your own research and consult with a professional before making any financial decisions. Please note that our Terms and Conditions, Privacy Policy, and Disclaimers have been updated.
