


BeInCrypto breaks down some of the best altcoin movers of last week. Will their momentum continue?
The UNI altcoin is very close to reaching an all-time high price and should do so shortly. Both FTM and ALPHA have reached new all-time highs but are likely approaching or have reached a local top.
AAVE has been consistently reaching new highs since Nov. 2020 but has begun to show the first signs of weakness, making its position the most precarious of the five coins listed.
While CRV is also showing signs of weakness, its rally is not nearly as parabolic as that of AAVE, and there is significant support below the current price. This will likely mitigate the effects of a downward move.
Biggest Altcoin Gainers
During the week of Jan 18-25, the five altcoins that rallied the most were:
- Fantom (FTM) – 178%
- Alpha Finance Lab (ALPHA) – 137%
- Uniswap (UNI) – 63%
- Aave (AAVE) 41.27%
- Curve Dao Token (CRV) – 35.70%
CRV was also in last week’s top gainers, sitting in third place with weekly gains of 154%.
1. FTM
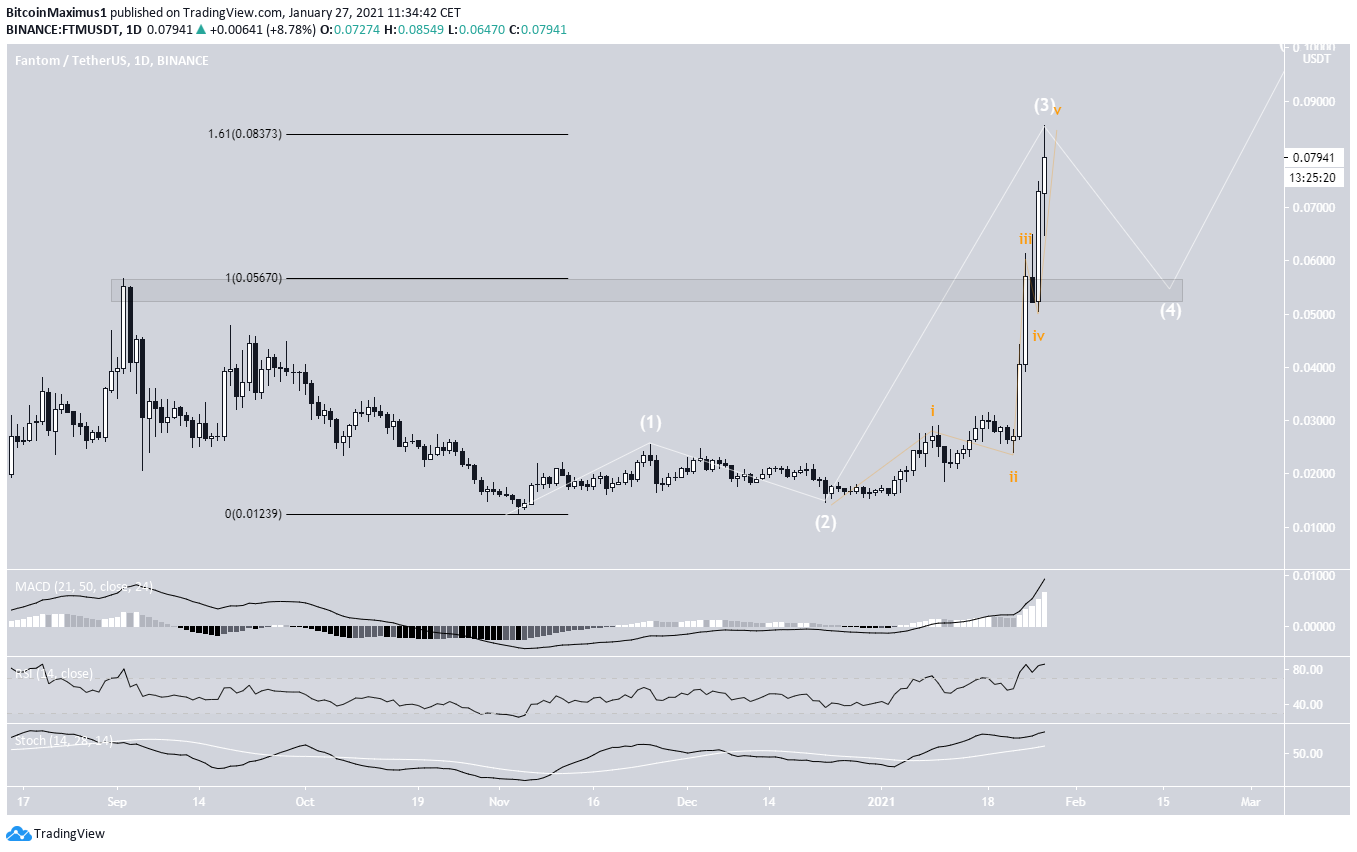
On Jan. 25, the altcoin FTM reached a high of $0.0649, a new all-time high. It moved slightly above that on Sept.2, 2020. FTM has been rallying after validating the breakout level at $0.055, so far touching a high of $0.085.
The high is close to the 1.61 external fib retracement of the previous downward movement, suggesting a possible local top. However, the wave count (white) suggests that another high is likely after a possible decline that again validated the breakout level.
Technical indicators are also bullish, supporting the hypothesis that FTM is still in an upward trend. While wave 3 may extend a little higher, it seems that FTM is approaching a local top.
2. ALPHA
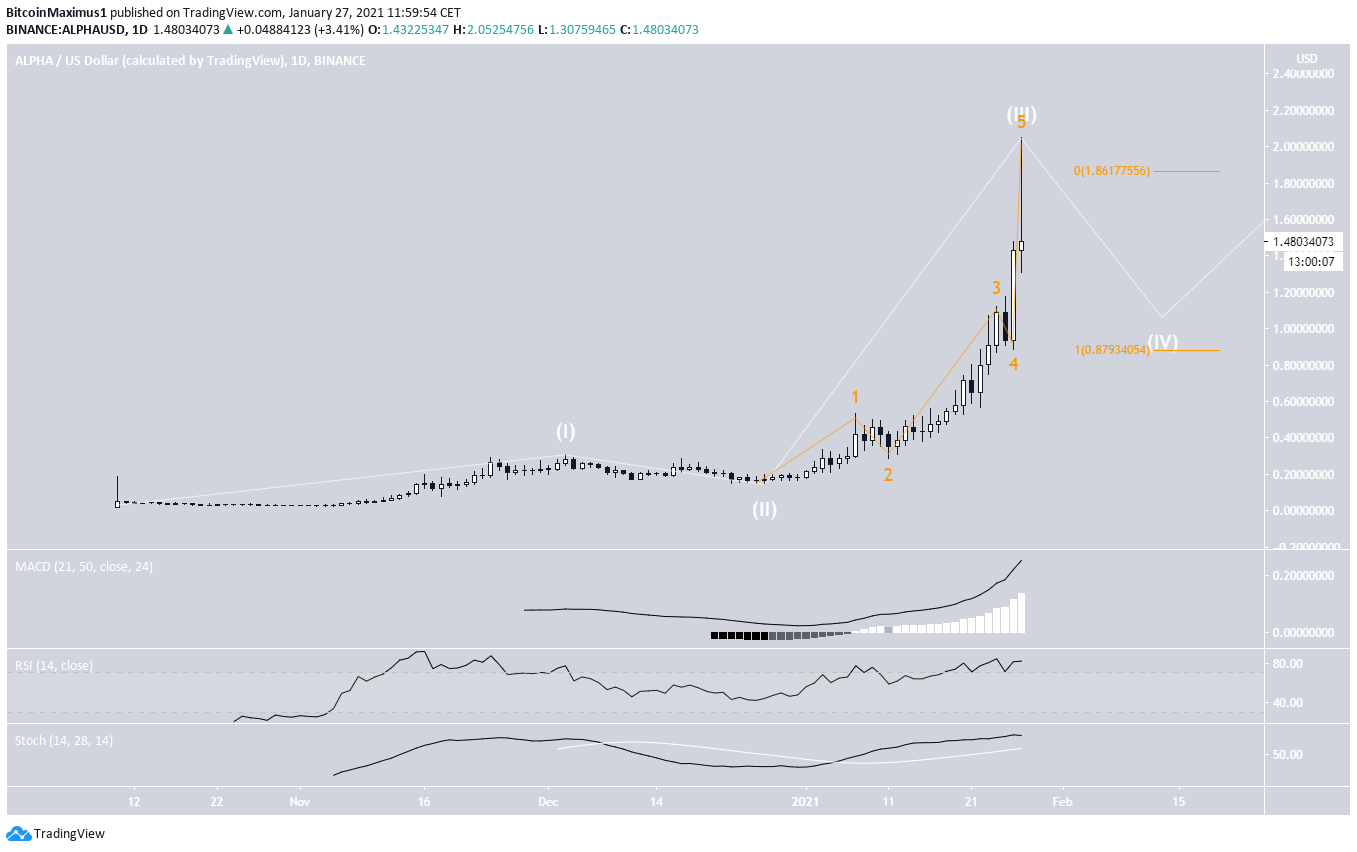
Similar to FTM, ALPHA has been increasing at an accelerated pace since initially breaking out from its all-time high level on Jan. 7, 2021.
The increase has been swift, and ALPHA has so far reached a high of $2.02 before falling. While it’s clear that the trend is bullish, also evidenced by readings from technical indicators, ALPHA is in the process of creating a shooting star, which is a bearish reversal candlestick.
Furthermore, the altcoin has already reached the target for the top of wave 3 (white), so similar to FTM, a decline is likely before it resumes its upward trend. If so, the $0.80 – $1 area is likely to provide support.
3. UNI
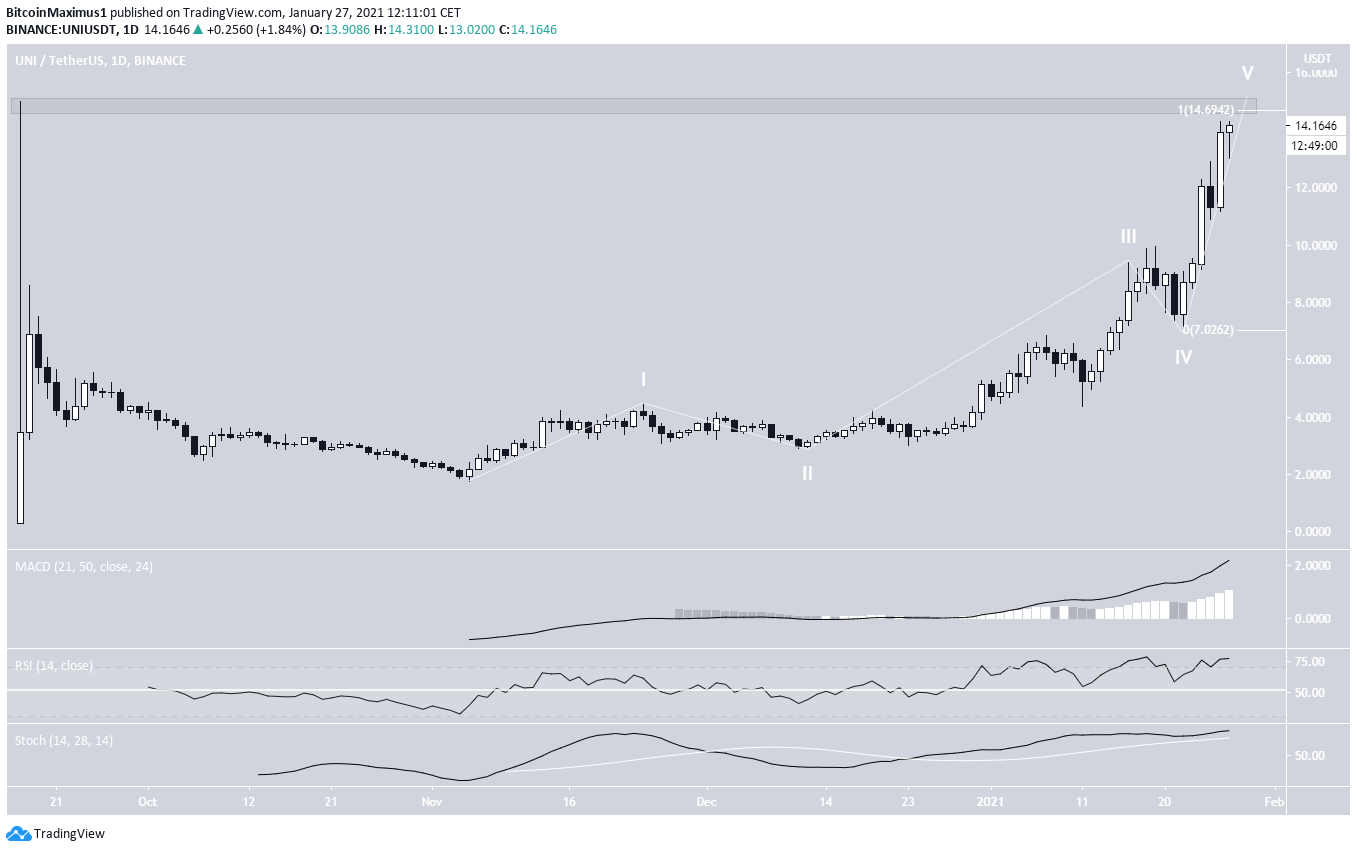
UNI has been increasing at an accelerated rate since Dec. 23, 2020, when it reached a low of $3.01. So far, UNI has reached a high of $14.43, very close to the all-time high price of $15 when it was listed.
Similar to both FTM and ALPHA, technical indicators are bullish, indicating that UNI is in a bullish trend. However, it’s aiming for a possible target at the top of wave 5 (white). So while a new all-time high is likely, a decline should occur afterward.
4. AAVE
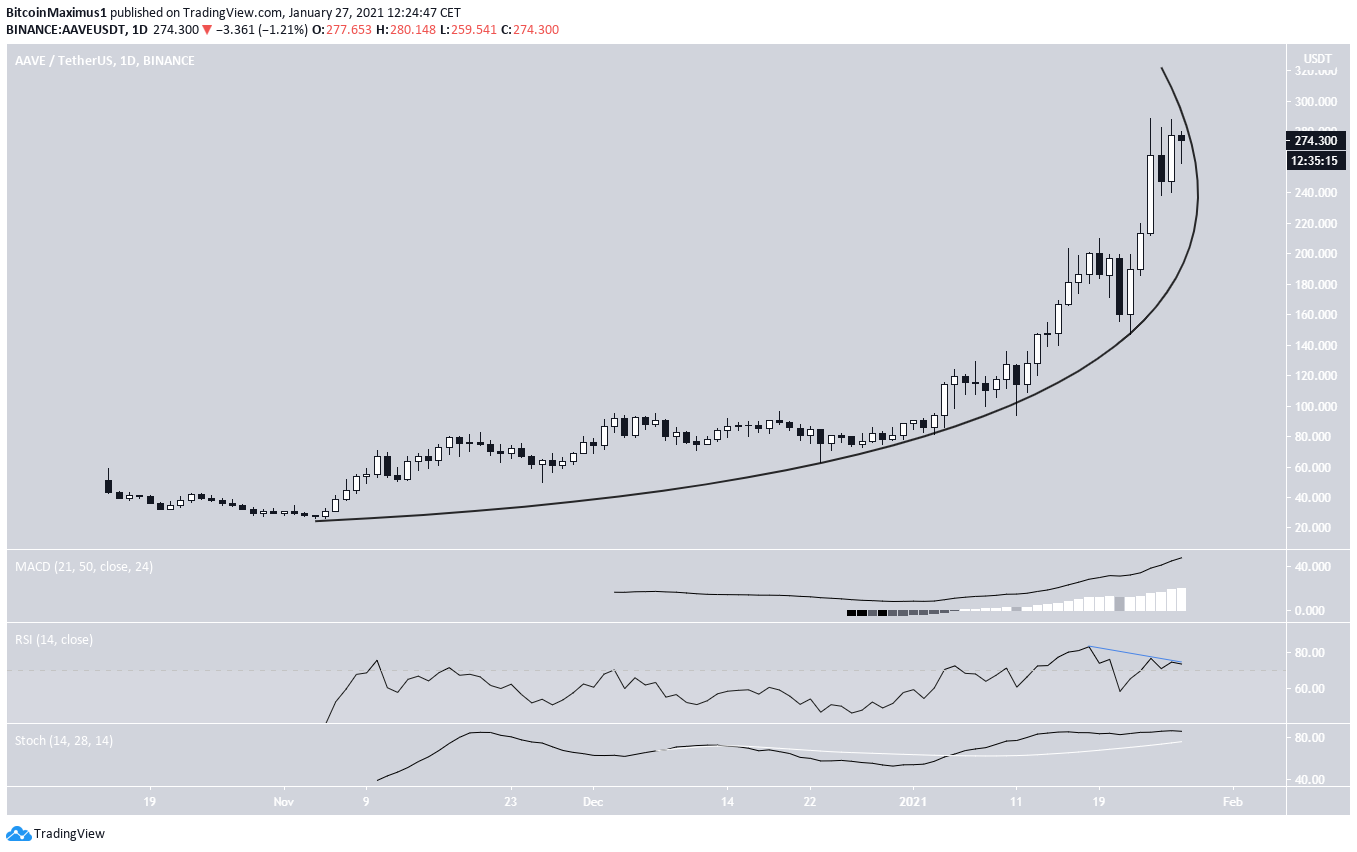
The AAVE chart shows a massive increase since Nov. 2020, when the price was trading at $27. AAVE reached an all-time high price of $288 on Jan. 24, 2021.
The trendline has turned completely parabolic, and AAVE is likely approaching the top of the parabola. While the MACD and Stochastic Oscillator are bullish, some bearish divergence is developing in the RSI, which is a sign of weakness.
Combining this with its parabola, AAVE seems to be the altcoin with the highest potential for a decline out of the five listed if a breakdown were to occur.
5. CRV
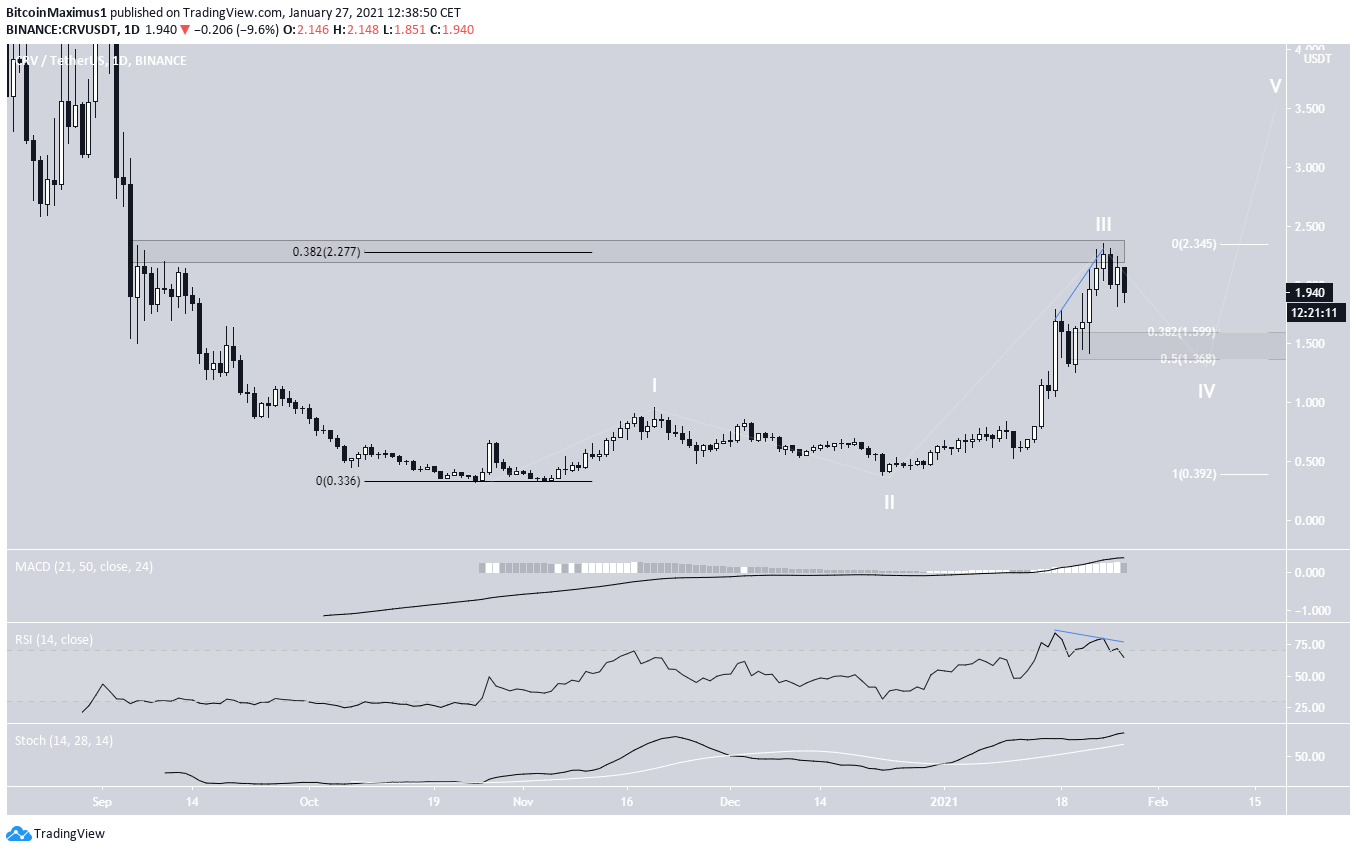
CRV has also been moving upwards at an accelerated rate since reaching a low of $0.385 on Dec. 23, 2020. CRV touched a high of $2.35 on Jan. 24, 2021.
Unlike the other coins we have charted, this is not even close to an all-time high, being only the 0.382 Fib retracement level of the entire downward move measured from the actual all-time high of $7.77
Since the RSI has formed bearish divergence and CRV seems to have completed wave 3 of a bullish impulse, a fall is expected.
However, there is strong support between $1.37 and $1.60. This is likely to cause a bounce or act as the correction’s low before CRV moves upwards again.
For BeInCrypto’s latest Bitcoin (BTC) analysis, click here.


