

BeInCrypto breaks down some of the biggest altcoin movers and shakers from the previous week. Will their momentum continue?
During the week of Feb 15 -22, these five altcoin picks rallied the most:
- Pundi X (NPXS) – 206%
- OKB (OKB) – 188%
- Kucoin Token (KCS) – 180%
- Holo (HOT) – 178%
- Ravencoin (RVN) – 152%
Biggest Altcoin Gainers
NPXS has increased considerably since the beginning of the year, but the upward movement looks extremely overextended and the price could soon reach a top.
While the increase for OKB looks similarly parabolic, the coin seems to be at an earlier stage of its bullish impulse relative to NPXS.
KCS isn’t close to reaching its all-time high price yet but is approaching an important long-term resistance area.
Similar to NPXS and OKB, the increase for HOT seems completely parabolic.
NPXS
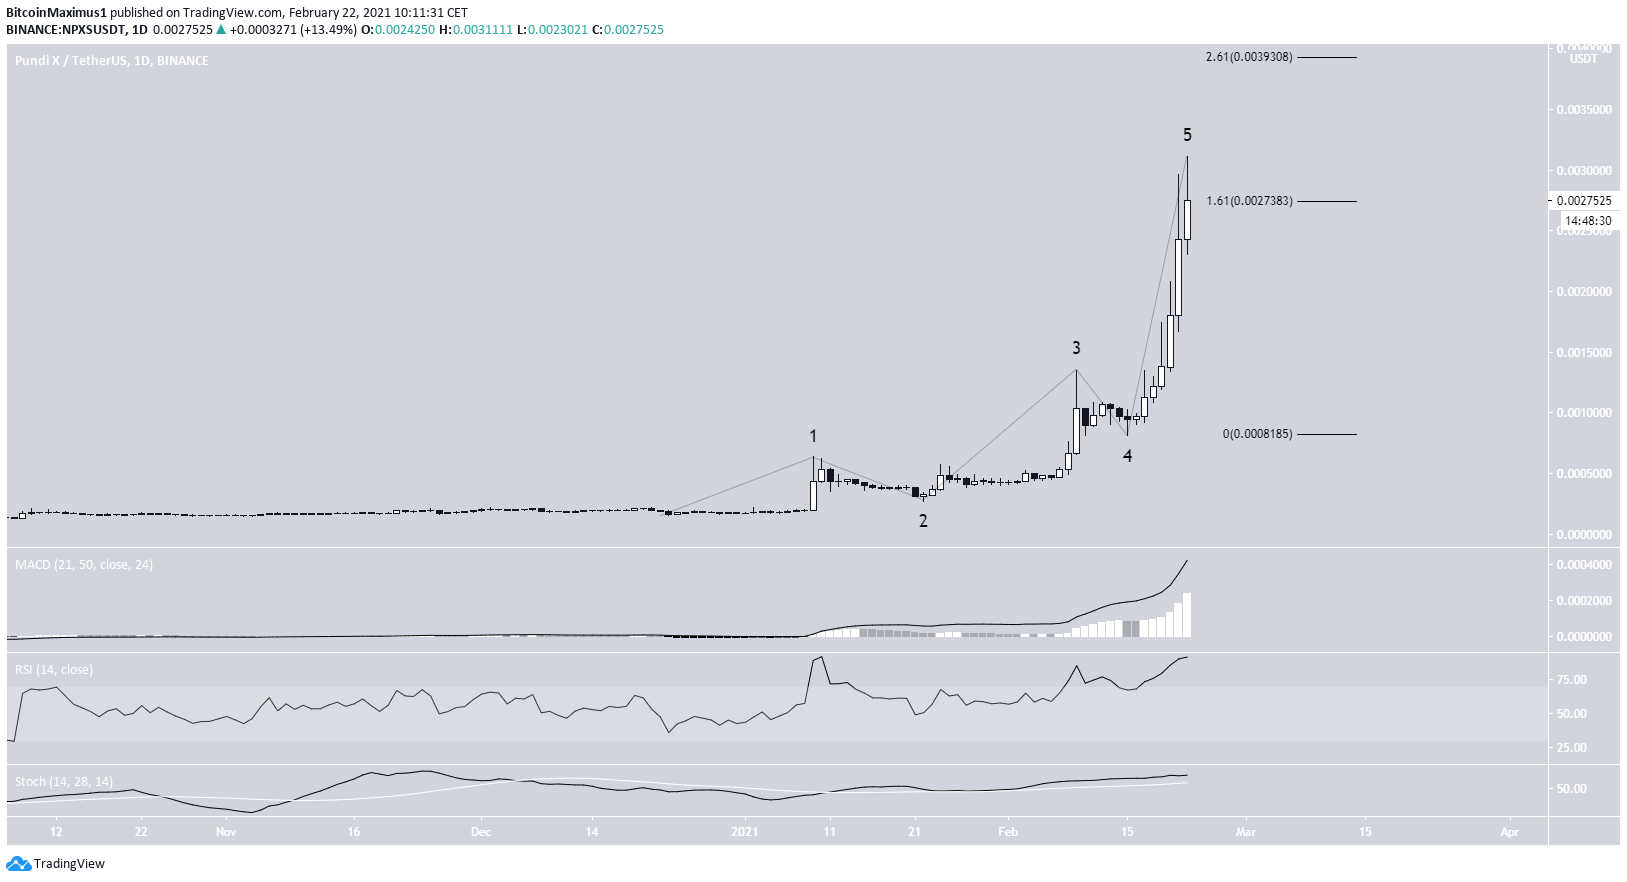
NPXS has increased significantly since Dec. 23, 2020, when it was trading at a low of $0.0001546. So far, it has moved upwards by 1,900%, reaching an all-time high price of $0.0031 on Feb. 22. The increase has taken NPXS all the way to rank 86 based on its market capitalization.
Technical indicators are bullish. The MACD, RSI, and Stochastic oscillator are increasing. None of them have generated any bearish divergence.
However, the upward move has become completely parabolic, devoid of any structure. In addition, NPXS seems to be in the fifth and final wave of a bullish impulse (shown in black below) that began with the aforementioned Dec. 23 low.
NPXS is currently at the 1.61 Fib extension found at $0.027, which could act as the top. If not, the next most likely area would be found at $0.039 (2.61 Fib extension). NPXS is expected to reach a top soon and begin a corrective movement.
OKB
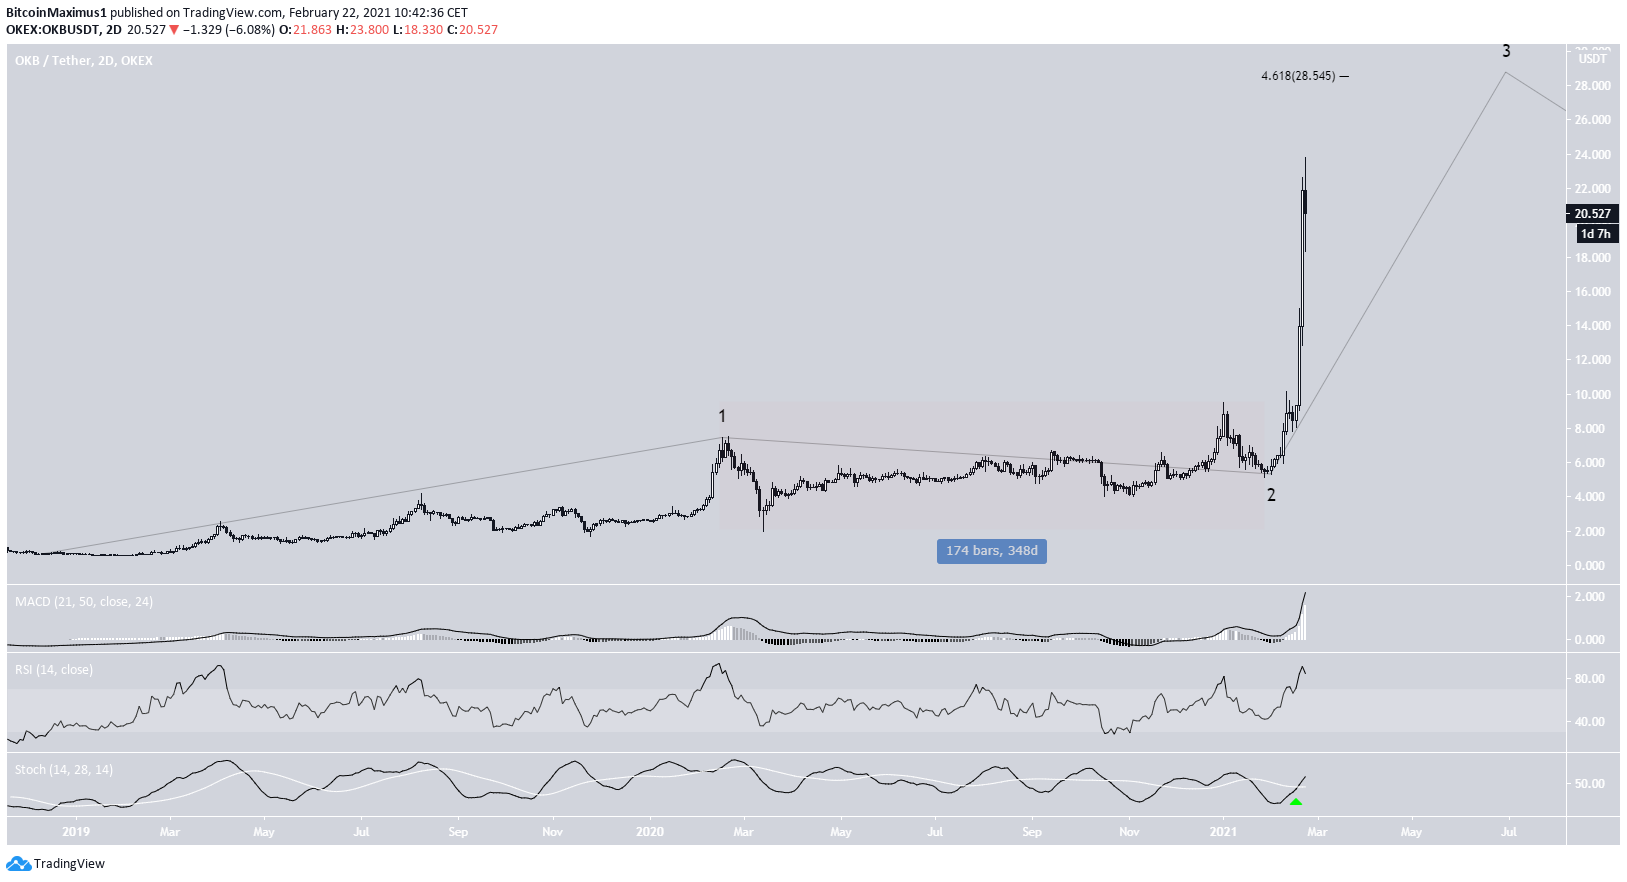
OKB has been moving upwards since December 2018, but the rate of increase accelerated significantly on Jan. 23, 2021. At that time, OKB was trading at $5.13. Since then, OKB has increased by 370% to reach an all-time high of $23.80 on Feb. 22. The increase took it to rank 61 based on its market capitalization.
Despite the nearly parabolic increase, the MACD, RSI, and Stochastic oscillator are still bullish, suggesting that the trend is also bullish.
In addition, the movement in 2020 (highlighted in red) looks very much like a running flat correction. Significant upward movements often follow these corrections.
Despite the possibility of a short-term decrease, it seems likely that OKB is in a long-term bullish wave three. This wave has a potential top target of $28.54.
KCS
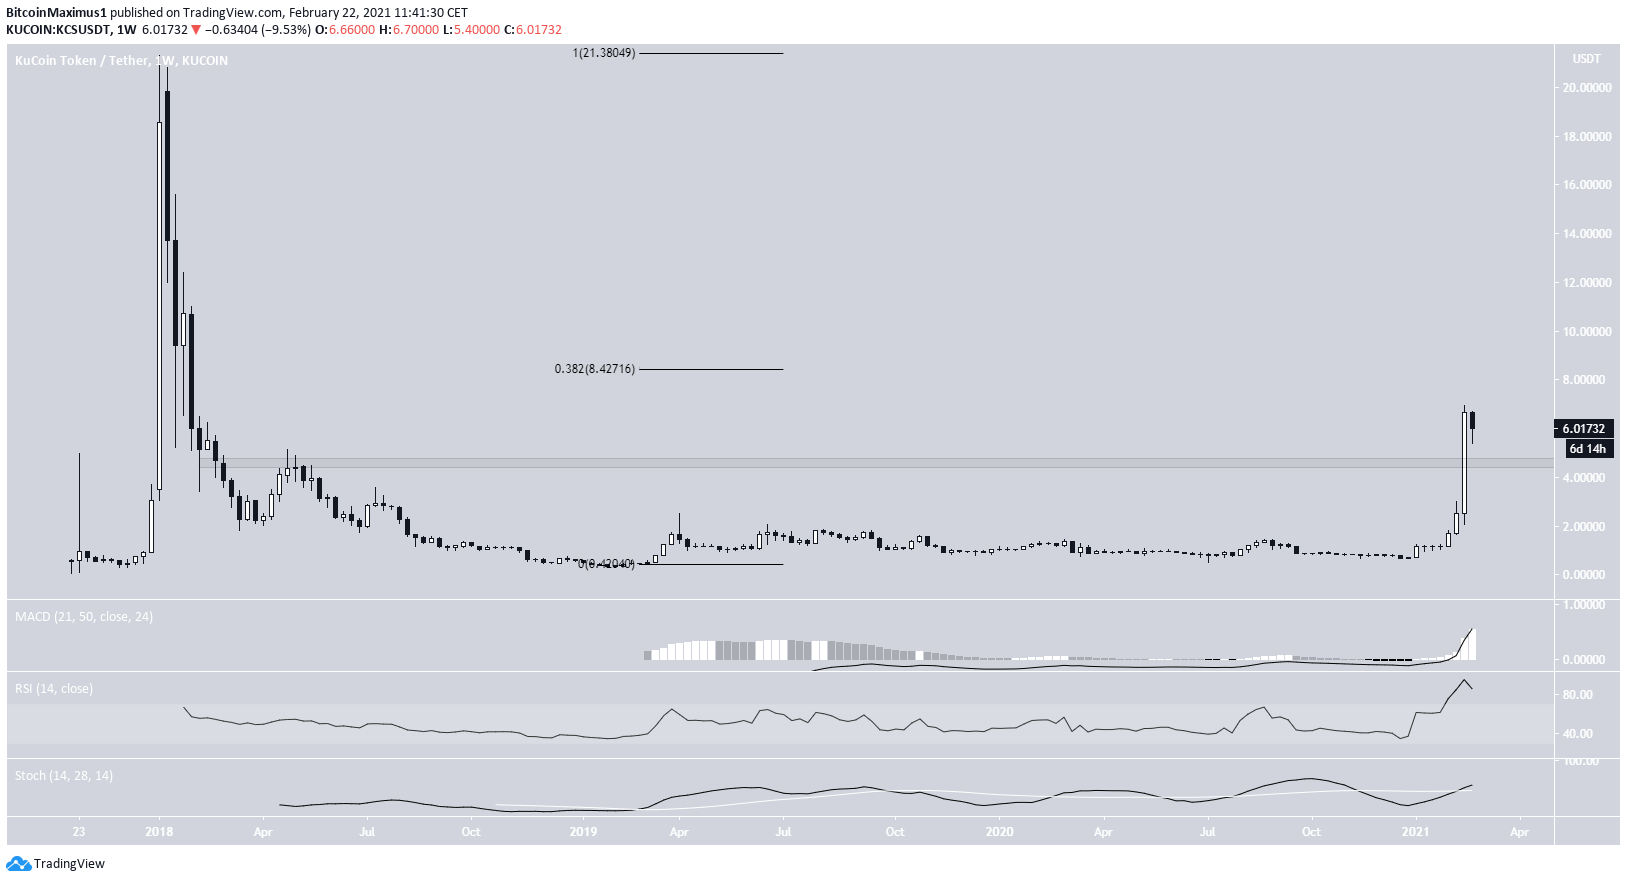
KCS increased significantly over the past week, moving from a low of $2.08 to a high of $6.95. This increase took KCS above the $4.60 resistance area, which had previously been in place since 2018. The increase took it to #98 in market capitalization.
The next closest resistance area is found at $8.42 (0.382 Fib retracement level measuring from the all-time high price of $21.38). Technical indicators in the weekly time-frame are bullish, supporting the continuation of the upward movement.
Nevertheless, the previous resistance area at $4.60 is now likely to act as support. It’s possible that KCS will return and validate this level before resuming its upward movement.
HOT
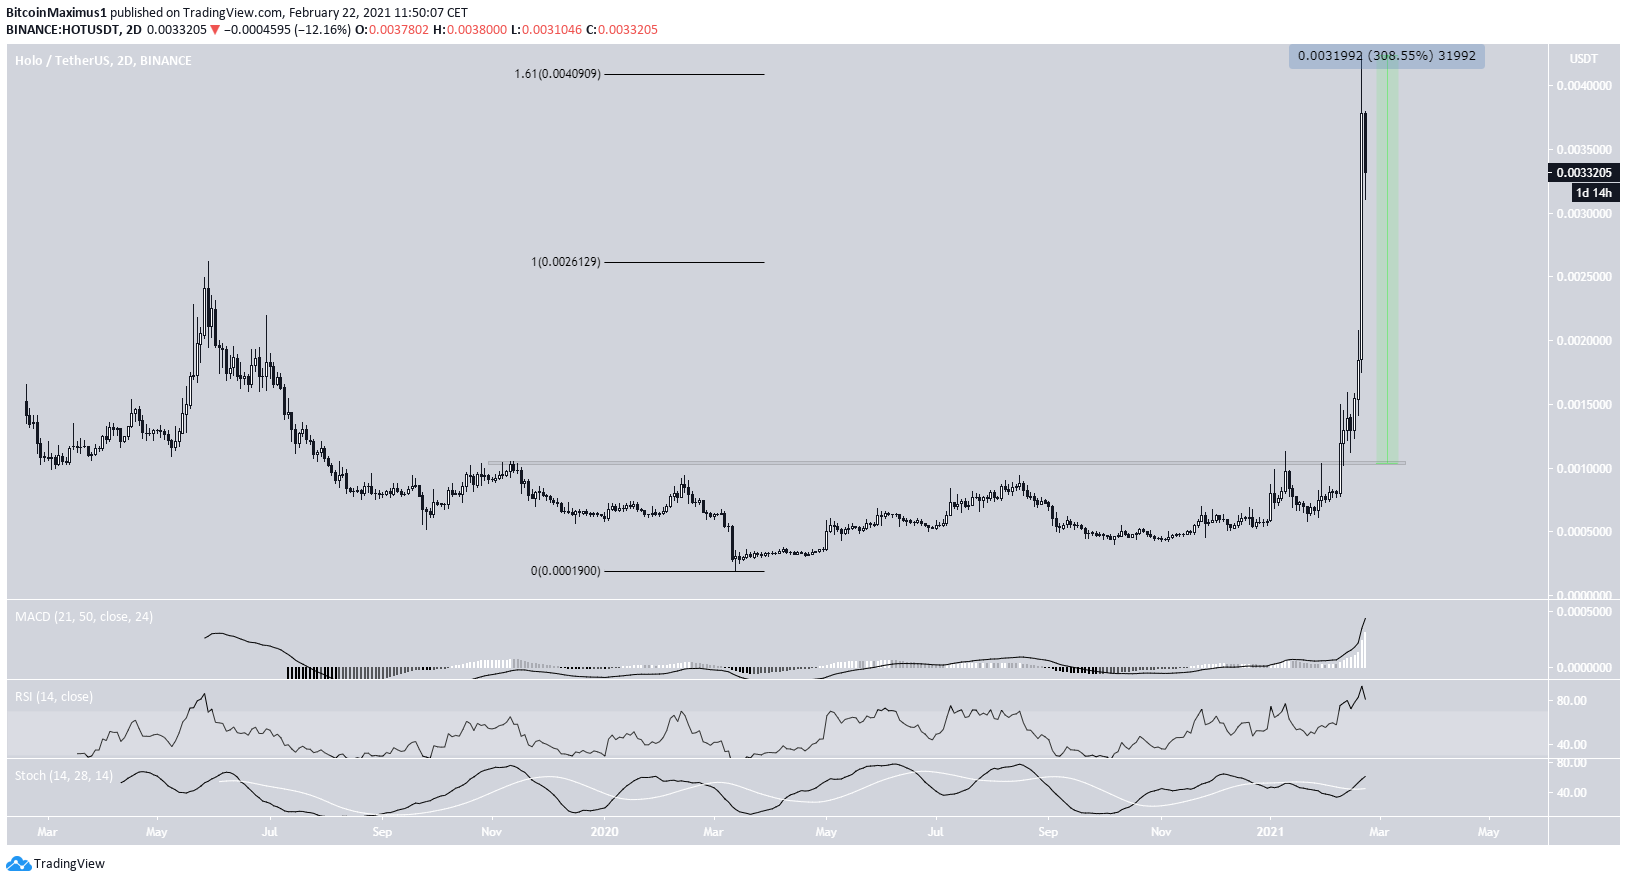
HOT has been moving upwards with strength since breaking out above the $0.001 resistance area on Feb. 10, 2020. Since then, HOT has increased by a massive 308%, reaching an all-time high price of $0.0042 on Feb. 20. The increase took it to #95 based on its market capitalization.
Despite technical indicators still being bullish, HOT has reached the 1.61 external Fib retracement level at $0.004, so it’s possible that it will correct in the short-term before potentially resuming its upward movement.
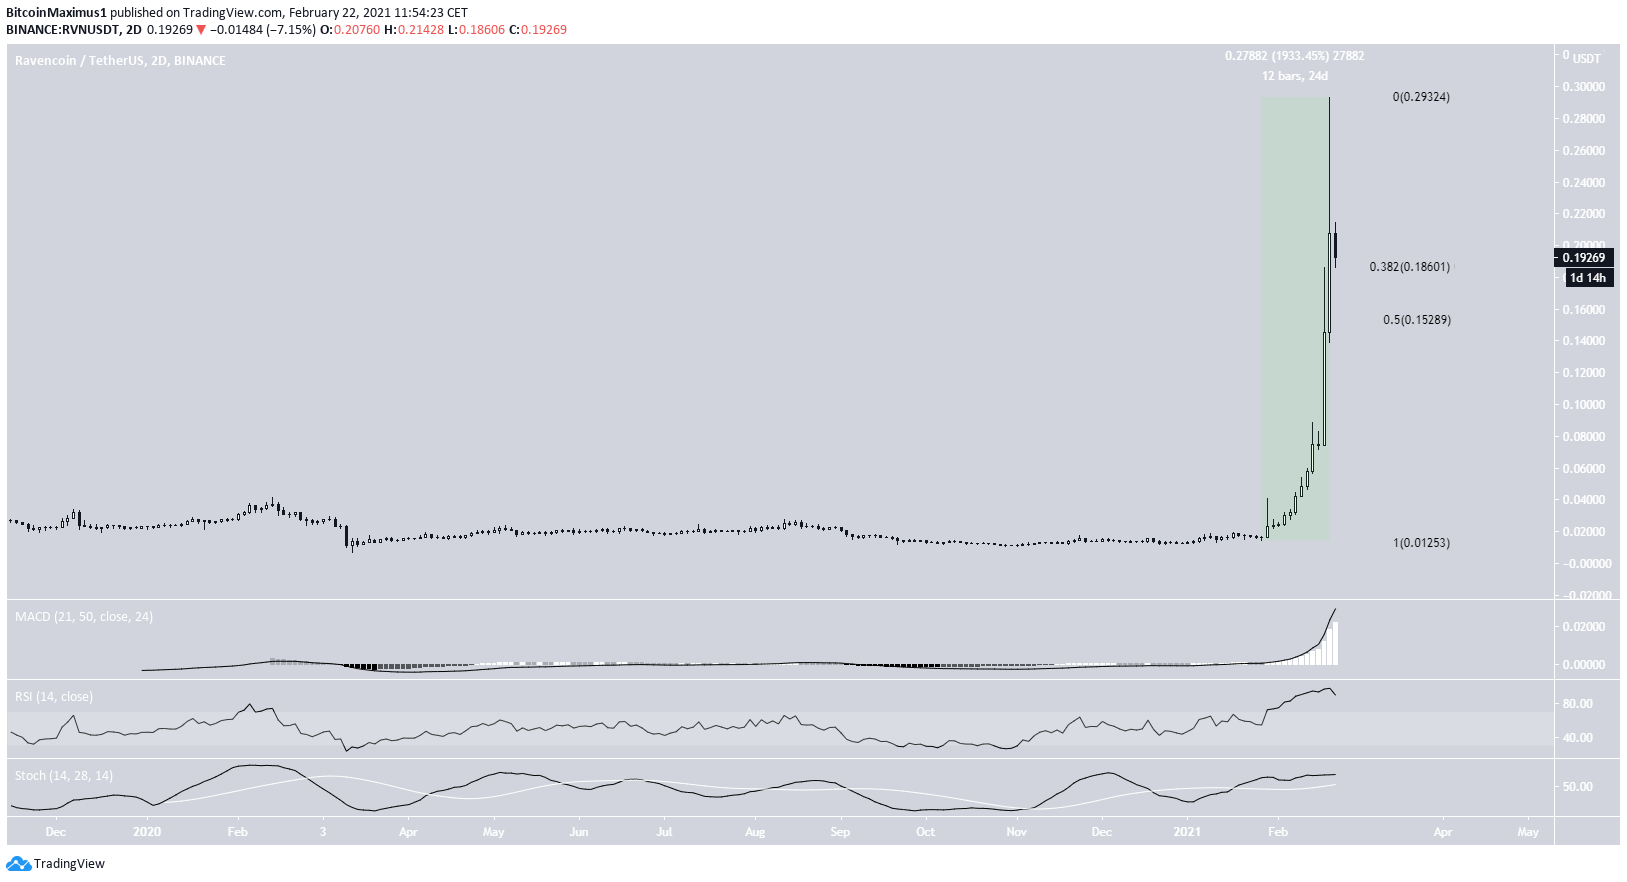
RVN
RVN has been increasing by 1,933% since Jan. 28, 2020. This took it to #51 based on its market capitalization. On Feb. 20, RVN reached an all-time high price of $0.292 but it has decreased slightly since.
An eventual steep correction is expected since the rate of increase seems unsustainable.
Currently, RVN has just reached the 0.382 Fib retracement level at $0.186 and initiated a slight bounce.
If the level does not manage to support the price, the next support would likely be found at $0.152.
For BeInCrypto’s latest Bitcoin (BTC) analysis, click here
Disclaimer
In line with the Trust Project guidelines, this price analysis article is for informational purposes only and should not be considered financial or investment advice. BeInCrypto is committed to accurate, unbiased reporting, but market conditions are subject to change without notice. Always conduct your own research and consult with a professional before making any financial decisions. Please note that our Terms and Conditions, Privacy Policy, and Disclaimers have been updated.
