FTM, ENJ, KMD Highlights
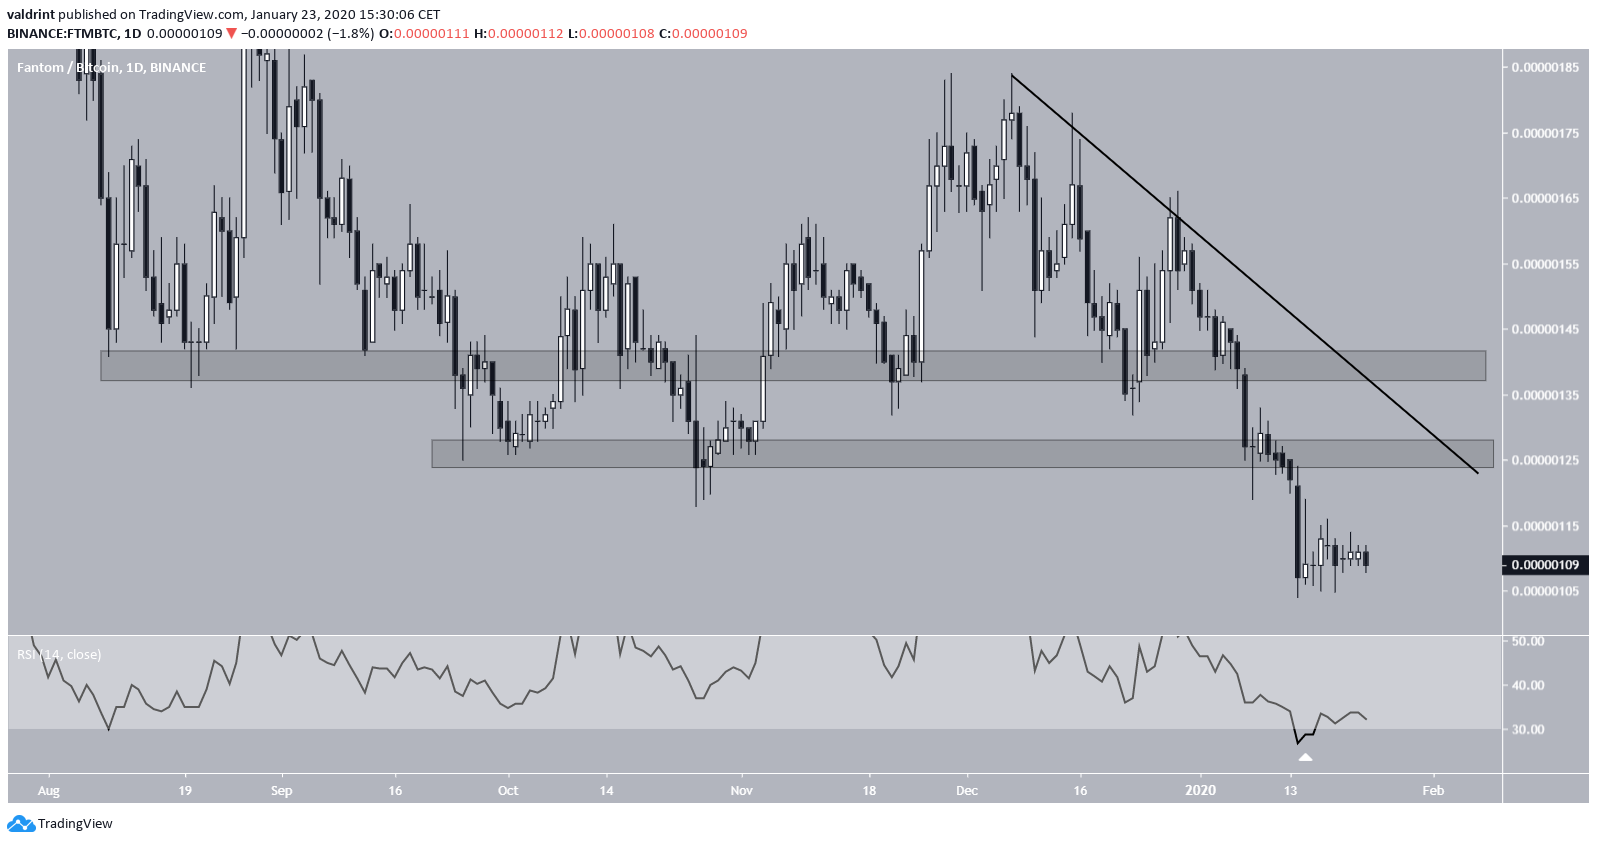
- FTM is trading near an all-time low.
- There is resistance at 125 and 140 satoshis.
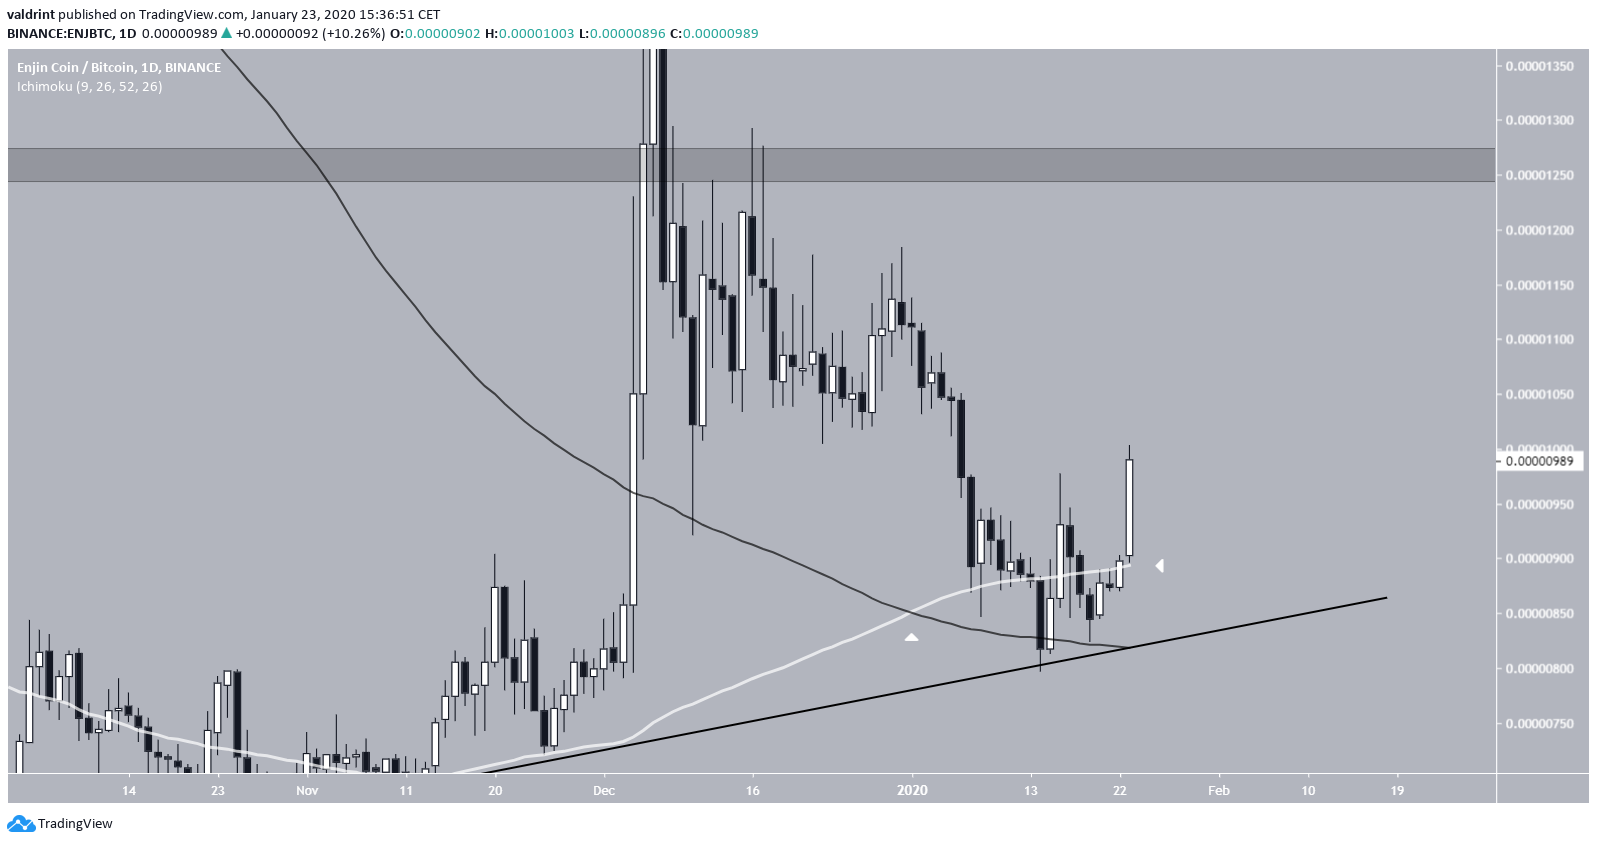
- ENJ is following an ascending support line.
- There is resistance at 1200 and 3000 satoshis.
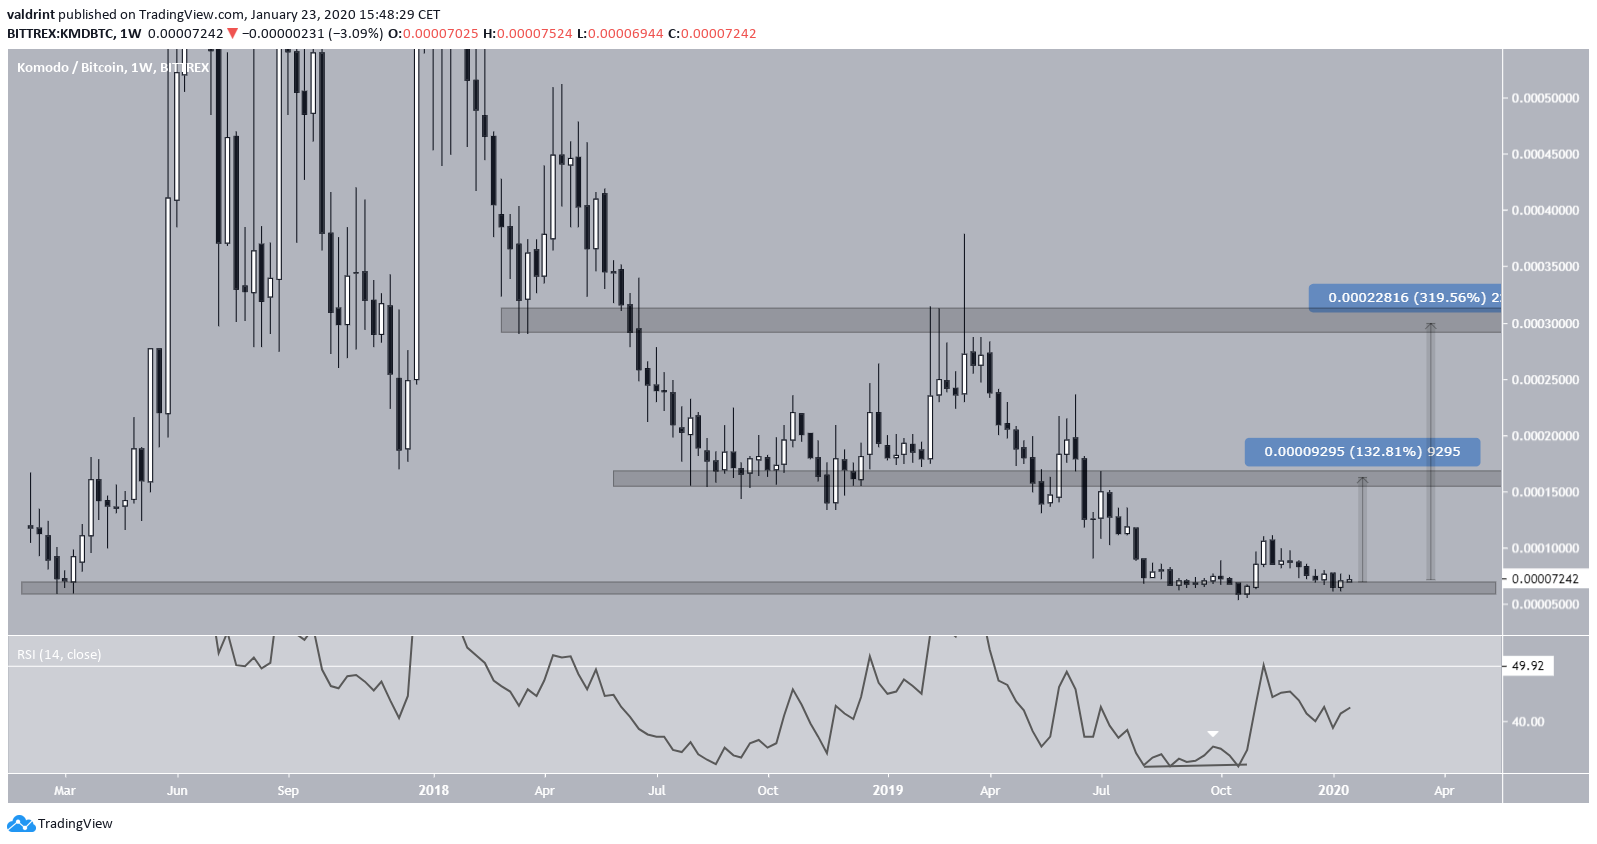
- KMD is trading near an all-time low.
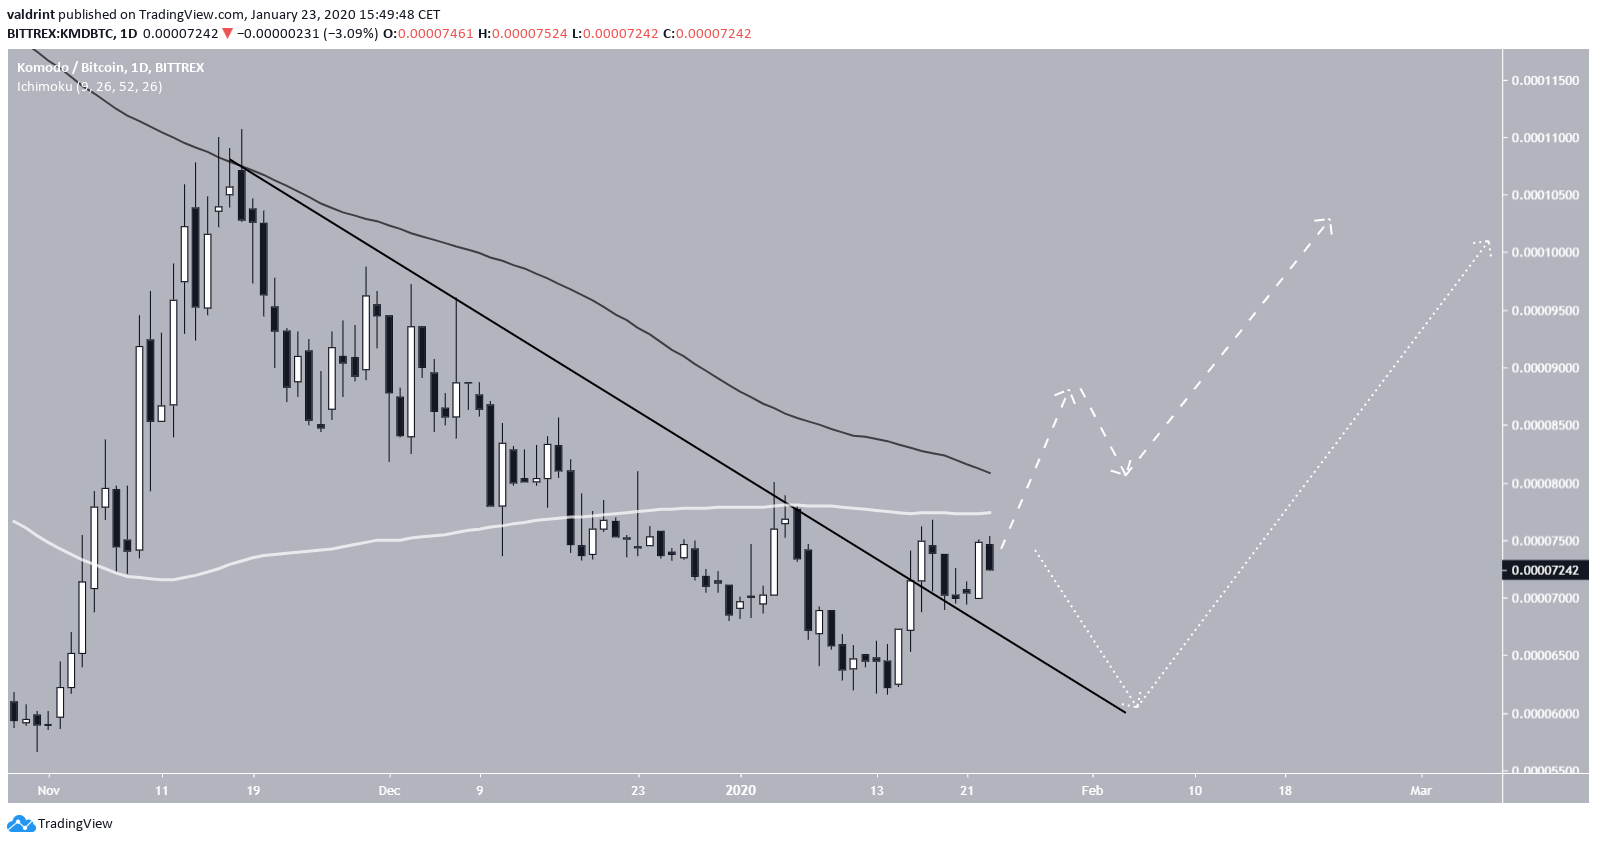
- It has broken out above a descending resistance line.
- There is resistance at 16,500 and 30,000 satoshis.
Below, we will look at each of them individually and gauge their potential for future increases.The main $ALTS i intend to trade February-March$RVN $THETA $FTM $ENJ $KMD
— €uroSniper (@TheEuroSniper) January 23, 2020
Over the next 2 weeks i expect dips, the last dips on certain $ALTS before they have a new Cycle.
View on $BTC, No significant upside until after the Mids have finished their Cycles.
FTM
The FTM price is trading very near an all-time low, which was reached on January 14 at 107 satoshis. While there is no trading pattern immediately visible, it is possible that the price is following a descending resistance line. While the RSI is oversold, there are no reversal signs yet. The closest resistance areas are found at 125 and 140 satoshis, the former of which coincides with the aforementioned descending resistance line. While it is possible that FTM will begin an upward movement, technical indicators do not forecast such a price increase.
ENJ
In August 2019, the ENJ price reached the 600 satoshi support area, which was the catalyst for the February 2019 upward move. Once then, it began a gradual increase along an ascending support line. The price initiated a spike in December 2019 and completed the retracement with a successful bounce on the ascending support line. Prior to the February upward move, the price consolidated for 196 days. If the price were to consolidate for the same amount of time in the current movement, it would break out on February 17. Technical indicators support such a price increase. The 100- and 200-day moving averages (MA) have made a bullish cross and the price is trading above them. This suggests that the upward move will continue and the rate of increase will likely accelerate once the price breaks out above the 1200 satoshi resistance area.

KMD
On October 21, 2019, the KMD price reached an all-time low of 5330 satoshis. This movement was characterized by a bullish divergence in the weekly RSI, which successfully completed a failure swing bottom and is moving gradually above the 50 line. The price began an upward move shortly after but has retraced almost completely since. The closest resistance area is found at 16,500 satoshis, marking a 130% increase from the current price, while the next one at 30,000 satoshis, marking a 320% increase from the same level. In the short-term, the price has broken out above a descending resistance line. However, it is facing close resistance from the 100- and 200-day MAs. If it is successful in flipping them as support, it is likely to immediately begin its attempt at breaking out above.
Conversely, the price is likely to decrease and validate the resistance line as support before resuming its upward movement.
 Out of the three coins, we believe that KMD has the potential for the increase with the biggest magnitude.
Disclaimer
In line with the Trust Project guidelines, this price analysis article is for informational purposes only and should not be considered financial or investment advice. BeInCrypto is committed to accurate, unbiased reporting, but market conditions are subject to change without notice. Always conduct your own research and consult with a professional before making any financial decisions. Please note that our Terms and Conditions, Privacy Policy, and Disclaimers have been updated.


