
Ethereum (ETH) is facing a sharp correction, dropping 11% over the past week as bearish momentum continues to dominate. The Relative Strength Index (RSI) remains weak, showing a lack of strong buying pressure, while the Directional Movement Index (DMI) confirms that sellers are still in control.
Additionally, the Exponential Moving Averages (EMA) are in a firmly bearish structure, suggesting that ETH could soon test critical support levels at $1,756 and potentially fall below $1,700 for the first time since October 2023.
ETH RSI Shows the Lack Of Buying Pressure
Ethereum Relative Strength Index (RSI) is currently at 34.4, recovering slightly after briefly dipping to 27.4 yesterday. The RSI has remained below the 50 mark for three consecutive days, signaling that bearish momentum is still dominant.
The RSI measures the speed and magnitude of recent price changes to assess whether an asset is overbought or oversold.
Typically, an RSI above 70 indicates overbought conditions, suggesting potential for a pullback, while an RSI below 30 signals oversold conditions, implying that selling pressure may be overextended and a bounce could be imminent.
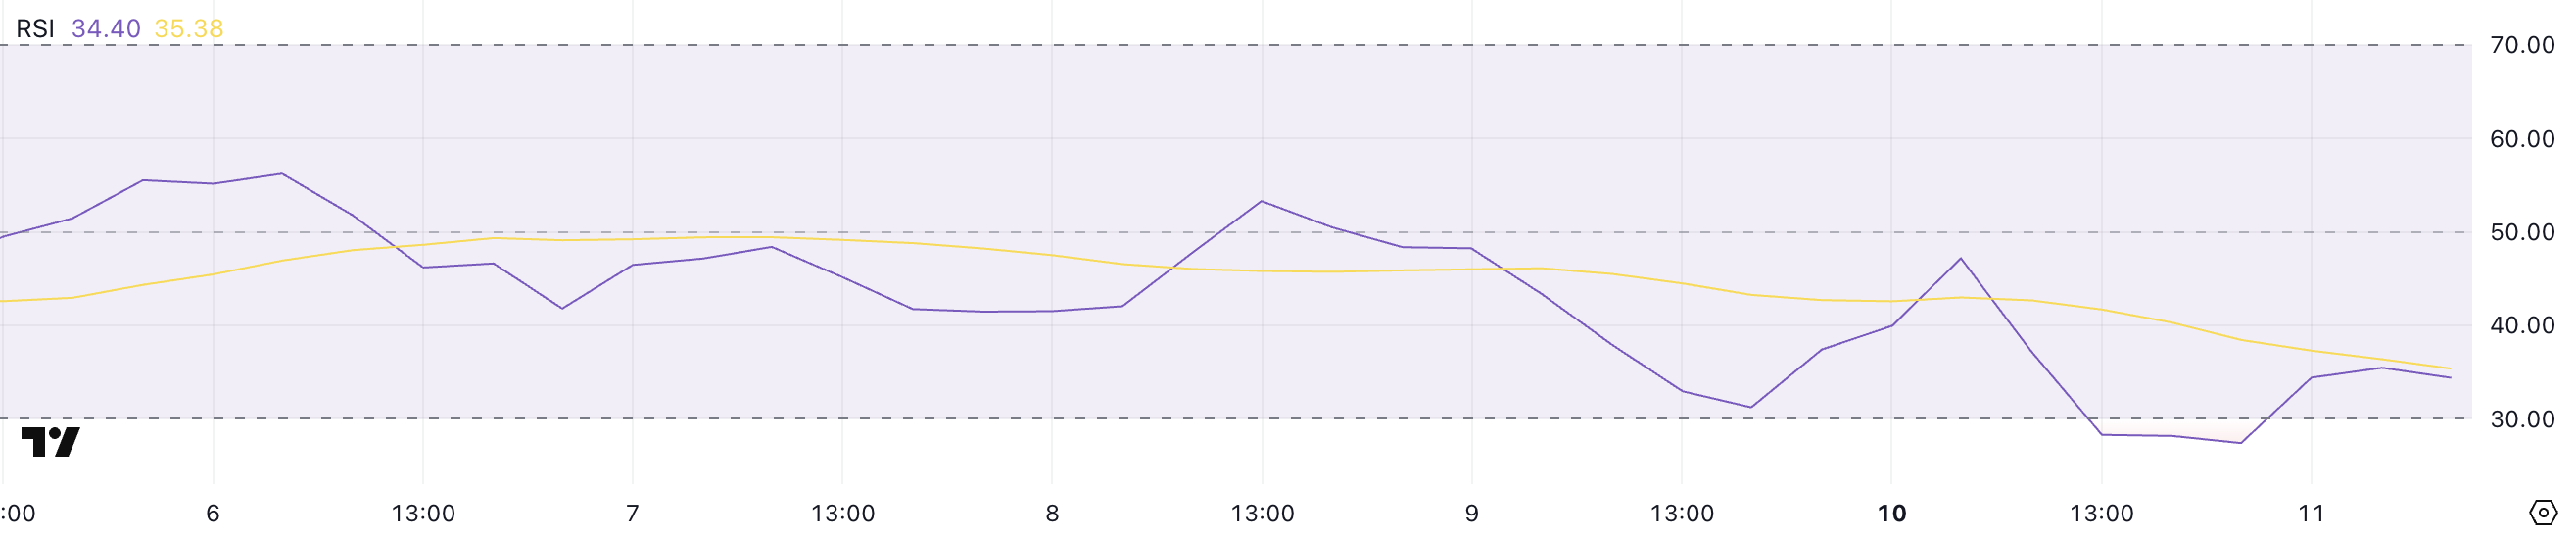
With ETH’s RSI now at 34.4, it suggests that while the asset is still in bearish territory, the extreme selling pressure seen yesterday has eased slightly.
The brief dip below 30 signaled an oversold condition, which often leads to short-term relief rallies. However, for ETH to regain bullish momentum, the RSI would need to climb back above 50, indicating a shift in market sentiment.
Until then, any upward movement could face resistance, and the broader trend remains weak unless sustained buying pressure pushes ETH out of this bearish zone.
Ethereum DMI Shows The Current Downtrend Is Strong
Ethereum Directional Movement Index (DMI) chart shows that its Average Directional Index (ADX) is currently at 29.82, rising from 21.9 yesterday.
The ADX measures the strength of a trend, with values above 25 indicating a strong trend and readings below 20 suggesting a weak or nonexistent trend. Given the ADX’s sharp increase, it confirms that ETH’s ongoing downtrend is strengthening.
The +DI (positive directional index) has dropped to 15.4 from 23.1 in the past day, while the -DI (negative directional index) has surged to 37.8 from 27.3, reinforcing the dominance of sellers in the market.
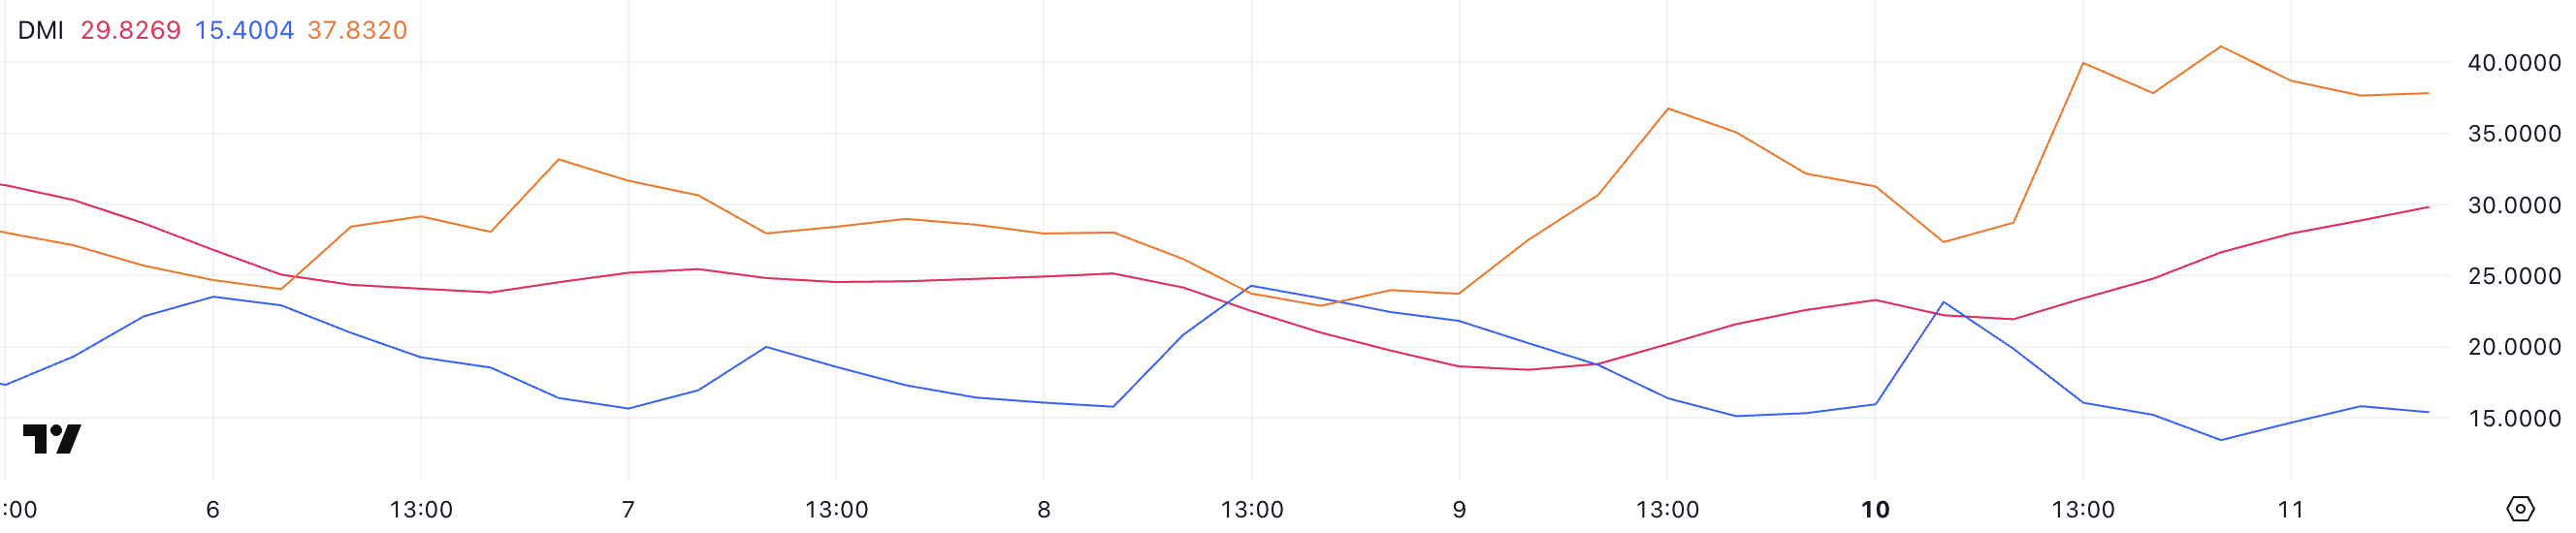
With the -DI significantly above the +DI, it signals that bearish momentum is intensifying, and sellers continue to control ETH’s price action.
The decline in +DI suggests that buying pressure is weakening, making it more difficult for ETH to stage a recovery. Unless the +DI begins to rise and crosses above the -DI, ETH’s price is likely to remain under pressure.
Given that the ADX is nearing 30 and still climbing, the downtrend appears well-established, and any short-term relief rallies may face strong resistance before a meaningful trend reversal can occur.
Ethereum Is Still Struggling Below $2,000
Ethereum Exponential Moving Average (EMA) lines are displaying a strongly bearish setup, with short-term EMAs positioned below long-term ones.
This alignment confirms the continuation of downward momentum, with ETH having dropped over 11% in the last 24 hours. If the current trend persists, ETH could test the critical support at $1,756, a level that could determine whether further declines are imminent.
A breakdown below this support would expose Ethereum’s price to a potential drop below $1,700, a level not seen since October 2023, further reinforcing bearish sentiment in the market.
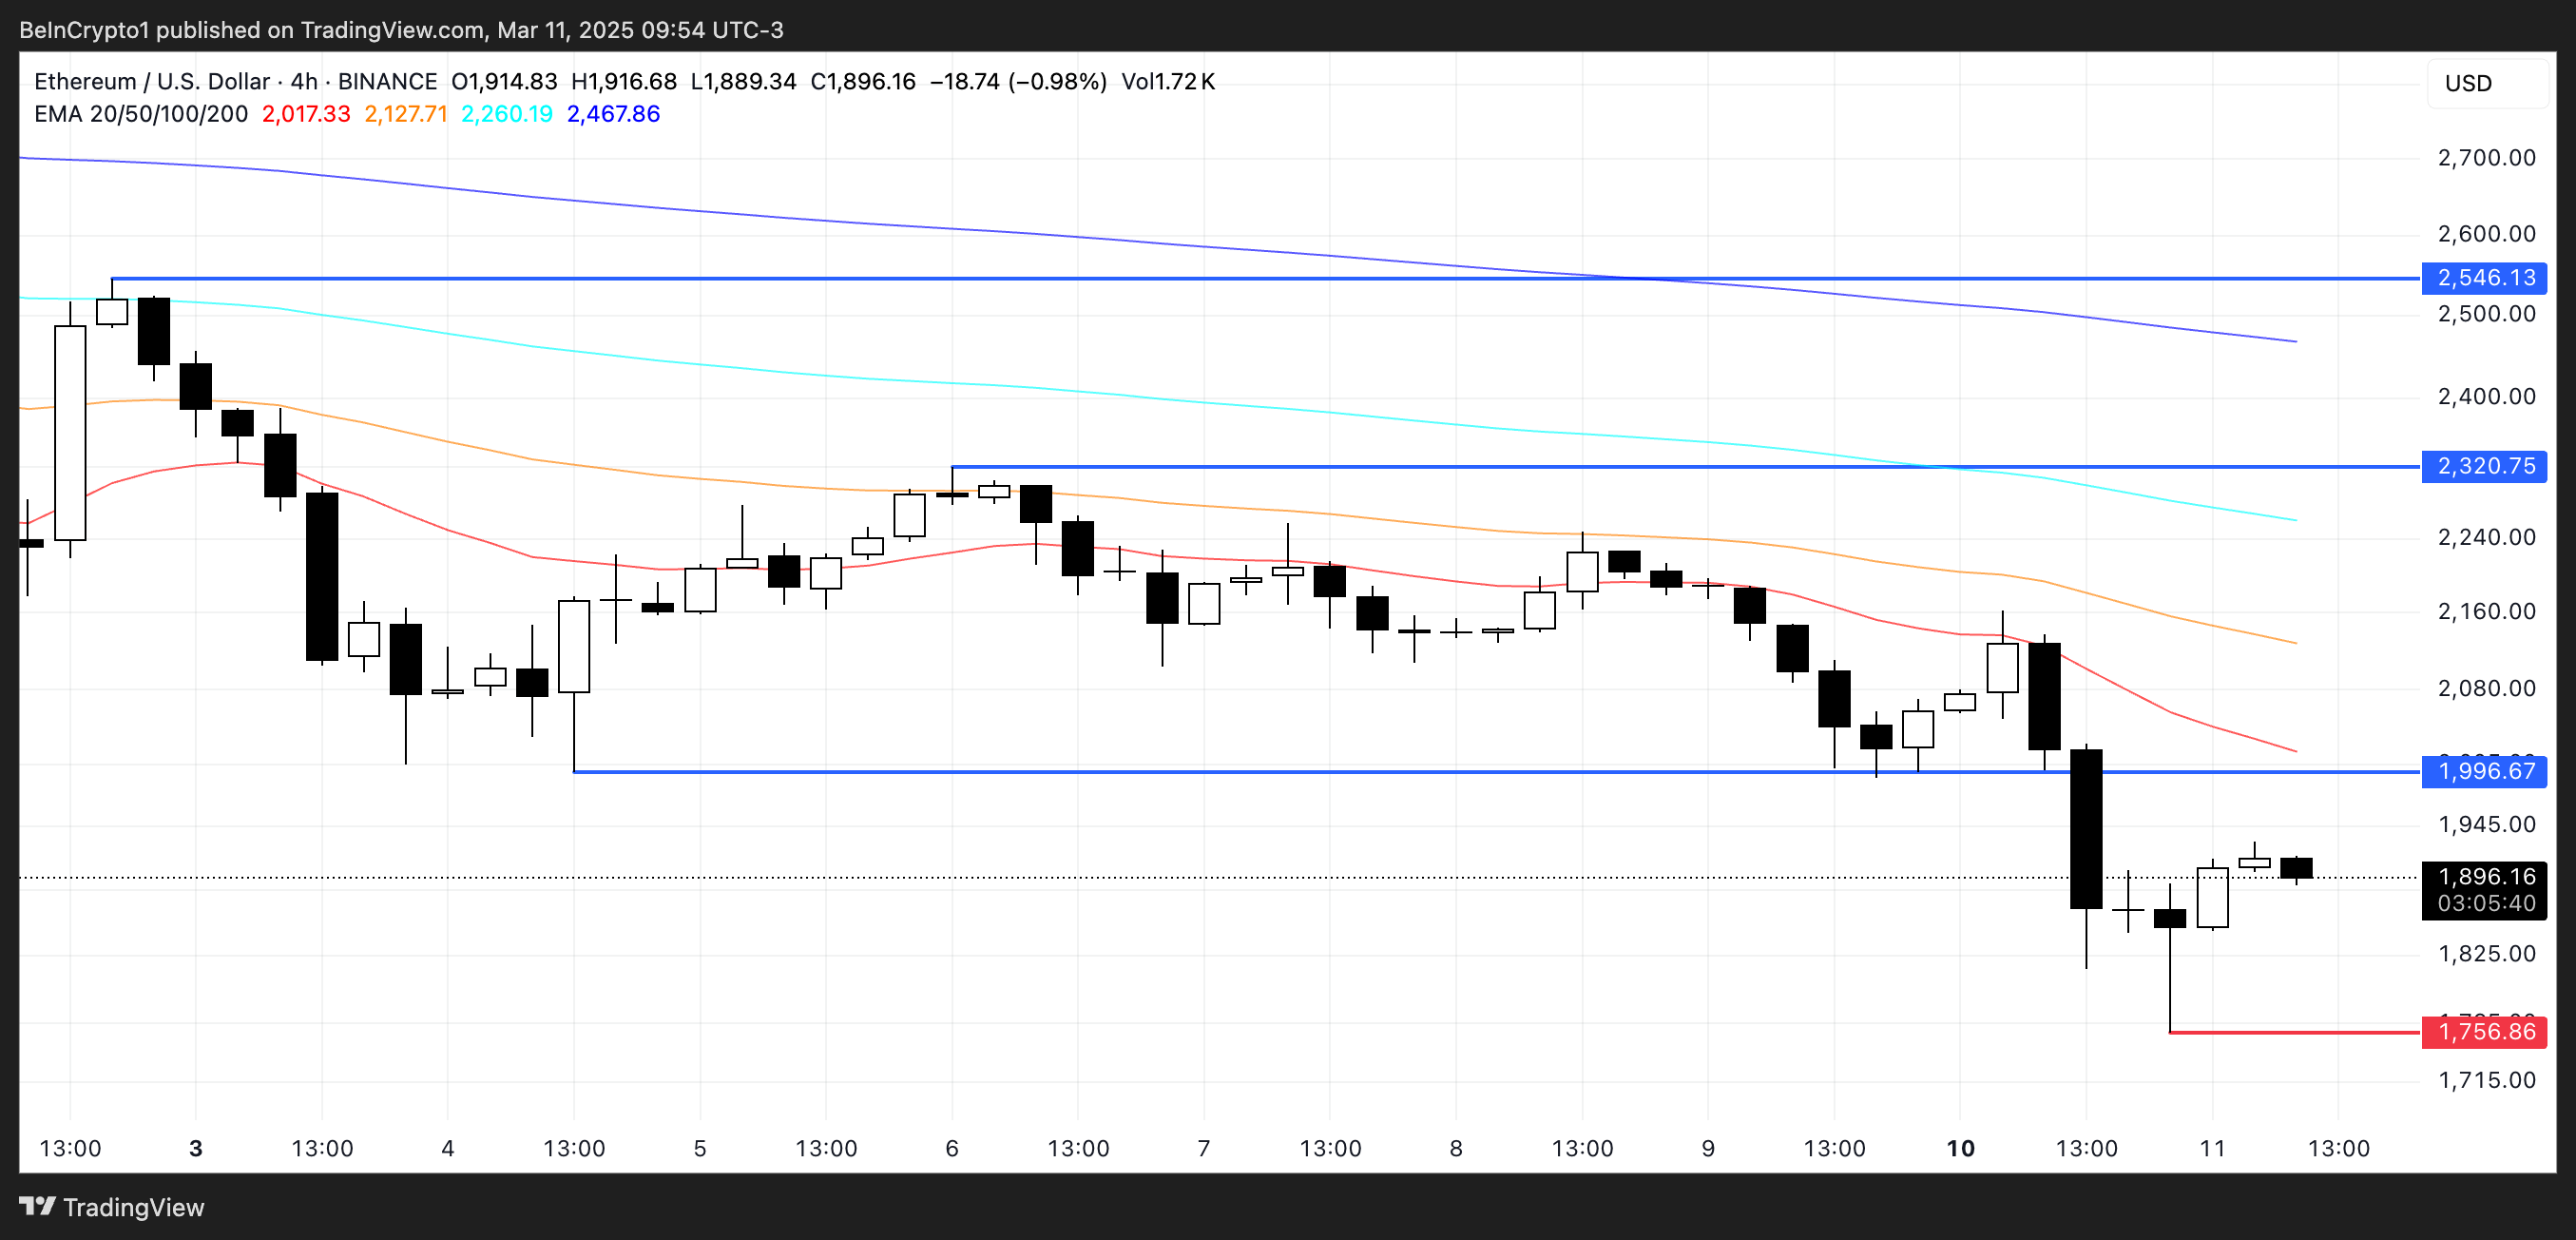
However, if ETH manages to reverse its downtrend, the first key resistance to reclaim would be at $1,996. A successful breakout above this level could trigger a stronger recovery, pushing ETH toward the next resistance at $2,320.
If bullish momentum accelerates, Ethereum could extend gains toward $2,546, a level that would mark a complete shift in trend structure.
For this to happen, ETH would need sustained buying pressure and a bullish EMA crossover, signaling a transition out of its current bearish phase.
