
The Ethereum (ETH) price reached a new yearly high of $2,403 on December 9 but has fallen sharply since.
The price is approaching a critical horizontal support area. Will it bounce or break down?
Ethereum Drops After Yearly High
The Ethereum (ETH) price has increased quickly since the start of October. It broke out from a descending resistance trend line on November 5, further accelerating its increase. After a brief rejection from a horizontal resistance area, the ETH price reached a new yearly high of $2,403 on December 9.
ETH has fallen since and is decreasing sharply today. The price fell to a low of $2,145 before bouncing slightly. Due to the drop, Route 2 Fi noted that the last time ETH was this weak in relation to Bitcoin was in June 2022.
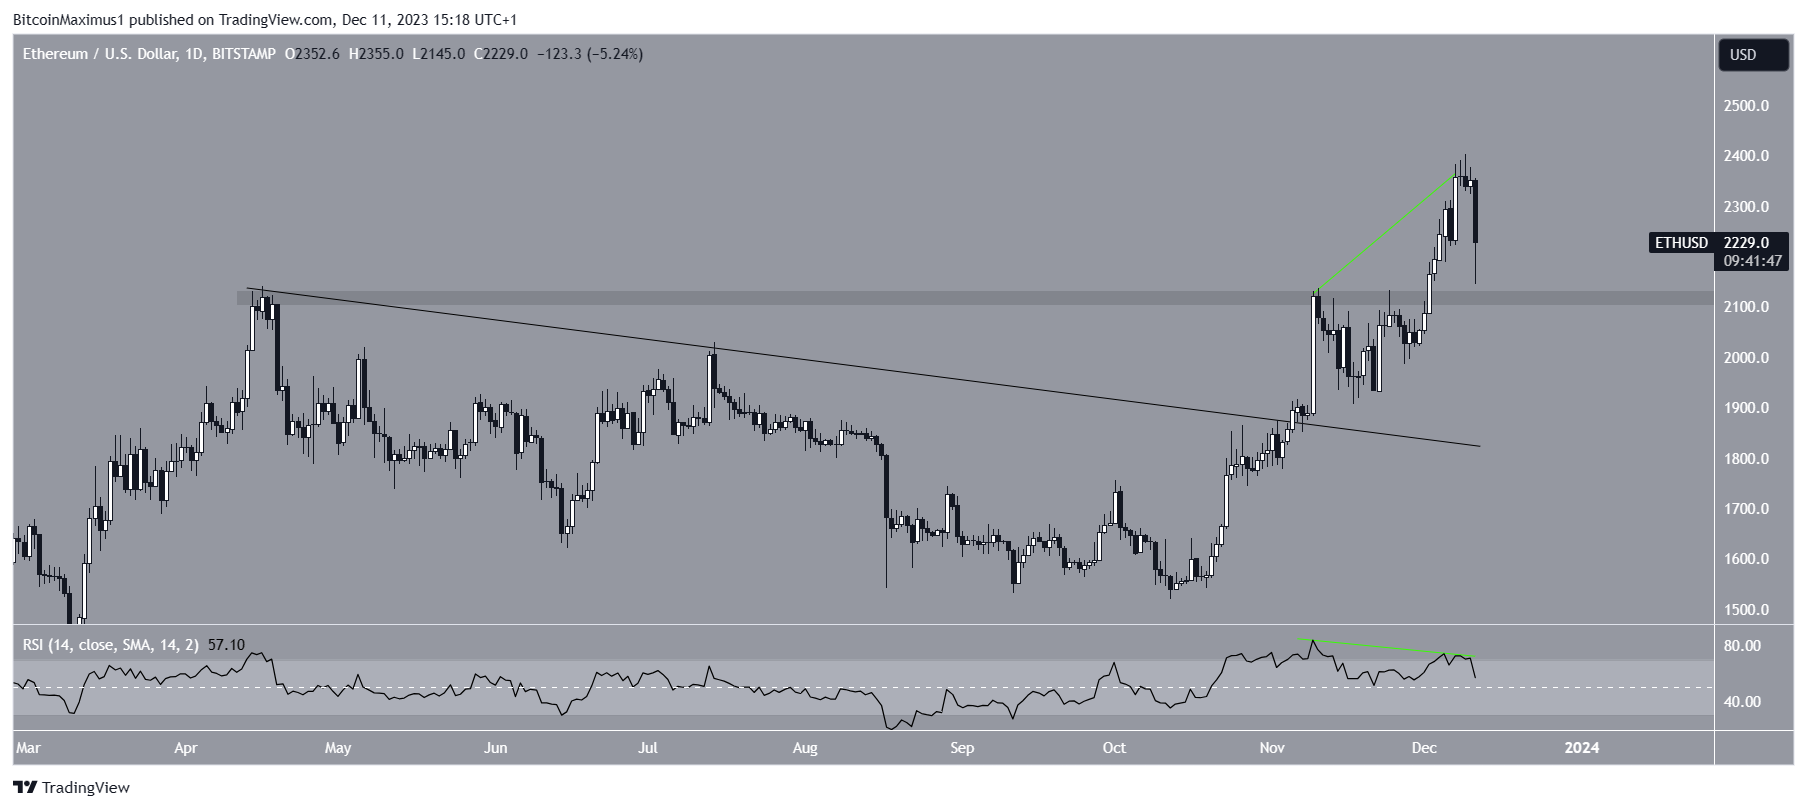
With the RSI as a momentum indicator, traders can determine whether a market is overbought or oversold and decide whether to accumulate or sell an asset.
Bulls have an advantage if the RSI reading is above 50 and the trend is upward, but if the reading is below 50, the opposite is true. The RSI gives mixed readings. The indicator fell after generating a bearish divergence (green). However, it is still above 50.
ETH Price Prediction: $2,000 or $3,000 First?
While the daily time frame offers a mixed reading, the weekly one is decisively bullish. The main reason is the breakout from the long-term $2,000 horizontal resistance area.
Except for a deviation (red circle) in April, the area had been in place since April 2022. Therefore, a breakout from it is expected to lead to a significant increase.
Read More: 9 Best Crypto Demo Accounts For Trading
Cryptocurrency trader Daan Crypto believes that today’s decrease was caused by leveraged longs getting flushed out. He stated:
People were overleveraged and price was not moving up. It only takes a tiny push to make all these positions snowball and cause a squeeze like we just had.
Since open interest has reset, it is possible that the upward movement can continue.
Additionally, the weekly RSI supports the continuing of the increase. The indicator is above 50 and moving upwards. The next long-term resistance is at $3,500 in the weekly time frame. An ETH increase of 60% will be required for the price to reach it.
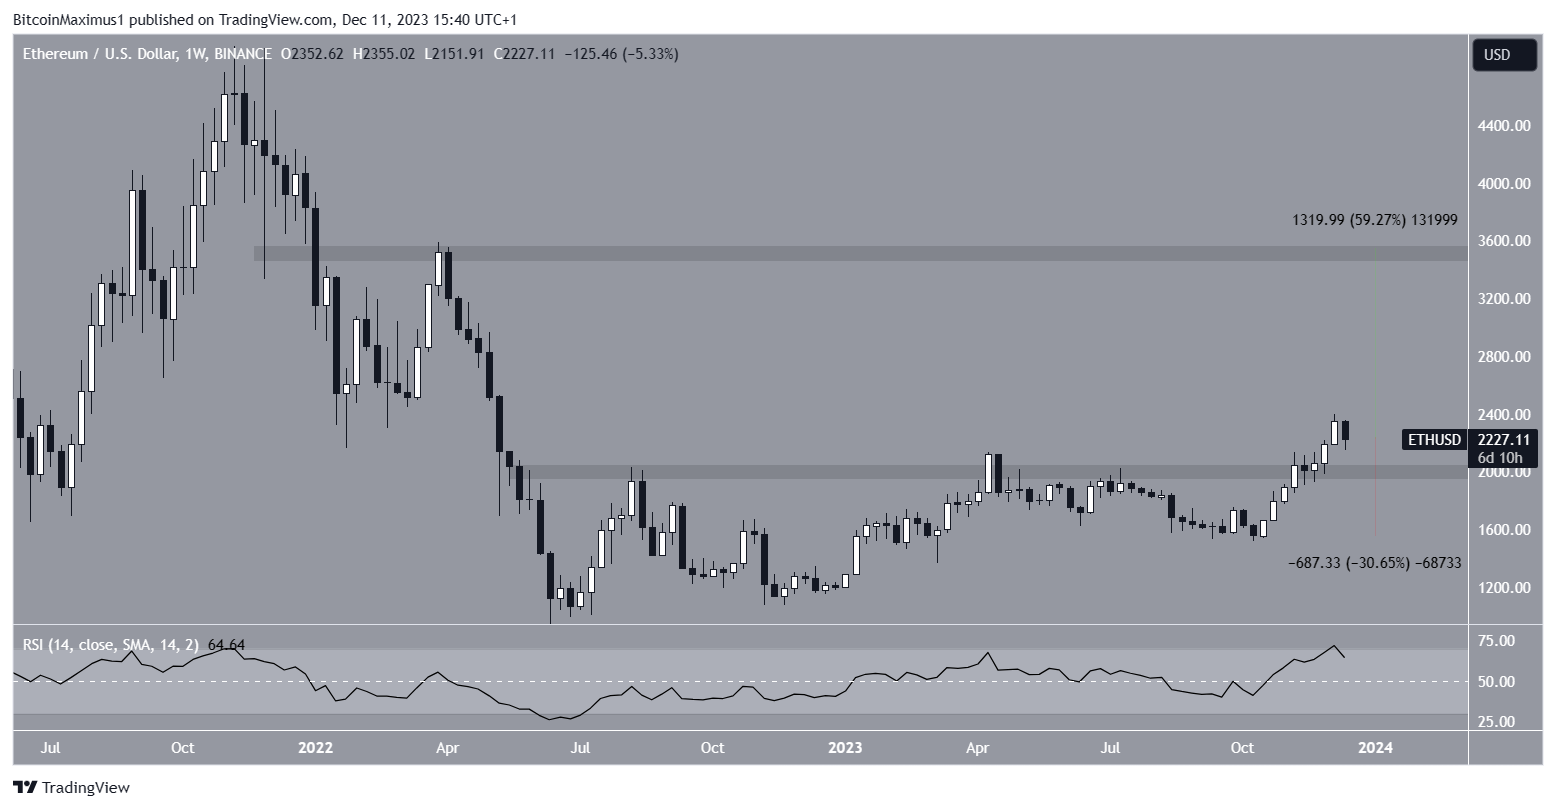
Despite this bullish ETH price prediction, a weekly close below $2,000 will invalidate the breakout. The ETH price will likely decrease by 30% to the next support at $1,500 in that case.
For BeInCrypto’s latest crypto market analysis, click here.
