


The Ethereum (ETH) price has fallen since reaching a new yearly high on July 14. The downward movement caused a breakdown from an ascending support line, confirming that the ETH price is corrected.
While the price action confirms the validity of the breakdown, the wave count indicates that a bottom will be reached soon. Then, the ETH price will resume its ascent.
Ethereum Drop Takes Price Below Support
The daily time frame technical analysis for the Ethereum price gives mixed signals. This is because of the price action and technical indicators.
Since June 10, the ETH price and an ascending support line (solid) have increased. The trend was considered bullish as long as the line was in place.
Read More: Ethereum (ETH) Price Prediction
However, the ETH price has fallen since July 14 and broke down from the line six days later. This is a sign that the previous upward movement has ended, and a new downward movement has now begun.
The next closest support is at a long-term ascending support line (dashed) at $1,800.
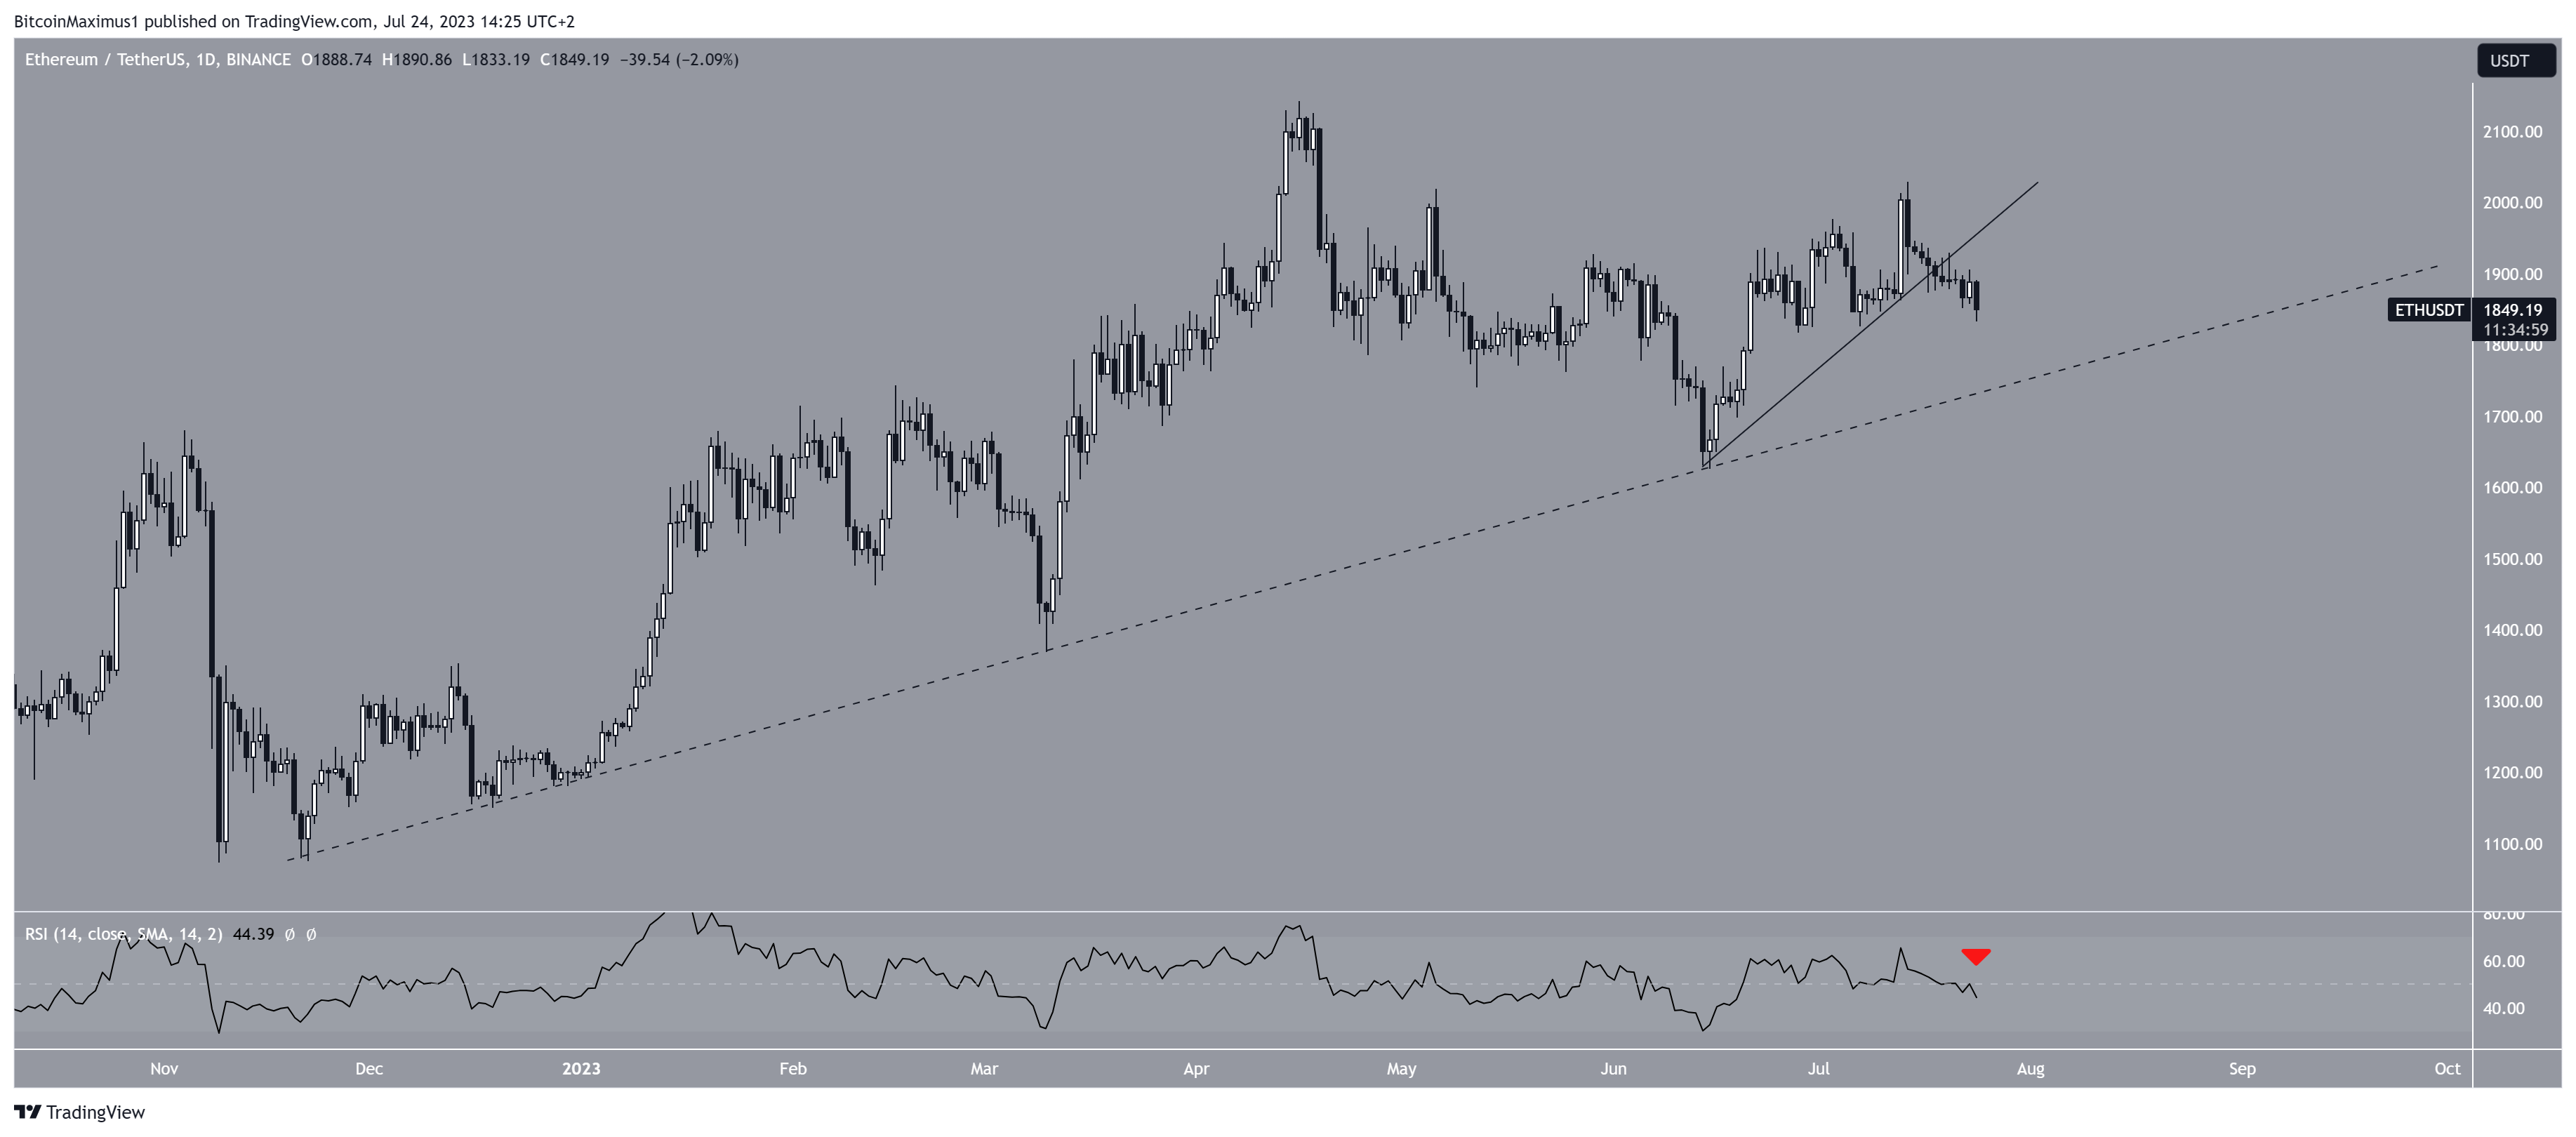
The daily RSI is bearish, legitimizing the Ethereum price drop. The RSI is an indicator that traders rely on to evaluate market conditions. When the RSI value is above 50 and shows an upward trend, it indicates a positive situation for bullish investors. Conversely, a value below 50 implies the opposite.
The RSI is currently falling and is below 50 (red icon), indicating that the trend is bearish.
Read More: How To Make Money in a Bear Market
ETH Price Prediction: How Long Will Correction Continue?
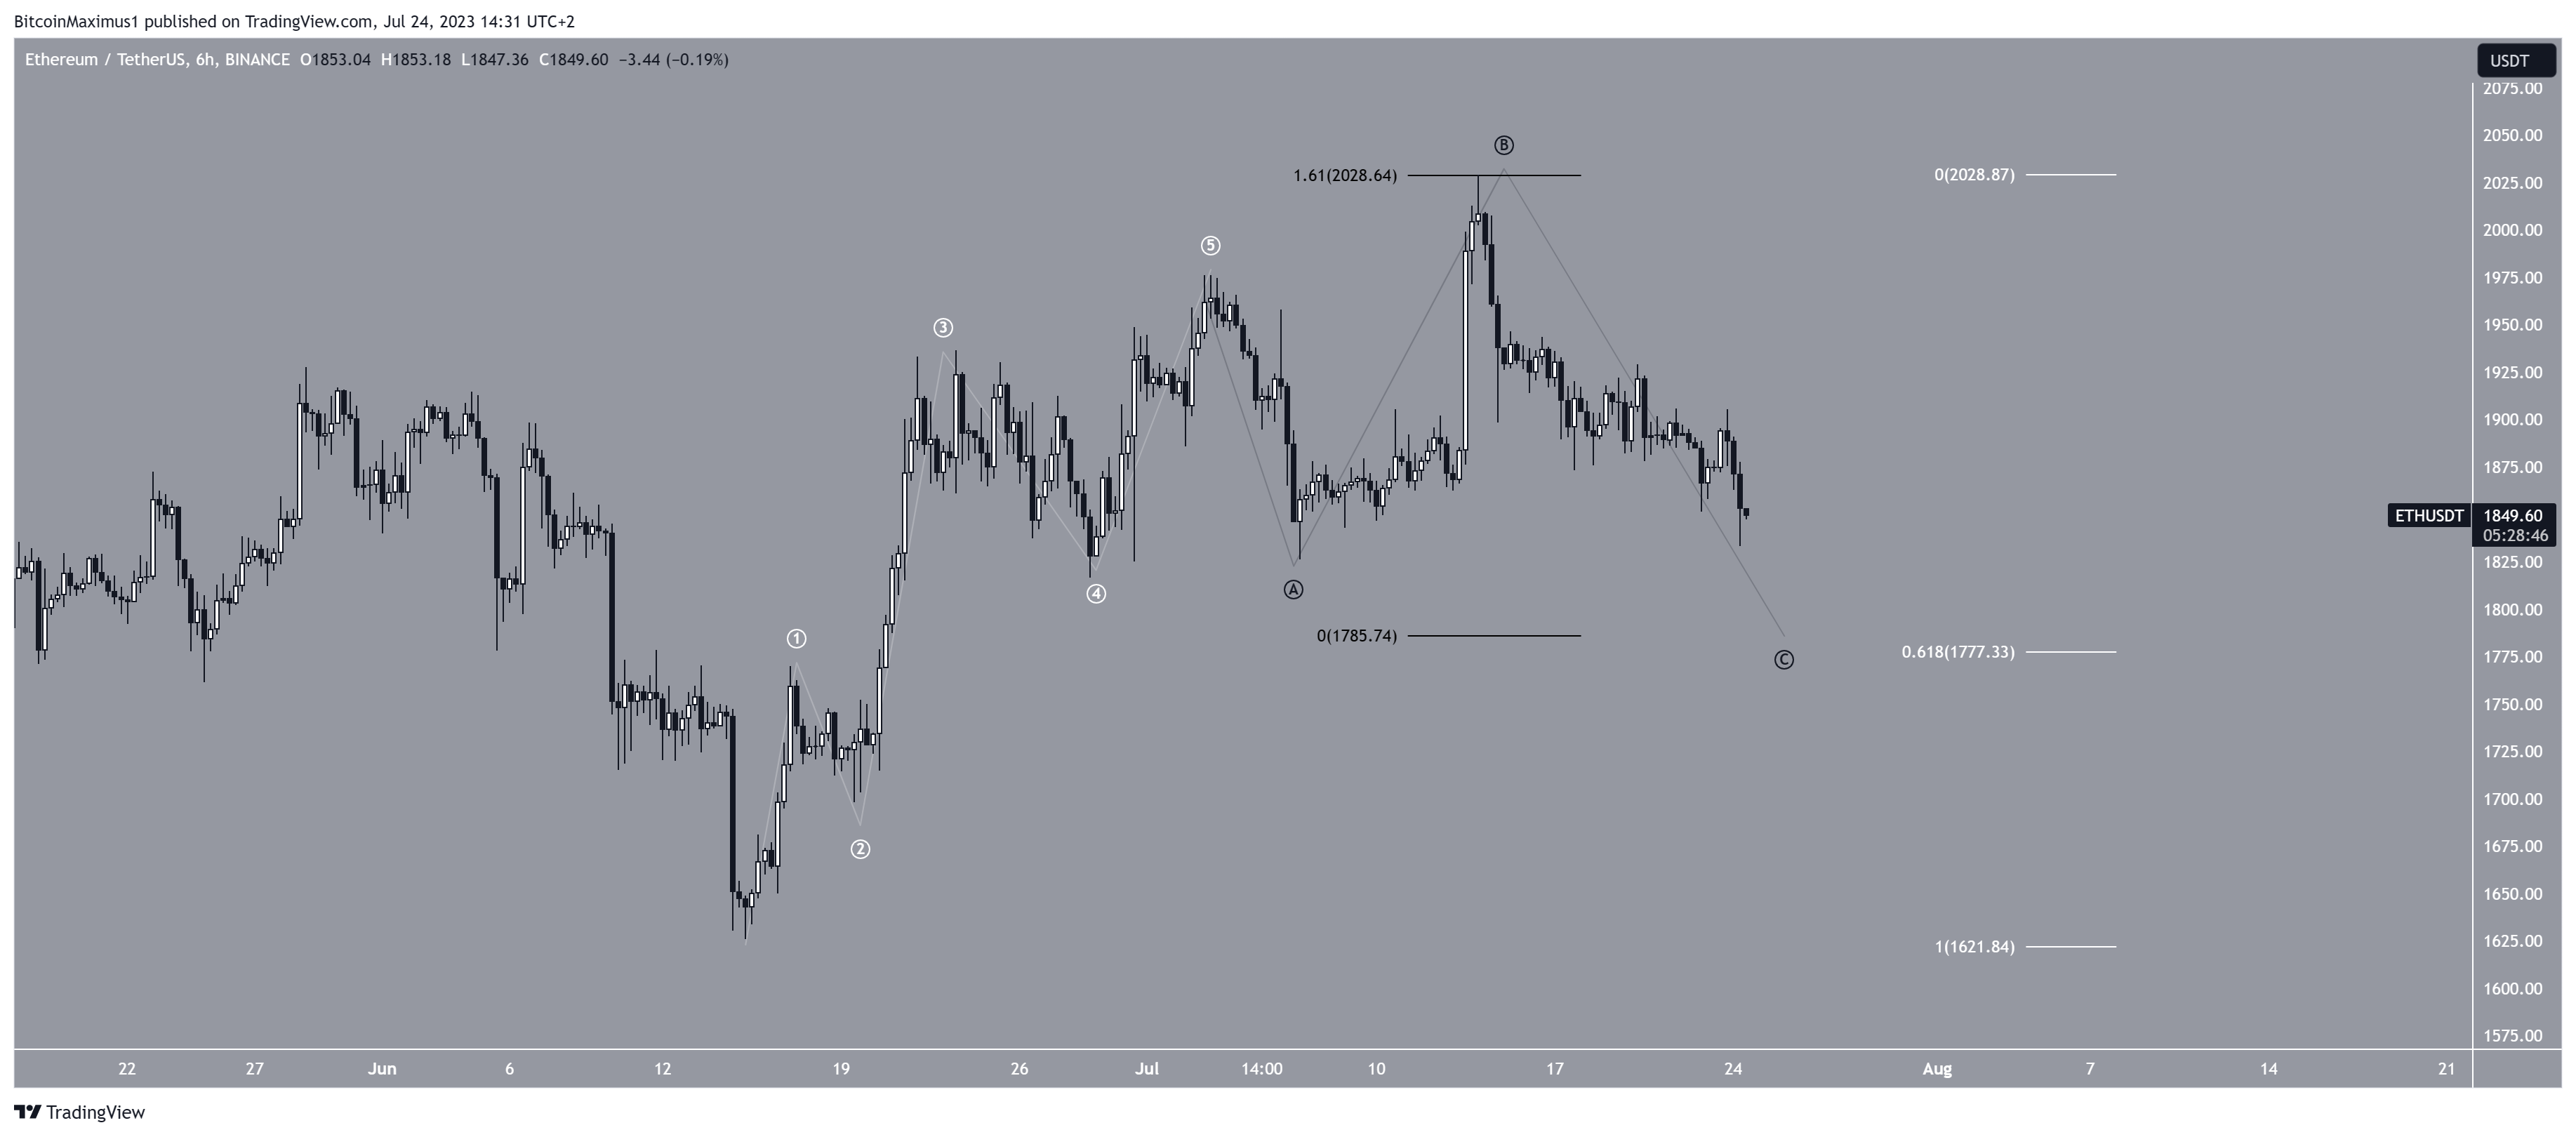
The technical analysis of the shorter-term six-hour time frame supports the legitimacy of the breakdown. However, it also indicates that the downward movement will end soon.
According to the Elliot Wave count, the ETH price has completed a five-wave increase (white) and is now mired in an A-B-C corrective structure. If so, it is currently in the C wave, which will complete the correction. Technical analysts utilize the Elliott Wave theory to ascertain the trend’s direction by studying recurring long-term price patterns and investor psychology.
Giving waves A:C a 1:1.61 ratio will lead to a low near $1,780. This also aligns with the 0.618 Fib retracement support level (white). According to the Fibonacci retracement levels theory, following a significant price change in one direction, the price is expected to partially return to a previous price level before continuing in the same direction.
Due to this confluence, the ETH price will likely complete its correction at the $1,780 level before resuming its upward movement toward $2,000.
Despite this bullish long-term ETH price prediction, falling below the June 10 low of $1,648 will mean that the decrease is not corrective but rather that the trend is still bearish. In that case, the ETH price could fall to $1,450.


